
June 8, 2026
The Anatomy of an Oil Market Built on Assumptions
Energy markets have a long history of mispricing geopolitical risk, not because analysts lack intelligence, but because the human tendency to discount low-probability, high-consequence events is nearly impossible to fully override. The 1973 Arab Oil Embargo, the Iranian Revolution of 1979, and the Gulf War disruptions all shared a common precursor: a market operating with high confidence in conditions that were about to change violently. In 2026, that same psychological pattern appears to be playing out again, this time against the backdrop of the Strait of Hormuz oil disruption, an event that the World Bank has characterised as the largest oil market shock in recorded history.
What makes the current situation analytically unusual is not the disruption itself, but the market's response to it. Prices have retreated substantially from their peak even as the physical supply gap persists and inventories drain at an accelerating pace. Understanding why requires examining not just what is happening in global oil markets, but what traders believe is about to happen, and how fragile those beliefs actually are.
When big ASX news breaks, our subscribers know first
A Chokepoint Unlike Any Other: The Physical Geography of Dependency
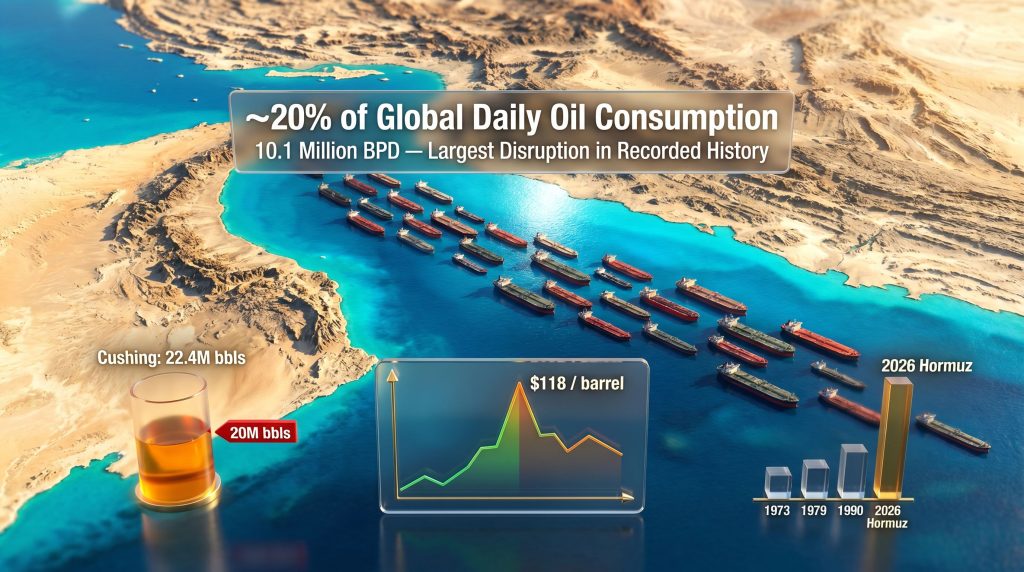
The Strait of Hormuz sits at the mouth of the Persian Gulf, forming the only maritime corridor connecting Gulf producers to the broader global ocean network. Under normal operating conditions, approximately 20 to 21 million barrels per day of crude oil and refined petroleum products move through this narrow waterway, representing close to 20% of total global daily consumption. No alternative pipeline network exists that can absorb flows of this magnitude at scale.
The dependency is heavily concentrated among Asian importers. Japan, South Korea, India, and China collectively source a substantial majority of their crude from Gulf producers whose only viable export route runs through Hormuz. This geographic concentration of vulnerability is precisely what transforms a regional military conflict into a global energy emergency. According to analysis from the Strauss Center, the consequences of a sustained Hormuz disruption extend well beyond crude oil markets into liquefied natural gas and refined products.
To understand how the 2026 Strait of Hormuz oil disruption compares against prior supply shocks, the historical record is instructive:
| Disruption Event | Year | Estimated Supply Loss (bpd) | Approximate Price Spike |
|---|---|---|---|
| Arab Oil Embargo | 1973 | ~4.3 million | ~300% |
| Iranian Revolution | 1979 | ~5.6 million | ~150% |
| Gulf War (Kuwait) | 1990–91 | ~4.3 million | ~90% |
| Hormuz Closure 2026 | 2026 | ~10.1 million | ~65% (Brent, by end of March) |
The scale of the current disruption, at roughly 10.1 million barrels per day of lost supply, exceeds every prior oil shock in recorded history by a considerable margin. Yet the price response has been proportionally smaller than most historical precedents, a divergence that demands explanation.
The Numbers Behind the Disruption: What the Data Actually Shows
The conflict began on February 28, 2026, and effectively halted normal tanker traffic through the Strait. By March, Brent crude had climbed to a four-year high of $118 per barrel. Since then, however, prices have retreated to below $95, representing a decline of more than 19% from peak. These crude oil price trends have confounded analysts who expected a sustained upward trajectory given the scale of the supply disruption.
This price softening has occurred against a backdrop of accelerating inventory drawdowns. According to data from the U.S. Energy Information Administration:
- Global crude and refined product stockpiles fell at a rate of 5.27 million bpd in March 2026
- That drawdown pace accelerated to 8.62 million bpd in April
- May's drawdown rate approached 9 million bpd
- June projections, incorporating seasonal Northern Hemisphere demand increases, point toward drawdowns of approximately 11 million bpd
To contextualise these numbers: drawing down 11 million barrels of oil from global storage every single day is equivalent to consuming Saudi Arabia's entire pre-war daily production output, repeatedly, with no replenishment. The arithmetic of how long current stockpiles can sustain this pace is not reassuring.
The situation in the United States is particularly acute. Total U.S. crude inventories, combining commercial stocks with the Strategic Petroleum Reserve, have fallen by roughly 10% year-to-date in 2026 to approximately 1.5 billion barrels, the lowest level recorded since 2004. At Cushing, Oklahoma, the physical delivery hub for WTI and Brent futures contracts, inventories declined to 22.4 million barrels in early June. Industry participants widely regard 20 million barrels as the minimum threshold below which the hub's operational integrity and pricing function begin to break down. That threshold is now uncomfortably close.
Once storage systems approach their operational minimums, known in industry terminology as tank bottoms, markets typically respond with sharp upward price movements that are driven by genuine physical scarcity rather than sentiment. The current trajectory is compressing the timeframe before that mechanism activates.
Why the Market Appears Calmer Than the Fundamentals Justify
The apparent contradiction between deteriorating fundamentals and retreating prices reflects several overlapping forces that have collectively suppressed risk premiums.
Strategic reserve releases have cushioned the immediate physical supply gap, with multiple governments coordinating drawdowns to maintain downstream fuel availability. This has reduced the urgency that would otherwise force a more severe price signal.
China's reduced import activity has provided unintended relief to other buyers. With Chinese seaborne crude imports falling to 6.36 million bpd in May 2026, the lowest level in nearly a decade, competition among importers for scarce available cargoes has eased. This has temporarily reduced upward pressure on spot prices.
Diplomatic optimism has been a consistent moderating factor. Repeated suggestions from Washington about the proximity of a U.S.-Iran agreement have encouraged traders to price in a near-term resolution. The problem is that observable conditions on the ground have not validated those expectations, and both parties have continued military activities across the region while negotiations remain unresolved.
Stealth cargo movements through informal routing arrangements have created a perception of partial resumption that does not reflect a sustainable or scalable solution for large integrated energy companies, which operate under strict insurance and regulatory requirements that informal channels cannot satisfy.
The net result is a market that is pricing expectations rather than observable conditions, a structurally precarious position when those expectations rest on assumptions that cannot be verified. Furthermore, the trade war and oil prices dynamic adds another layer of complexity, as tariff-driven demand concerns have compounded the difficulty of reading near-term price signals accurately.
China's Role: The Variable That Could Change Everything
China occupies a uniquely powerful and opaque position in the current supply-demand equation. As the world's largest crude importer, its behaviour carries enormous weight. Its decision to sharply curtail seaborne purchases has, paradoxically, provided temporary relief to global markets. However, this creates a compounded uncertainty that is arguably more dangerous than straightforward tightness.
There are three credible interpretations of China's reduced import volumes:
1. Strategic reserve substitution: Beijing may be drawing on its substantial but non-transparent strategic petroleum reserves to maintain domestic consumption levels without competing on international spot markets. If true, global supply is materially tighter than current prices imply, and China's reserves will eventually require replenishment through aggressive re-entry into the market.
2. Genuine demand destruction: Elevated prices may have suppressed Chinese industrial output and transportation fuel consumption more sharply than outside analysts estimate. In this scenario, lower imports reflect reduced demand rather than substitution, which would represent a meaningful demand-side buffer.
3. Tactical positioning: China may be deliberately waiting for prices to soften before restoring import volumes, a strategy that would allow it to rebuild stockpiles at lower cost once diplomatic conditions create a buying opportunity.
The critical difficulty is that China does not publish timely or comprehensive domestic consumption data. This means the market has no reliable mechanism for distinguishing between these three scenarios in real time. The uncertainty band around China's true consumption position is enormous, and its potential re-entry as an active buyer could trigger a sharp upward repricing of global crude benchmarks with very little warning.
Demand Destruction: The Metric That Cannot Be Measured in Real Time
Supply can be tracked. Tanker movements, pipeline flows, port records, and satellite imagery all provide near-real-time visibility into production and transit. Demand, by contrast, is fragmented across billions of individual end-users and typically reported with significant time lags. In some cases, particularly China, it is not reported comprehensively at all.
This asymmetry creates a fundamental measurement problem for oil traders and analysts attempting to balance the supply-demand equation in real time. The IEA's revision of its 2026 demand outlook illustrates how dramatically the picture has shifted:
| Metric | Pre-Disruption Forecast | Post-Disruption Forecast |
|---|---|---|
| Full-year 2026 demand growth | +1.3 million bpd | -420,000 bpd contraction |
| Q2 2026 demand change | Modest growth | -2.45 million bpd decline |
| May 2026 demand (select estimates) | Growth trajectory | Up to -5 million bpd decline |
The range between the IEA's -2.45 million bpd Q2 estimate and some independent trading house estimates of -5 million bpd for May alone is itself larger than many historical supply disruptions. This uncertainty band does not reflect analytical failure; it reflects the genuine opacity of demand-side data in a period of rapid structural change.
The next major ASX story will hit our subscribers first
Regional Exposure: Who Bears the Greatest Physical Risk
The geographic distribution of exposure to the Strait of Hormuz oil disruption is highly uneven:
Asia carries the most direct physical burden. Japan and South Korea operate with limited domestic production and minimal geographic diversification of supply routes, making them acutely vulnerable to sustained Hormuz restrictions. India has partially offset reduced Gulf imports through alternative suppliers and emergency procurement, but at substantially higher cost. Reports of fuel shortages, refinery run cuts, and informal rationing have emerged from multiple Asian markets.
GCC producers face a paradoxical situation. Saudi Arabia, the UAE, Kuwait, and Qatar would ordinarily benefit from elevated crude prices, but the closure of their primary export route limits their capacity to monetise higher prices. In addition, OPEC market influence has been constrained by these same transit restrictions, with the OPEC output increase of 188,000 bpd for July 2026 having limited practical impact on deliverable supply given continued shipping access restrictions.
Europe and the United States are experiencing secondary effects through elevated downstream prices rather than direct physical shortages. Jet fuel, diesel, and gasoline costs have risen materially, creating inflationary pressure that central banks in both regions must navigate without triggering broader economic slowdowns. This places energy policy directly in tension with monetary policy in a way that has few modern precedents.
Four Scenarios: Where Oil Markets Go From Here
| Scenario | Key Trigger | Brent Price Outlook | Inventory Trajectory |
|---|---|---|---|
| Rapid Diplomatic Resolution | U.S.-Iran deal within 4-6 weeks | Sharp correction toward $70-80 | Gradual rebuild over 6-12 months |
| Prolonged Stalemate | No deal; partial workarounds continue | Range-bound $90-105 with elevated volatility | Continued drawdown; Cushing approaches operational floor |
| Escalation | Renewed strikes on energy infrastructure | Spike toward $130-150+ | Accelerated depletion; strategic reserve exhaustion risk |
| China Re-entry | Beijing resumes full import volumes | Upward pressure; $110-120 range | Drawdown rate accelerates sharply |
Note: Price and inventory projections represent scenario analysis for informational purposes only and do not constitute financial advice. Actual market outcomes will depend on geopolitical developments, demand responses, and policy decisions that are inherently unpredictable.
The Deeper Lesson: Energy Infrastructure Built Around a Single Point of Failure
Beyond the immediate supply shock, the 2026 Strait of Hormuz oil disruption has exposed a structural vulnerability in global energy architecture that has been understood for decades but never adequately addressed. Roughly one-fifth of the world's daily oil consumption depends on the continuous, uninterrupted navigability of a waterway less than 40 kilometres wide at its narrowest point.
The disruption has renewed policy urgency around several long-discussed but slowly progressing initiatives:
- Expansion of existing pipeline bypass capacity in Saudi Arabia and the UAE, including the UAE's Abu Dhabi Crude Oil Pipeline, which has capacity of approximately 1.5 million bpd but cannot compensate for the full Hormuz volume
- Acceleration of strategic petroleum reserve capacity expansion in major importing nations
- Investment in alternative energy corridors and diversified supply relationships
- Improvement of demand-side data infrastructure, particularly regarding China, whose opacity now represents a systemic risk to market functioning
The Strait of Hormuz oil disruption has also demonstrated that the oil market's sophisticated monitoring tools, which are highly effective at tracking supply, have no equivalent on the demand side. The industry can tell you within a reasonable margin how many barrels left a terminal yesterday. It cannot tell you with comparable confidence how many were consumed. Closing that information gap has become an urgent priority for market functioning, not merely an analytical convenience.
The current pricing environment, where benchmarks have retreated despite an ongoing, historically unprecedented supply disruption, may ultimately be remembered not as a demonstration of market resilience, but as a warning about the risks of pricing sentiment over observable fundamentals. When the assumptions underpinning that calm prove incorrect, the adjustment is unlikely to be gradual.
This article is intended for informational purposes only and does not constitute investment or financial advice. Forward-looking statements, scenario projections, and demand estimates referenced herein are subject to significant uncertainty. Readers should consult qualified financial and energy market professionals before making investment decisions. Additional context on global oil market dynamics and the geopolitics of energy chokepoints is available through ongoing coverage published by Reuters and the International Energy Agency.
Want to Stay Ahead of the Market Opportunities Created by Energy and Commodity Shocks?
Discovery Alert's proprietary Discovery IQ model delivers real-time alerts on significant ASX mineral discoveries the moment they hit the exchange, turning complex commodity data into clear, actionable insights for investors at every experience level. Explore Discovery Alert's dedicated discoveries page to understand how historically significant resource discoveries have generated substantial returns, and begin your 14-day free trial today to position yourself ahead of the broader market.