
June 19, 2026
The Invisible Bottleneck: How 33 Kilometres of Water Controls the Global Energy System
The physics of global oil markets are deceptively simple: crude moves from where it is extracted to where it is consumed, and the price of that movement is determined as much by geography as by supply and demand fundamentals. Yet within this system, a single corridor measuring just 33 kilometres at its narrowest point exercises a degree of leverage over global energy pricing that no single producer, cartel, or government can fully replicate. Understanding why that leverage exists — and why unwinding it is far slower than markets typically anticipate — is one of the most practically important frameworks an energy investor can hold.
When big ASX news breaks, our subscribers know first
The Scale of What Strait of Hormuz Oil Flows Actually Represent
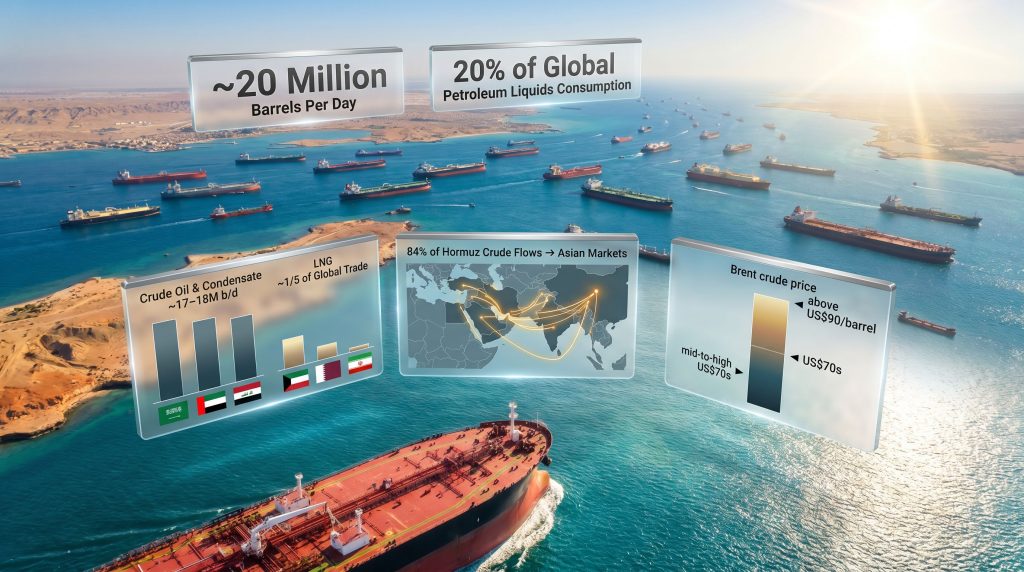
The numbers attached to Strait of Hormuz oil flows are extraordinary by any measure. According to U.S. Energy Information Administration (EIA) data, approximately 20 million barrels per day (b/d) transited the strait in 2024, representing roughly 20% of total global petroleum liquids consumption and more than one-quarter of all seaborne oil trade worldwide. No other maritime chokepoint comes close to concentrating this volume of energy trade in a single corridor.
The commodity composition of those flows deserves attention beyond the headline crude figure:
| Commodity Type | 2024 Volume (Estimate) | Primary Exporters |
|---|---|---|
| Crude Oil and Condensate | ~17 to 18 million b/d | Saudi Arabia, UAE, Iraq, Kuwait, Iran |
| Refined Petroleum Products | Rising (+0.5M b/d vs. 2022) | Gulf-based refiners |
| Liquefied Natural Gas | ~20% of global LNG trade | Qatar |
Between 2022 and 2024, crude and condensate volumes through the strait actually declined by approximately 1.6 million b/d, partially offset by a 0.5 million b/d rise in refined product cargoes. This compositional shift reflects the rapid expansion of Gulf refining capacity and is a structural development that most headline coverage ignores entirely.
Saudi Arabia alone contributed roughly 38% of all Hormuz crude flows in 2024, equivalent to approximately 5.5 million b/d. A disruption targeting Saudi export logistics specifically would therefore carry a disproportionate impact on the global benchmark price. Furthermore, understanding crude oil volatility trends is essential context for any investor monitoring this corridor.
Asia Bears the Weight: Who Is Actually Exposed to Strait of Hormuz Disruption
The geographic concentration of Hormuz dependency is as striking as the volume figures. EIA tracking data shows that in 2024, 84% of all crude oil and condensate transiting the strait was destined for Asian markets, with 83% of LNG following the same eastward trajectory.
| Region | Crude/Condensate Share | LNG Share |
|---|---|---|
| Asia (aggregate) | ~84% of Hormuz flows | ~83% of Hormuz LNG |
| Europe | Secondary exposure | Moderate |
| United States | Indirect via price transmission | Low direct volume |
For Japan, South Korea, India, and China, this is not an abstract financial risk. A sustained closure of the Strait of Hormuz converts from a price event into a physical supply emergency within days, given the limited strategic reserve capacity these nations hold relative to their import dependency.
This asymmetric vulnerability explains why Asian energy ministries consistently classify Hormuz risk as a tier-one strategic concern while Western market commentary often frames it primarily as a price volatility story. In addition, disruptions to global LNG supply compound the challenge for Asian buyers who rely heavily on Qatari volumes transiting this same corridor.
Why Bypass Routes Cannot Fill the Gap
The EIA is explicit that very few practical alternatives exist for Gulf-origin crude if the strait is closed. The two most commonly cited bypass pipelines are Saudi Arabia's East-West Pipeline (Petroline) and the Abu Dhabi Crude Oil Pipeline (ADCOP), but their combined theoretical maximum capacity tells a sobering story:
| Bypass Route | Operator | Max Capacity (b/d) | Coverage of Hormuz Flows |
|---|---|---|---|
| East-West Pipeline (Petroline) | Saudi Aramco | ~5 million b/d | ~25% of Saudi Hormuz exports |
| Abu Dhabi Crude Oil Pipeline | ADNOC | ~1.5 million b/d | Partial UAE volumes only |
| Iraq-Turkey Pipeline (Kirkuk-Ceyhan) | Various | ~0.4 to 0.6 million b/d | Minimal |
| Total Combined Bypass | ~7 million b/d (max) | ~35% of normal flows |
Even at full theoretical utilisation, existing infrastructure can redirect only approximately one-third of normal Hormuz throughput. Rerouting tankers via the Cape of Good Hope adds two to three weeks to voyage times and materially increases freight and insurance costs, further compressing the economic viability of that alternative.
How the Risk Premium Mechanism Works in Energy Futures
One of the most frequently misunderstood dynamics in energy markets is the relationship between geopolitical threat and futures pricing. Markets do not wait for physical disruption to materialise. Instead, traders embed an anticipated disruption premium into Brent crude futures as soon as the credibility of a closure threat rises above a threshold level.
Historically, this geopolitical risk premium has ranged from $5 to over $15 per barrel, depending on the perceived severity and duration of the threat. What makes the current environment particularly instructive is the reversal of that mechanism: as diplomatic progress toward a U.S.-Iran agreement has advanced, futures markets have moved to rapidly deflate the premium that had been baked in for months.
When Strait of Hormuz closure risk decreases, oil futures prices typically fall faster than physical supply actually recovers, because markets price in expected future supply relief rather than current barrel availability. This creates a meaningful and often exploitable gap between futures pricing and real-world throughput conditions.
Brent crude retreating below US$80 per barrel and into the high US$70s reflects exactly this mechanism: futures markets pricing in relief that has not yet materialised in the physical supply chain. The practical lag between a diplomatic agreement and restored oil throughput is measured in weeks to months, not days or hours. These oil price movements can create significant near-term dislocations for traders and producers alike.
Step-by-Step: Why Restoring Hormuz Oil Flows Takes Longer Than Markets Assume
The sequential nature of supply chain restoration is critical to understanding this lag. Each of the following steps must occur in order, and none can be meaningfully accelerated by political will alone:
- Diplomatic agreement finalised — the geopolitical risk premium begins deflating in futures markets immediately upon credible signals of resolution.
- Shipping insurance markets reassess — war-risk premiums on hull and cargo policies must be formally revised by Lloyd's of London and other major underwriters before commercial operators will commit vessels.
- Tanker operators re-enter the corridor — shipping companies require confirmed navigational safety assurances and updated insurance coverage before routing vessels back through the strait.
- Port and terminal operations resume — loading facilities, pilot services, harbour logistics, and maritime traffic management systems require operational reactivation.
- Trade finance and cargo credit reopen — banks financing commodity cargoes must re-enable credit lines and letters of credit for trade flows that may have been suspended or rerouted.
- Buyer procurement cycles restart — Asian refiners and LNG utilities must re-tender contracts, rebuild forward purchase schedules, and negotiate delivery terms.
- Physical volumes normalise — only at this final stage does actual throughput approach pre-disruption levels.
Each of these steps introduces its own delay. Commentary suggesting oil flows can be rapidly restored upon a diplomatic handshake underestimates the operational complexity of a system that, as energy market analysts have noted, is driven by millions of moving parts across the global economy.
U.S. Crude Inventories and the Strategic Reserve Question
A significant driver of current market attention on Hormuz is the state of U.S. commercial crude inventories, which the EIA has flagged as sitting at their lowest levels since approximately 1983. This depletion creates substantial absorption capacity in the market: incoming supply can be accommodated without immediately triggering price collapse, because the inventory deficit acts as a buffer that absorbs new barrels before they exert downward price pressure.
| Reserve Category | Current Status (EIA, 2025) | Strategic Function |
|---|---|---|
| Commercial Crude Inventories | ~40-year low | Short-term price buffer |
| Strategic Petroleum Reserve (SPR) | Partially depleted | Emergency supply stabilisation |
| Combined Effective Buffer | Limited (est. ~4 days at full domestic halt) | Price signal management, not supply independence |
A frequently circulated narrative holds that depleted U.S. inventories are the primary driver behind diplomatic engagement with Iran. This framing deserves scrutiny. While commercial stocks are historically low, the U.S. maintains strategic reserves in addition to commercial inventories, and the actual drawdown attributable to the conflict period has been moderate relative to total reserve capacity.
A straightforward calculation illustrates the limits of the reserve-as-fortress argument: if U.S. domestic production were entirely halted, existing reserves would cover only approximately four days of total consumption, confirming that the SPR is a price-stabilisation instrument rather than an energy independence mechanism. The tidy narrative of America running dry may be more appealing than it is accurate.
Historical Precedents: How Markets Have Behaved Around Hormuz Events
The historical record of Hormuz disruption events offers a consistent and instructive pattern for calibrating current market behaviour:
| Event | Nature of Hormuz Impact | Brent Price Response |
|---|---|---|
| Tanker War (1984 to 1988) | Partial disruption, attacks on shipping | Elevated volatility; structural risk premium |
| Gulf War (1990 to 1991) | Imminent closure threat; Kuwait invasion | Brent briefly spiked toward $40/barrel |
| Iranian Nuclear Tensions (2011 to 2012) | Repeated Iranian closure threats | Estimated $10 to $20/barrel premium |
| Tanker Attacks (2019) | Targeted vessel incidents | Short-term $2 to $4/barrel spike |
| Post-2024 Middle East Escalation | Elevated closure risk; sustained disruption | Sustained fat risk premium for several months |
The pattern that emerges across each episode is consistent: markets overshoot on both the upside during fear events and the downside during relief events, relative to actual physical supply changes. The asymmetry of risk — where closure is catastrophic in its immediacy but reopening is gradual in its operational recovery — means downside price moves on diplomatic relief news tend to outpace the physical supply recovery they ostensibly reflect.
However, the broader trade war oil impact on pricing adds an additional layer of complexity, as demand-side shocks from geopolitical trade disputes can compound or offset the supply-side pressures originating from the strait.
The next major ASX story will hit our subscribers first
Scenario Framework: Where Brent Crude Goes From Here
Three credible scenarios frame the near-term price outlook for oil, with meaningfully different implications for energy equities and commodity positioning:
Scenario A: Full diplomatic resolution with unimpeded transit restored
- Brent crude likely trades in the mid-to-high US$70s as the risk premium fully deflates
- Asian LNG spot prices face downward pressure as Qatari volumes normalise
- Medium-term trajectory depends heavily on OPEC's market influence and production discipline
Scenario B: Partial agreement reached, but geopolitical uncertainty persists
- A residual risk premium of $3 to $8 per barrel likely remains embedded in Brent
- Elevated shipping insurance costs continue to suppress full volume recovery
- The futures curve may shift into contango as near-term relief is priced in while long-term uncertainty endures
Scenario C: Agreement collapses and the strait remains contested
- Brent crude likely retests levels above US$90 per barrel as supply disruption risk is repriced sharply higher
- Asian energy importers face acute procurement pressure and potential strategic reserve drawdowns
- IEA member nations may coordinate SPR releases as a price management tool
The oil market's current pricing trajectory reflects Scenario A optimism, while the physical supply chain is effectively operating under Scenario B conditions. This gap between market pricing and operational reality is precisely where near-term volatility risk is most concentrated.
The Long-Term Structural Problem That Hormuz Keeps Exposing
Beyond the immediate price cycle, the current episode reinforces a structural vulnerability in the global energy system that decades of policy intent have failed to meaningfully resolve. Asia's 84% dependency on Hormuz crude flows is not a new finding. It has been documented, modelled, and discussed in energy security circles for decades. Yet the underlying exposure has barely shifted.
Investment in LNG import terminal diversification is accelerating across Japan, South Korea, and India. Pipeline route expansion through Central Asian corridors is gaining momentum, particularly within China's dual-track strategy of maintaining Gulf import relationships while expanding overland supply alternatives. However, the transition timeline for these diversification investments means that fossil fuel Hormuz dependency will remain a material geopolitical risk factor for at least the next 15 to 20 years.
The energy security argument for accelerating renewable capacity buildout in import-dependent Asian economies is, paradoxically, strengthened every time Hormuz disruption risk spikes. According to analysis from the Brookings Institution, each episode quantifies, in real-time price terms, the cost of geographic supply concentration. Whether that price signal translates into accelerated diversification investment or simply normalises back into the baseline risk premium remains the central structural question for Asian energy policy over the coming decade.
FAQ: Strait of Hormuz Oil Flows Explained
How much oil flows through the Strait of Hormuz each day?
Approximately 20 million barrels per day transited the Strait of Hormuz in 2024, representing roughly 20% of global petroleum liquids consumption and more than one-quarter of all global seaborne oil trade, according to EIA data.
Which country sends the most oil through the Strait of Hormuz?
Saudi Arabia accounted for approximately 38% of all crude oil and condensate flowing through the strait in 2024, equivalent to around 5.5 million barrels per day.
Can oil bypass the Strait of Hormuz through pipelines?
Partially, but not at scale. Combined bypass pipeline capacity, including Saudi Arabia's East-West Pipeline and the Abu Dhabi Crude Oil Pipeline, covers a theoretical maximum of approximately 7 million b/d, or roughly 35% of normal Hormuz throughput.
Why do oil futures fall before actual supply returns after a Hormuz agreement?
Futures markets price anticipated supply conditions, not current physical availability. When diplomatic progress credibly signals an end to disruption, traders immediately deflate the geopolitical risk premium, causing prices to fall before any additional barrel has physically transited the strait.
How long does it take for oil flows to fully recover after a Hormuz closure?
Full recovery typically requires weeks to months, encompassing sequential re-establishment of shipping insurance, tanker operator confidence, port logistics, trade finance, and buyer procurement cycles. As Reuters has reported, the operational complexity of this recovery process is consistently underestimated by financial markets.
Disclaimer: This article is intended for informational and educational purposes only. It does not constitute financial or investment advice. Readers should conduct their own research and consult a licensed financial adviser before making any investment decisions. Forecasts, scenario projections, and price references involve inherent uncertainty and should not be relied upon as predictions of future outcomes.
Want to Stay Ahead of the Next Major Resource Discovery?
Discovery Alert's proprietary Discovery IQ model delivers real-time alerts on significant ASX mineral discoveries, instantly converting complex data across more than 30 commodities into a single, actionable gold-equivalent metric — explore historic examples of exceptional discovery returns to understand the opportunity, then begin your 14-day free trial at Discovery Alert to position yourself ahead of the broader market.