August 20, 2026
When Geography Becomes Destiny: The Energy Chokepoint That Controls Global Growth
Energy markets have a long history of geographic determinism. The location of a pipeline, the depth of a harbour, the width of a channel separating two bodies of water: these physical realities have always shaped the economics of energy supply in ways that no policy framework, diplomatic agreement, or technological innovation has fully managed to override. The Strait of Hormuz is the most consequential expression of this principle in the modern energy system. And right now, it is failing in its most fundamental function.
The extended Strait of Hormuz oil and LNG squeeze has moved decisively beyond the category of temporary market disruption. Physical supply data, freight market signals, and downstream product pricing are collectively telling a story that headline crude benchmarks have, until recently, obscured: this is a structural energy crisis, not a correctable shock.
When big ASX news breaks, our subscribers know first
The Geography of Irreplaceability
The Strait of Hormuz is a navigable channel approximately 21 miles wide at its narrowest point, connecting the Persian Gulf to the Gulf of Oman before opening into the broader Arabian Sea. Under normal operating conditions, this narrow passage carries approximately 20 million barrels per day of crude oil and petroleum products, representing roughly 25% of all seaborne oil trade globally. No other single maritime chokepoint comes close to matching this concentration of energy flow.
The LNG dimension compounds the risk profile significantly. Qatar and the UAE together account for nearly 20% of global LNG export volumes, and virtually all of that production transits Hormuz on its way to Asian and European buyers. Furthermore, unlike crude oil, which can sometimes be redirected through alternative loading infrastructure, LNG is constrained by the physical location of liquefaction terminals and the long-term contractual structures that bind producers to specific delivery routes and receiving terminals. Disruptions to global LNG supply at this scale have no modern precedent.
Pipeline alternatives exist on paper, but each faces critical constraints:
| Proposed Route | Estimated Cost | Estimated Completion | Current Status |
|---|---|---|---|
| Iraq-Syria pipeline bypass | ~$15 billion | ~4 years | Planning stage |
| UAE Habshan-Fujairah pipeline | Partial capacity only | Operational but limited | Insufficient for full bypass |
| Saudi East-West pipeline | Existing but constrained | Operational | Below Hormuz throughput scale |
The most technically advanced alternative bypass, an Iraq-Syria pipeline corridor, requires an estimated $15 billion in capital investment and approximately four years to reach operational status. No infrastructure project of that scale can address a crisis unfolding in real time.
From Disruption to Structural Dislocation: Reading the Supply Data
The numbers underlying the extended Strait of Hormuz oil and LNG squeeze require careful disaggregation, because the aggregate figures mask just how severe the physical market deterioration has become.
Crude Oil: The Collapse in Transit Volumes
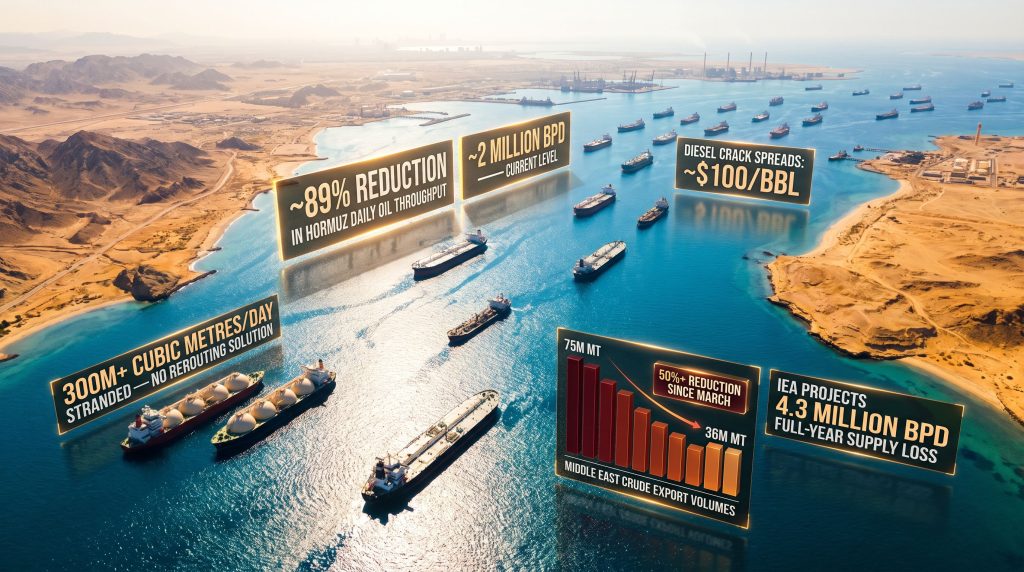
According to tanker tracking data cited by Reuters analyst Ron Bousso, Hormuz daily oil flows have averaged approximately 2 million barrels per day in August, down from a July average of 4.8 million barrels per day and a pre-war baseline of roughly 18 million barrels per day. In proportional terms, current throughput sits at approximately 11% of pre-war levels.
| Metric | Pre-Crisis Level | Current Level | Decline |
|---|---|---|---|
| Hormuz daily oil throughput | ~18 million bpd | ~2 million bpd | ~89% reduction |
| Middle East total oil exports | ~21 million bpd (2025 avg) | ~9.5 million bpd (Aug avg) | ~55% reduction |
| Iran crude export volumes | ~1.7 million bpd (2025) | ~294,000 bpd (Aug) | ~83% reduction |
| IEA projected full-year supply loss | 3.7 million bpd (prior) | 4.3 million bpd (revised) | Downward revision |
Iran's contribution to this collapse is significant. Export volumes have declined from approximately 1.7 million barrels per day in 2025 to around 294,000 barrels per day since the beginning of August, an 83% contraction. Monthly Middle East crude export volumes have fallen from approximately 75 million metric tons before the conflict began to roughly 36 million metric tons since March, a reduction exceeding 50%. These oil price movements reflect deepening structural dislocation rather than a passing correction.
LNG: A Structurally Harder Problem
The IEA estimates that a sustained Hormuz closure eliminates more than 300 million cubic metres per day of global LNG supply. There is no modern parallel for a shock of this magnitude in gas markets. According to the IEA's analysis of Middle East energy markets, the region's supply disruption has triggered one of the most severe gas market shocks in recent history. Crude oil can sometimes be redirected through alternative infrastructure or sourced from swing producers with spare capacity. LNG, however, cannot.
Liquefaction plants are fixed assets. Export terminals are geographically anchored. Vessel specifications and offtake agreements create additional layers of structural rigidity. Asian spot LNG prices have consequently reached their highest levels in more than three years. South Asian importers are bearing the most acute cost burden:
- Pakistan's power generation costs have surged 38% on the back of record spot LNG purchases, illustrating the fiscal vulnerability of import-dependent economies with limited foreign exchange reserves.
- India's LPG import costs have risen sharply, prompting a policy reorientation toward expanded piped natural gas infrastructure as a partial substitute.
- Japanese and South Korean refiners are actively restructuring procurement logistics, seeking alternative crude loading points from Saudi Arabia outside the Gulf.
Why Brent Crude Is Telling the Wrong Story
Brent crude trading near $91 per barrel has functioned as a misleading signal for much of this crisis. Senior commodity strategists, including Goldman Sachs' Jeff Currie, have drawn a pointed distinction between futures benchmark pricing and the physical product markets that determine actual economic costs. Currie noted publicly that no economy on earth consumes crude oil in its raw form, emphasising that end-user energy costs are determined by refined product availability, not headline benchmark levels.
The real pressure indicator is the diesel crack spread, which has surged toward $100 per barrel. A crack spread measures the margin between crude oil input costs and the value of refined products extracted from that crude. When crack spreads widen dramatically, it signals that refined product markets are far tighter than crude benchmarks suggest. At current levels, the diesel crack spread indicates severe downstream fuel scarcity that is structurally independent of whatever Brent happens to be trading at in any given session.
The transmission mechanism from elevated crack spreads to broad economic pain is direct and well-established: higher wholesale diesel prices flow through to freight costs, agricultural logistics, industrial production, and ultimately to consumer prices across virtually every goods category. Energy costs are not one input among many. They are the foundational input upon which all other costs rest.
A diesel shortage that began developing in the spring months has intensified as summer transitions to autumn. The seasonal demand acceleration associated with heating oil requirements, agricultural harvest logistics, and increased industrial activity is now colliding with a structurally diminished refined product supply base. Both the Middle East and Russia, historically significant refined fuel exporters, have seen export volumes curtailed by conflict and sanctions, compressing the global product pool from multiple directions simultaneously.
How Gulf Producers Are Navigating the Crisis
Saudi Arabia's Operational Pivot
Saudi Aramco has redirected significant export volumes through non-Hormuz loading infrastructure and has resumed Very Large Crude Carrier (VLCC) operations through the strait after a three-week suspension. The resumption of VLCC transits through Hormuz following that pause is a notable signal: it suggests a calculated decision to accept vessel risk in exchange for maintaining export revenue, rather than ceding the transit route entirely. VLCC day rates on the Gulf-to-China route have reached $510,000 per day, a freight market figure that itself functions as a barometer of supply chain stress and the cost premium now embedded in any oil that successfully transits the strait.
The UAE's Contradictory Position
ADNOC's export volumes reportedly ran above 2025 annual averages in August, a counterintuitive expansion during a period of acute transit risk. However, the UAE's geopolitical exposure has simultaneously intensified. Iranian ballistic missile strikes near UAE coastal waters have prompted Abu Dhabi to freeze bilateral trade with Tehran, while ADNOC tankers have faced repeated targeting incidents. These geopolitical oil risks are increasingly shaping producer behaviour in ways that go beyond conventional market logic.
The consequence for crude markets is directly observable: Murban crude prices have surged to four-month highs as ADNOC curtails Asian supply allocations in response to vessel security constraints. The UAE's position illustrates a broader tension running through Gulf energy markets: producers want to export, buyers want to receive product, but the physical security environment is increasingly preventing both.
Houthi activity has added a parallel threat vector. Three attacks on Saudi Aramco refinery infrastructure within a two-week period have demonstrated that the risk to Gulf energy production capacity is not confined to Hormuz transit alone. Saudi refining capacity, the industrial infrastructure that transforms crude oil into usable fuels, is itself under direct kinetic threat. The World Economic Forum's assessment of beyond-oil impacts illustrates just how far-reaching these supply chain consequences extend.
Asian Importers: A Region Under Acute Energy Stress
China's Strategic Calculus
China's response to the extended Strait of Hormuz oil and LNG squeeze has been characterised by a deliberate prioritisation of energy security over short-term economic efficiency. The country added approximately 200,000 barrels per day to strategic crude reserves in July, even as Hormuz transit risks mounted. Chinese oil imports jumped 22% year-on-year despite disappointing broader economic data, a clear signal that state energy security directives are overriding market-based demand signals.
Simultaneously, Chinese tanker operators have begun turning vessels back from Hormuz transit routes as war risk insurance costs and attack probabilities escalate. China has, however, responded by boosting refined product exports as domestic stockpiles accumulate, partially compensating for global product shortfalls while generating export revenue from the crisis premium embedded in product prices.
The Divergent Responses Across Asia
| Country | Primary Response | Secondary Strategy |
|---|---|---|
| China | Strategic reserve accumulation | Increased refined fuel exports |
| India | Venezuelan crude licensing | Piped gas infrastructure expansion |
| Japan | Alternative loading point procurement | Import bill management |
| Pakistan | Spot LNG purchasing | Energy cost absorption |
| South Korea | Crude source diversification | Refinery margin optimisation |
India's response has been particularly creative within the constraints available. Indian Oil secured a U.S. licence to return to Venezuelan crude procurement, a direct supply diversification response to Gulf disruption. India's Chief Economic Adviser has publicly advocated for E10 petrol blending mandates as a partial demand-side buffer against escalating import costs, embedding a renewable fuels policy rationale within an acute energy security crisis.
The next major ASX story will hit our subscribers first
The IEA's Revised Deficit Projections and Their Economic Consequences
The International Energy Agency's latest Oil Market Report projects a 4.3 million barrels per day full-year global supply reduction, a downward revision from an earlier estimate of 3.7 million barrels per day. The implied supply deficit calculates to approximately 1.27 million barrels per day, a structural shortfall that strategic petroleum reserve releases from IEA member nations have cushioned but not resolved. Consequently, the current crude oil prices visible in markets do not fully reflect the downstream product scarcity driving real economic costs.
The downstream consequence of 4.3 million fewer physical barrels entering the global refinery system each day is proportional reductions in gasoline, diesel, jet fuel, and petrochemical feedstock output. This creates what can be described as a downstream inflationary cascade:
- Reduced crude input volumes constrain refinery throughput.
- Reduced throughput compresses refined product availability.
- Compressed product availability widens crack spreads and raises wholesale fuel prices.
- Elevated wholesale fuel prices transmit through transport, agriculture, and manufacturing.
- Consumer goods prices rise across all sectors with significant energy or logistics cost components.
The stagflationary risk embedded in this dynamic is particularly challenging for central banks. Energy-driven inflation is supply-side in origin, making it structurally resistant to demand-suppressing interest rate increases. Raising rates reduces purchasing power without addressing the physical supply shortfall that is driving prices higher.
If the current disruption extends across a full 12-month period, diesel markets could face cumulative refined product shortfalls equivalent to hundreds of millions of barrels. Crack spreads sustained at elevated levels through winter demand peaks could push diesel retail prices to multi-decade highs across import-dependent economies, with manufacturing-heavy Asian economies and the European industrial base bearing disproportionate GDP headwinds.
This represents a forward-looking scenario, not a confirmed outcome. Readers should note that energy market forecasts carry significant uncertainty, particularly in conflict environments where geopolitical variables can shift rapidly and unpredictably.
Market Psychology and the Structural Repricing of Risk
Six Months of Misplaced Optimism
For approximately the first half of this crisis, futures market positioning reflected a dominant assumption: that diplomatic resolution was imminent, and that physical supply disruptions would prove temporary and manageable. Every political statement suggesting ceasefire negotiations or military progress was treated as a catalyst for price normalisation, drawing speculative positioning toward the view that energy markets would revert to pre-crisis baselines within weeks.
The physical market told a consistently different story throughout this period. Tanker tracking data, export volume statistics, crack spread dynamics, and freight rate movements all diverged sharply from the diplomatic optimism priced into futures contracts. That divergence has now closed, not because the physical market improved, but because futures positioning has belatedly caught up with the reality that tanker data has been signalling for months. In addition, trade war oil pressures have compounded the uncertainty already embedded in the market.
What the Forward Curve Is Now Signalling
The repricing visible across energy markets reflects several simultaneous developments:
- Backwardation deepening in crude futures curves, with near-term contracts commanding significant premiums over forward months.
- Diesel and heating oil futures reflecting sustained product scarcity expectations through the winter demand peak.
- VLCC freight rates at $510,000 per day on Gulf-to-China routes, a freight market signal encoding extreme supply chain stress.
- War risk insurance premiums for Hormuz transit vessels at historically elevated levels, adding a structural cost layer to every barrel that does successfully transit the strait.
The geopolitical deadlock reinforces the binary risk structure. Both the U.S. and Iran are absorbing meaningful economic costs from the prolonged conflict. Neither has signalled willingness to initiate formal negotiations. Iran has threatened offensive action against U.S. naval presence, while Washington maintains its blockade posture. The market is effectively pricing a binary outcome: sudden diplomatic breakthrough, which would be deflationary, or continued escalation, which carries significantly larger price implications. The asymmetry of these outcomes, with the downside scenario carrying far greater magnitude than the upside, justifies the structural risk premium now embedded across energy markets.
Key Indicators to Monitor as the Crisis Evolves
| Indicator | What It Signals |
|---|---|
| Hormuz daily tanker transit count | Real-time supply flow recovery or deterioration |
| Qatar LNG force majeure status | Gas market normalisation timeline |
| Diesel crack spreads | Downstream inflation pressure trajectory |
| VLCC freight rates (Gulf-to-Asia) | Supply chain stress and insurance cost trends |
| IEA strategic reserve release volumes | Policy buffer capacity remaining |
| U.S.-Iran diplomatic signals | Binary resolution risk assessment |
| Murban crude price | ADNOC supply allocation and UAE export capacity |
Frequently Asked Questions
How much oil normally flows through the Strait of Hormuz?
Under normal conditions, approximately 20 million barrels per day of crude oil and petroleum products transit the Strait of Hormuz, representing about 25% of global seaborne oil trade. Current crisis conditions have reduced this to approximately 11% of historical throughput levels.
Why is LNG more vulnerable to a Hormuz closure than crude oil?
LNG cannot be easily rerouted because liquefaction plants, export terminals, and receiving infrastructure are geographically fixed. Qatar and the UAE cannot redirect production through alternative routes at scale. The IEA estimates a sustained closure eliminates more than 300 million cubic metres per day of global LNG supply, with no short-term rerouting solution available.
What is a crack spread and why does it matter?
A crack spread is the price differential between crude oil and refined petroleum products such as diesel or gasoline. When crack spreads widen, it signals that refined product markets are far tighter than crude benchmarks suggest. Diesel crack spreads approaching $100 per barrel indicate severe downstream fuel scarcity operating independently of whatever crude oil headline prices are showing.
Can alternative pipelines replace Hormuz throughput?
No viable alternative exists at the required scale within any near-term timeframe. The most advanced proposed bypass requires an estimated $15 billion and approximately four years to complete. Existing UAE and Saudi pipeline infrastructure provides only partial bypass capacity, far below Hormuz throughput scale.
Which countries are most exposed?
South and East Asian economies face the greatest exposure, particularly those with high LNG import dependence and limited strategic reserves. Pakistan's power generation costs have risen 38% on record spot LNG purchases. India, Japan, and South Korea are actively restructuring procurement logistics. European energy markets are also experiencing significant transmission effects through elevated gas and power prices, with UK energy bills projected to reach three-year highs.
This article is provided for informational purposes only and does not constitute financial or investment advice. Energy market conditions, geopolitical developments, and supply projections are subject to rapid and material change. Readers should conduct independent research and consult qualified advisers before making any investment or commercial decisions based on the information presented here.
Want to Stay Ahead of the Next Major Resource Discovery Driven by Shifting Energy Markets?
Discovery Alert's proprietary Discovery IQ model scans ASX announcements in real time, instantly identifying significant mineral discoveries across more than 30 commodities — including those tied to the energy transition — and delivering actionable alerts before the broader market reacts. Explore historic discoveries and their market-moving returns, then begin your 14-day free trial to position yourself ahead of the next major opportunity.