July 29, 2026
The Energy Architecture Flaw That No Engineer Can Fix
Every complex system has a single point of failure that engineers lose sleep over. In global energy infrastructure, that point is a 33-kilometre-wide strip of water between Iran and Oman. The Strait of Hormuz does not merely matter to oil markets; it is the oil market's most critical nerve, and when that nerve fires in distress, the pain is felt from Asian refinery gates to suburban petrol stations within weeks.
Understanding why the strait of hormuz oil price spike cycle keeps repeating, and why the current calm may be more fragile than futures markets are pricing, requires looking past the diplomatic headlines and into the structural mechanics of global supply. Furthermore, crude oil price trends heading into 2025 had already set a volatile baseline before the 2026 conflict emerged.
When big ASX news breaks, our subscribers know first
Why the Strait of Hormuz Remains the World's Most Dangerous Oil Chokepoint
The Geometry of Global Energy Vulnerability
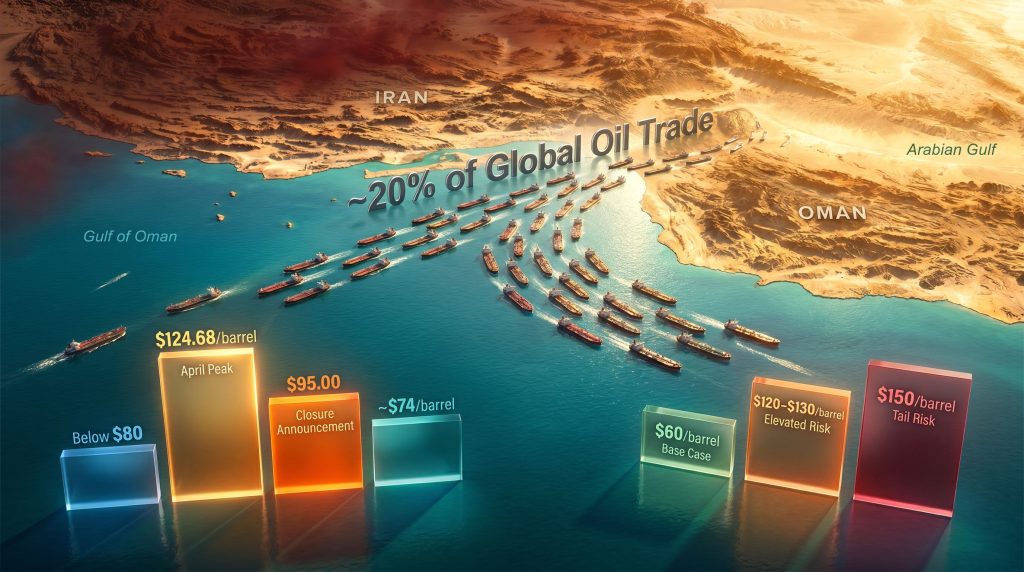
Roughly one-fifth of all globally traded oil moves through this single maritime corridor every day. That statistic alone would qualify Hormuz as a critical infrastructure node, but the truly alarming reality is what does not exist on the other side of the ledger: credible alternative capacity.
Saudi Arabia's East-West Pipeline, which connects Gulf fields to the Red Sea port of Yanbu, can handle a maximum of around 5 million barrels per day under full utilisation. Reports indicate Saudi Arabia is now examining a major expansion of this Red Sea pipeline specifically to reduce Hormuz dependency, though this remains a medium-to-long-term project.
The UAE's Habshan-Fujairah pipeline offers another partial bypass, but combined, these alternatives fall drastically short of replacing full Hormuz throughput. Geographic constraints, capital costs, and the years required to build meaningful bypass infrastructure mean the strait retains its stranglehold on global supply for the foreseeable future.
| Metric | Estimated Figure |
|---|---|
| Share of global oil trade transiting Hormuz | ~20% |
| Brent crude peak price during conflict (April 2026) | $124.68/barrel |
| Brent price at initial closure announcement | $95.00/barrel |
| WTI price at initial closure announcement | $92.30/barrel |
| Merchant ships transiting on June 20 (U.S. Central Command) | 55 vessels |
| Barrels carried on June 20 transit day | 17+ million barrels |
"A full Hormuz closure would remove more supply from global markets than any single OPEC+ production cut in recorded history, yet no infrastructure alternative exists that could replace even half of that capacity within a realistic timeframe."
What Triggered the Most Recent Strait of Hormuz Oil Price Spike?
The Sequence of Escalation
The conflict that began on February 28, 2026 escalated through a sequence of military and diplomatic events that compressed months of geopolitical tensions into days of market shock. U.S. airstrikes on Iranian territory, compounded by the downing of a U.S. Apache helicopter near the strait, provided the catalytic pressure that pushed Iran's senior joint military command to formally declare the waterway closed to all maritime traffic.
The Revolutionary Guards Navy then struck two vessels that attempted to breach the blockade, transforming a political declaration into an operational reality. Brent crude responded within hours, surging to $95.00 per barrel, with WTI moving in parallel to $92.30. At the April peak, as disruption fears reached maximum intensity, Brent touched $124.68 per barrel.
The Information Paradox Driving Price Volatility
One of the more subtle but consequential dynamics at play was the contradiction between Iran's official closure declaration and the physical data being reported by U.S. Central Command. On a single day in late June, 55 merchant ships transited the strait carrying over 17 million barrels of crude, reportedly a record daily volume for the passage.
This gap between official narrative and operational reality created what traders sometimes call an uncertainty premium: futures pricing does not just reflect current supply and demand but also the probability distribution of future scenarios. When the range of outcomes spans from full normalisation to complete blockade resumption, that uncertainty itself becomes a price input, even when physical flows are technically moving.
The Brent Price Timeline
| Date / Period | Brent Crude Price | Key Event |
|---|---|---|
| Pre-conflict baseline | Below $80/barrel | Pre-war market conditions |
| April 2026 (conflict peak) | $124.68/barrel | Maximum disruption fears |
| Mid-June 2026 | Declining | Framework MoU signed |
| Closure announcement | $95.00/barrel | Blockade formally declared |
| Early July 2026 | ~$74/barrel | Flows partially recovering |
How Do Analysts Model a Prolonged Hormuz Blockade?
Scenario Architecture: Three Price Paths for Brent Crude
Scenario 1: Rapid Normalisation (Base Case)
The optimistic pathway assumes the U.S.-Iran framework memorandum of understanding converts into a binding formal agreement before the end of August. Under this scenario, Hormuz traffic returns to full operational capacity within Q3 2026, OPEC+ production increases are absorbed by recovering demand, and major financial institutions' bearish projections hold.
- Goldman Sachs projects a potential 2027 supply glut even with inventory rebuild demand
- Citigroup has set a $60/barrel Brent target for year-end under full normalisation
- Key assumption: zero further military incidents; sanctions relief progresses on schedule
Scenario 2: Prolonged Partial Disruption (Elevated Risk Case)
Negotiations stall. Iran continues pressing for permanent transit arrangements. Shipowners remain cautious, voluntarily reducing traffic below pre-conflict levels even without an active blockade.
- JPMorgan's near-term target range reaches $120 to $130/barrel if disruptions persist through Q3
- Inventory depletion accelerates faster than stockpile rebuild timelines allow
- The strategic petroleum reserve buffer remains functionally exhausted
Scenario 3: Full Blockade Resumption (Tail Risk Case)
A diplomatic breakdown triggers renewed military engagement. Physical flows halt. Markets respond without the cushion of meaningful strategic reserves.
- JPMorgan's worst-case projection: Brent surging toward $150/barrel within one month of full closure
- Speculative positioning has already priced $200/barrel tail-risk scenarios in options markets
- Jet fuel is already elevated approximately 50% above pre-conflict levels, acting as an early warning indicator
- Retail gasoline could exceed $3/gallon in the United States within 2 to 4 weeks of another major spike
"The $200/barrel scenario is not a base case for any major institution. It represents the outer boundary of tail-risk modelling where demand destruction becomes the effective price ceiling, not supply restoration. The distinction matters enormously for investors positioning around energy assets."
Why Depleted Global Inventories Are the Hidden Accelerant
Strategic Reserve Drawdowns: The Buffer That No Longer Exists
The oil market navigated the initial shock of the 2026 Hormuz disruption partly because governments coordinated significant releases from strategic petroleum reserves. That tool has now been largely spent. U.S. SPR and commercial crude inventories sit at their lowest combined level since 1985, a structural reality that fundamentally changes the market's capacity to absorb a second shock.
Analysts at Energy Aspects have characterised the current inventory environment as leaving the market dangerously exposed to the next disruption. Ilia Bouchouev of the Oxford Institute for Energy Studies has noted that depleted inventory levels mean forward prices are structurally more prone to sharp upward movements, even absent a full closure event. The absence of a buffer does not prevent the market from functioning; it removes the time delay between a disruption event and a price impact.
The Inventory Depletion Risk Matrix
| Region | Inventory Status | Resilience to Second Shock |
|---|---|---|
| United States (SPR + commercial) | Lowest since 1985 | Very Low |
| Wider Asia (ex-China) | Heavily drawn down | Low; gradual rebuild underway |
| Europe | Partially depleted | Moderate |
| China | ~1.3 billion barrels stockpiled pre-conflict | High; not available to global market |
Why Forward Prices Are Now More Volatile Than Spot Prices
There is a well-established relationship in commodity markets between physical inventory levels and futures curve volatility. When buffers are thick, the market can absorb disruption signals without immediate price movement because buyers know replacement supply can be sourced from existing stocks. When inventories are depleted, the futures curve becomes hypersensitive to any information that might affect near-term supply availability.
The practical consequence is that the 2 to 4 week lag between crude price movements and retail fuel prices is now a genuine political risk factor. Government administrations that rely on low fuel costs as a measure of economic competence have a narrowing window to respond before consumers feel the impact at the pump. Indeed, the broader commodity price impacts extend well beyond energy into mining and resource sectors.
Is the U.S.-Iran Deal Real? Unpacking the Diplomatic Framework
What the Memorandum of Understanding Actually Says
The MoU signed in mid-June 2026 is precisely what its title describes: a framework for further negotiation, not a binding peace agreement. The formal target for converting this framework into an enforceable deal is the end of August 2026, a deadline that carries significant execution risk given the number of unresolved issues.
Critically, Iran's nuclear programme was not addressed in the MoU text. Tehran has also maintained its position that some form of permanent transit arrangement or service fee mechanism should govern passage through the strait, a claim that amounts to asserting sovereign control over what international maritime law treats as an international waterway. Washington has not accepted this framing, creating a fundamental fault line that no amount of diplomatic language has yet bridged.
Three Unresolved Negotiating Fault Lines
| Issue | Iran's Position | U.S. Position | Resolution Probability |
|---|---|---|---|
| Nuclear programme | Not on the table | Must be addressed | Low (near-term) |
| Hormuz transit fees | Permanent control mechanism | Unacceptable sovereignty claim | Very Low |
| Sanctions relief | Full removal required | Conditional and phased | Moderate |
The U.S. domestic political calendar adds a further layer of complexity. Suppressing crude prices ahead of midterm elections is a genuine strategic incentive for the current administration, but the concessions required to achieve a lasting agreement with Tehran may conflict with domestic political constraints, particularly on the nuclear question.
The next major ASX story will hit our subscribers first
What Role Is China Playing in Global Oil Price Dynamics?
China's Strategic Stockpiling: The Wildcard Variable
Before the conflict began on February 28, China had accumulated an estimated 1.3 billion barrels of crude across commercial and strategic reserves. This was not coincidental. Chinese energy policy has long emphasised stockpile accumulation during periods of price weakness, and the pre-war environment provided ample opportunity to build that buffer.
When prices spiked in the early days of the conflict, Beijing made the rational decision to halt spot crude purchases entirely, drawing on domestic stockpiles instead. The result was a dramatic reduction in Chinese seaborne crude arrivals, which fell to just over 6 million barrels per day in June 2026, according to Vortexa data. That figure represents the lowest recorded level since at least 2016 and marked the fourth consecutive monthly decline in Chinese crude imports.
When China Returns to the Market
Pamela Munger, Head of Market Analysis EMEA at Vortexa, has indicated that Chinese import volumes will eventually rebound, though structural factors may prevent a full return to pre-war levels. The broader Asia-wide inventory rebuild is expected to be a measured, multi-quarter process rather than a rapid surge in purchasing activity.
The implication for global price dynamics is significant. China's re-entry into spot crude markets is not a question of whether it will happen but when. Even a partial recovery toward 8 to 9 million barrels per day of Chinese seaborne imports would absorb a substantial portion of the supply surplus that bearish analysts are projecting for 2027.
"China's stockpile strategy is a lesser-understood dynamic in the current market structure. Beijing's ability to remain entirely absent from spot markets for months, drawing purely on domestic reserves, effectively weaponises its inventory position as a geopolitical tool. The return of Chinese buying could neutralise the bearish oversupply thesis before most traders have repositioned."
How Does a Strait of Hormuz Closure Affect Oil Prices Historically?
Comparative Disruption Analysis
| Disruption Event | Peak Price Impact | Duration of Elevated Prices | Buffer Available |
|---|---|---|---|
| 1973 Arab Oil Embargo | +400% over 12 months | 12+ months | Moderate |
| 1979 Iranian Revolution | +100% over 18 months | 18+ months | Low |
| 1990 Gulf War | +100% in 3 months | ~6 months | Moderate |
| 2019 Abqaiq Attack | +15% (short-lived) | Days | High |
| 2026 Hormuz Conflict | +55% (April peak) | Ongoing | Very Low |
The 2019 Abqaiq attack, which temporarily knocked out approximately 5% of global oil supply in a single strike on Saudi Arabian infrastructure, produced only a brief and modest price impact precisely because inventories were robust and strategic reserves were intact. The 2026 event produced a far larger and more sustained impact despite comparable or smaller initial supply volumes being affected, because the buffer that historically absorbs disruption signals had already been depleted.
What Happens to Gasoline Prices When Hormuz Is Disrupted?
Step-by-Step: How a Hormuz Spike Reaches Your Fuel Tank
Understanding the transmission mechanism is essential for both consumers and investors tracking the consumer impact timeline.
- Day 0 to 3: Crude futures spike on disruption news or military escalation reports; options markets begin pricing tail-risk scenarios
- Day 3 to 7: Physical crude cargo prices adjust as spot market premiums emerge on key trade routes
- Day 7 to 14: Refineries begin passing higher feedstock costs into wholesale fuel pricing schedules
- Day 14 to 28: Retail gasoline and diesel prices adjust at the pump across consumer markets
- Day 28 and beyond: Airline fuel surcharges, freight cost increases, and broader second-round inflation effects materialise across the wider economy
Jet fuel has already demonstrated this dynamic, running approximately 50% above pre-conflict baseline levels. The retail gasoline threshold of $3 per gallon in the United States represents a politically sensitive boundary because it has historically correlated with shifts in consumer sentiment indexes and, by extension, approval ratings. JPMorgan analysts warn that this threshold could be breached rapidly if a second major disruption materialises.
Could Oil Prices Actually Fall to $60, or Is the Bear Case Overstated?
The Bearish Thesis: What Needs to Go Right
Citigroup's $60/barrel Brent projection for year-end requires a specific and narrow set of conditions to materialise simultaneously:
- Full Hormuz traffic normalisation completed by end of Q3 2026
- U.S.-Iran deal formalised before the August deadline
- OPEC+ production increases successfully absorbed by demand recovery
- Chinese seaborne import volumes remaining structurally suppressed
Goldman Sachs has separately flagged the potential for a significant supply glut in 2027, even accounting for inventory rebuild demand, but also acknowledged that the pace of that glut depends heavily on diplomatic resolution timelines. In addition, the trade war impact on oil markets adds another layer of uncertainty that could undermine the bearish timeline.
The Bull Case: Why the Next Spike Could Arrive Before Traders Expect
The market's current positioning is overwhelmingly bearish. Most speculative traders have turned net-short over the past month, pricing in the normalisation scenario. This positioning itself creates asymmetric risk: if any single element of the bear case fails, the short-covering response could amplify an upward price move significantly beyond what the underlying supply change would justify.
The bull case does not require multiple things to go wrong simultaneously. It requires only one:
- A negotiation breakdown reintroduces a $20 to $30/barrel geopolitical risk premium instantly
- China re-enters spot markets at scale, absorbing projected surplus volumes
- A military incident in or near the strait triggers physical traffic disruption
- U.S. inventory data reveals faster-than-expected drawdowns, exposing the absence of strategic reserve capacity
"The market's bearish consensus assumes a diplomatic outcome that has not yet been achieved. The MoU is a framework, not a resolution. Every week that passes without a binding agreement is a week where the full tail risk of another strait of hormuz oil price spike remains embedded in the physical market, even as futures prices drift lower."
The Strategic Outlook: Mapping the Risk Horizon
Near-Term Catalysts to Monitor (Q3 2026)
- Progress or formal breakdown of U.S.-Iran agreement negotiations before the August deadline
- Weekly Hormuz tanker traffic volume data as a real-time disruption signal
- U.S. SPR and commercial crude inventory reports from the EIA
- Chinese seaborne crude arrival data and any resumption of spot buying activity
Medium-Term Structural Risks (Q4 2026 to Q1 2027)
- Whether global inventory rebuild demand offsets projected OPEC+ production increases
- Iran's nuclear programme trajectory and its intersection with Hormuz access negotiations
- Saudi Arabia's Red Sea pipeline expansion capacity and timeline
- The pace and scale of Asia-wide strategic stockpile restoration
The Asymmetric Risk Profile
The bear case is narrow and requires disciplined diplomatic execution. The bull case has multiple independent triggers, each capable of driving a significant strait of hormuz oil price spike without requiring coordination or simultaneity. Furthermore, OPEC market influence over production decisions will play a pivotal role in determining which scenario ultimately prevails.
With global inventory buffers at multi-decade lows, the price response to a second major disruption would likely be faster and steeper than the response to the first, precisely because the mitigating tools that softened the initial shock are no longer available.
Disclaimer: This article is for informational and educational purposes only and does not constitute financial, investment, or trading advice. Oil price forecasts referenced herein represent the published views of third-party institutions and analysts and are subject to change. Readers should conduct their own research and consult qualified financial advisers before making any investment decisions.
Want to Capitalise on the Next Major Commodity Discovery Before the Market Catches On?
While geopolitical shocks like the Strait of Hormuz crisis dominate energy markets, significant mineral discoveries on the ASX can deliver equally dramatic returns — and Discovery Alert's proprietary Discovery IQ model ensures subscribers receive real-time alerts the moment those discoveries are announced, turning complex data into actionable opportunities. Explore why major discoveries have historically generated substantial returns and begin your 14-day free trial today to position yourself ahead of the broader market.