June 10, 2026
When the Paper Market Meets Physical Reality: A Reckoning for Global Oil
Energy markets have a well-documented tendency to price optimism rather than reality. Futures traders, operating through screens and models, often interpret diplomatic signals and sentiment-driven narratives far more readily than they process the slow-moving, stubborn physics of supply depletion. This behavioural pattern has played out across every major commodity disruption in modern history, from the 1973 Arab oil embargo to the post-COVID inventory squeeze of 2021. What makes the current situation fundamentally different is the sheer scale of the structural imbalance now building beneath the surface of a surprisingly calm futures market.
The Strait of Hormuz oil price spike risk is not a theoretical scenario being modelled in university economics departments. It is an active, accelerating crisis that is draining the world's emergency fuel supply at a rate that has no modern precedent. And yet, for reasons rooted in trader psychology and the enduring hope of a diplomatic resolution, the paper market continues to lag dangerously behind the physical reality unfolding inside storage tanks from Houston to Zhoushan. Our crude oil volatility guide explores the broader patterns that make moments like this so structurally dangerous.
When big ASX news breaks, our subscribers know first
The Strait of Hormuz: An Irreplaceable Artery in Global Energy Supply
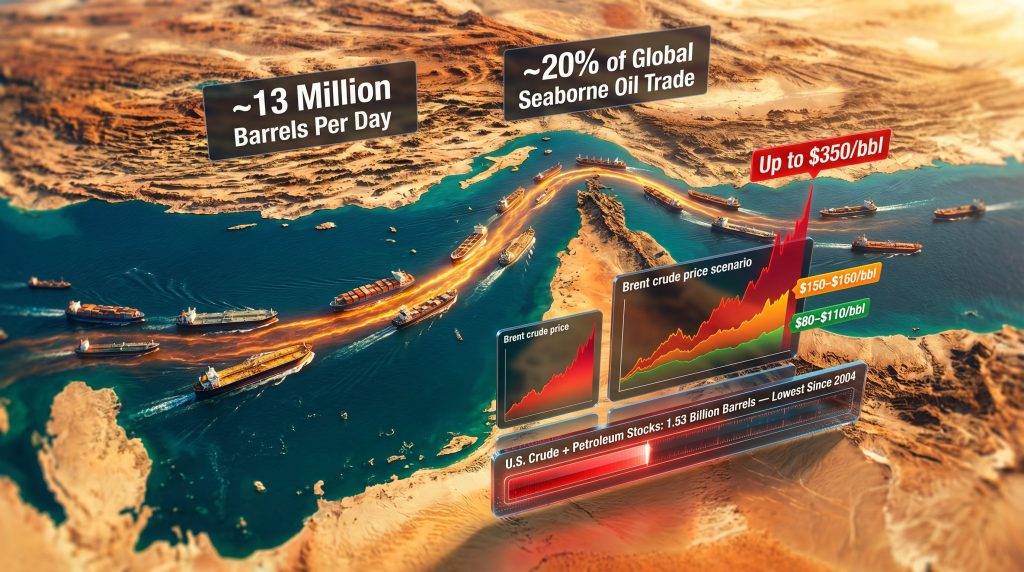
The world has no practical substitute for the Strait of Hormuz. This narrow corridor connecting the Persian Gulf to the Gulf of Oman represents the single most concentrated point of energy vulnerability on earth. At its navigable width of approximately 3.2 kilometres in each direction, the strait funnels roughly 20% of all globally traded seaborne oil, a volume representing an estimated 13 million barrels per day (bpd) of crude and condensates under normal operating conditions.
Beyond crude oil, the strait also carries a substantial share of liquefied natural gas exports from Qatar and the United Arab Emirates, making it a dual chokepoint for both liquid fuels and gas-dependent economies. The LNG supply outlook for 2025 and beyond underscores just how critical these export corridors have become. The key nations whose exports depend on Hormuz access include Saudi Arabia, Iraq, Iran, Kuwait, the UAE, and Bahrain, collectively representing a significant portion of OPEC+ production capacity.
Why No Alternative Route Can Fill the Gap
The most commonly cited bypass options, including the Saudi Arabian East-West Pipeline and the UAE's Habshan-Fujairah pipeline, carry meaningful capacity but fall dramatically short of replacing full Hormuz throughput. The East-West pipeline, for instance, has a capacity of roughly 5 million bpd, less than half the typical Hormuz daily flow, and it was not designed to scale rapidly under emergency conditions. There is simply no infrastructure equivalent that can absorb the loss of 13 million bpd across a sustained disruption period.
The Inventory Buffer Problem: A System Running on Fumes
The standard assumption during any supply disruption is that strategic petroleum reserves and commercial inventories will provide the necessary cushion while markets adjust. That assumption is being stress-tested in ways that energy security planners have rarely had to confront simultaneously.
The International Energy Agency's May 2026 report confirmed that global oil supply fell by a further 1.8 million bpd in April alone, bringing total supply losses since February 2026 to approximately 12.8 million bpd. Over the March to April period, observed global inventories, including oil currently in transit on the water, were drawn down at a rate of 4 million bpd, representing a total depletion of roughly 250 million barrels across just two months.
| Buffer Mechanism | Capacity or Status | Estimated Duration |
|---|---|---|
| U.S. Strategic Petroleum Reserve (SPR) | Significantly drawn down; SPR borrowers owe approximately 40 million barrels | Weeks to months |
| Chinese commercial and strategic reserves | Estimated 1.2 billion barrels pre-conflict | Actively drawn since May 2026 |
| Global observed inventories (including oil on water) | Drawn down approximately 250 million barrels across March to April 2026 | Approaching critical threshold |
| U.S. crude and petroleum product stocks | 1.53 billion barrels as of May 29, 2026, lowest since 2004 | Near tipping point |
The United States provides the most measurable data point in this deteriorating picture. Combined U.S. crude and petroleum product inventories reached 1.53 billion barrels for the week ending May 29, 2026, according to the U.S. Energy Information Administration, marking the lowest weekly ending stock level recorded since 2004. Cushing, Oklahoma, the designated delivery hub for WTI futures contracts, is also experiencing significant drawdown pressure, which adds a mechanical dimension to the price spike risk that futures traders cannot indefinitely ignore.
China's Strategic Reserve: The Last Large Cushion Is Shrinking
China entered this disruption in an unusually strong inventory position. Before the conflict escalated, Beijing had accumulated an estimated 1.2 billion barrels across commercial and strategic reserve facilities, a stockpile that has served as a critical buffer suppressing spot crude demand from the world's largest oil importer. However, data from tanker tracking and import analysis indicates that Chinese drawdowns began in earnest in May 2026, with imports simultaneously plummeting to an eight-year low as domestic stock releases substituted for seaborne supply.
China has also moved to delay approximately 500,000 bpd of new refining capacity as the disruption deepens, a signal that Beijing is managing demand-side exposure rather than attempting to absorb higher-priced barrels at scale. This is a rational but finite strategy. Once Chinese reserves reach levels where drawdown rates become unsustainable, the country will be forced back into the spot market at precisely the moment when global supply availability is most constrained.
The Three-Scenario Framework for Brent Crude
The range of potential price outcomes for Brent crude is exceptionally wide, reflecting genuine uncertainty about how long the disruption will persist and whether diplomatic progress can deliver even a partial resumption of traffic through the strait.
Strait of Hormuz Oil Price Spike: Scenario Projections for Brent Crude
Scenario Duration of Disruption Projected Brent Range Key Driver Limited or short-term disruption Days to weeks Approximately $80 to $110 per barrel, normalising by end-2026 Swift diplomatic resolution Extended partial blockade 1 to 3 months Approximately $150 to $200 per barrel Inventory depletion combined with demand shock Full month-long or longer blockade 30 days or more Up to $350 per barrel before demand destruction correction Supply collapse combined with panic premium
The $150 to $160 per barrel range is not the work of fringe analysts. Neil Chapman, Exxon's Senior Vice President, speaking at the Bernstein 42nd Annual Strategic Decisions Conference in late May 2026, outlined the situation in stark terms. Drawing on supply-demand modelling, Chapman indicated that inventory levels were approaching historically unprecedented lows and that most analytical frameworks pointed to dated Brent surging to the $150 to $160 per barrel range once those critical thresholds were breached. His framing of the inventory situation as approaching levels that are genuinely without modern precedent captured the severity of the depletion trajectory underway.
Chevron's CEO Mike Wirth, speaking at the same event, reinforced this assessment from a different angle. Wirth described how the market's capacity to absorb the ongoing imbalance had deteriorated sharply since the disruption began, with the buffers and shock absorbers that had previously moderated price impacts now substantially depleted. His view was that upward price pressure would become increasingly difficult to suppress through June and into July 2026 as physical market realities overtook sentiment-based futures positioning. Furthermore, reporting on the Strait of Hormuz shipping crisis from The Guardian has documented how rapidly the situation has deteriorated since hostilities escalated in early 2026.
Why Futures Markets Are Disconnected from Physical Fundamentals
The divergence between futures pricing and physical market conditions is one of the more instructive market psychology phenomena observable in real time. For more than three months, futures traders have maintained an implicit expectation that the disruption would resolve before inventories reached critical thresholds. This optimism has been repeatedly reinforced by diplomatic signals, ceasefire rumours, and statements from political figures suggesting an imminent deal was close.
Several mechanisms explain why this disconnect persists:
- Sentiment anchoring: Traders who positioned early on a resolution thesis face psychological barriers to abandoning that view as losses accumulate.
- Optionality pricing: Futures contracts embed optionality around resolution scenarios, which can suppress the price signal even as physical fundamentals deteriorate.
- Dark tanker opacity: A meaningful volume of crude continues to move through informal channels involving vessels that do not broadcast their positions or cargo details. This masks the true extent of supply losses in aggregate data, giving traders statistical cover to maintain bullish resolution bets.
- Demand destruction as a false ceiling: The genuine demand destruction occurring globally has moderated price pressure, but it is a temporary and self-limiting mechanism. As inventories fall toward rock bottom, demand destruction alone will be insufficient to prevent a disorderly repricing.
Dark Tanker Traffic and the Opacity Problem
One of the less-discussed dimensions of this disruption is the surge in dark tanker activity around the Hormuz corridor. Vessels operating without transponders or with manipulated identification signals have been transporting crude in a manner that prevents accurate tracking by conventional market intelligence tools. This opacity is actively masking the true magnitude of supply losses, allowing the futures market to operate with incomplete information. When accurate supply accounting eventually becomes clearer, whether through IEA data revisions or satellite-based vessel tracking improvements, the market may be forced to reprice sharply to reflect a supply situation worse than current models suggest. The trade war oil impact on dark fleet dynamics has, moreover, added further complexity to how these opaque flows are being managed.
Regional Exposure: Who Bears the Greatest Economic Risk
The geographic concentration of Hormuz dependency creates sharply uneven vulnerability across importing nations. Asia-Pacific economies bear disproportionate exposure because the region collectively accounts for the majority of Persian Gulf crude offtake.
India: Dual Vulnerability in an Already Stressed Economy
India's exposure is particularly acute. The country's fuel demand has already fallen 6.5% as higher prices bite into consumption, while LPG consumption has dropped by 20%, compressing household energy access across lower-income segments. To compensate for lost Persian Gulf supply, Indian companies have moved aggressively to diversify sourcing, with Venezuelan crude imports surging 51% in a single month. Simultaneously, India has launched an 85% ethanol fuel blend programme as a structural demand-reduction measure intended to reduce crude import dependency over the medium term. The Bank of England has publicly noted that the oil shock is complicating monetary policy outlooks globally, a signal of how the disruption's economic tentacles extend well beyond direct energy importers.
European Downstream Exposure
Eurozone fuel sales have contracted by 3.5% as supply disruptions drive retail prices higher across member states. European authorities have indicated that no immediate jet fuel shortage is anticipated despite regional supply losses, but the confidence behind that assessment depends heavily on continued access to Atlantic Basin and North Sea supply chains. These supply chains are themselves under incremental pressure from reduced Norwegian production variability and UK North Sea policy uncertainty.
The next major ASX story will hit our subscribers first
Compounding Supply Shocks: The Hormuz Disruption Is Not Operating in Isolation
What distinguishes the current Strait of Hormuz oil price spike scenario from previous disruptions is not just the scale of the primary supply loss but the simultaneous layering of secondary shocks that further constrain the market's ability to self-correct. In addition, the OPEC market influence in shaping production decisions has done little to stabilise sentiment against this backdrop.
Five structural factors make this disruption historically unprecedented:
- Scale of supply loss: Approximately 13 million bpd removed from global circulation, a volume with no historical parallel in peacetime energy markets.
- Duration: More than three consecutive months of near-total chokepoint closure, extending well beyond the time horizon that typical inventory buffers were designed to cover.
- Inventory depletion rate: A sustained draw rate of 4 million bpd across observed global stocks, compressing the runway to critical thresholds.
- Strategic reserve exhaustion: Multiple governments, including the United States, are simultaneously drawing on finite emergency buffers, with U.S. SPR borrowers now owing approximately 40 million barrels that will eventually need to be returned.
- Compounding supply shocks: Russia has reduced oil exports due to a combination of domestic fuel shortages and ongoing infrastructure damage from drone attacks. Australian LNG operations are facing escalating strike action. Malaysia's oil production fell 5.5% in the first quarter of 2026. Each of these individually would be manageable; occurring simultaneously against the backdrop of Hormuz closure, they collectively shrink the market's margin for error to near zero.
The Reopening Paradox: Why Resolution Is Not Instant Relief
A persistent misconception in market commentary is that a Hormuz reopening would rapidly normalise prices. The transit lag problem makes this assumption structurally flawed. Even if the strait reopened unconditionally today, the physical journey time for Persian Gulf crude to reach refineries in Asia, Europe, and the Americas ranges from two to six weeks depending on destination. Refineries that have drawn down feedstock inventories to minimum operational levels would face continued processing constraints during this transit period, sustaining physical market tightness well beyond any political resolution date.
Iranian officials have floated a partial reopening scenario involving a toll regime under which vessels would pay fees to transit the strait under Iranian operational oversight. The market implications of such an arrangement are complex. A toll regime would technically reopen the physical pathway but would introduce a new cost structure that refiners would need to absorb, and it would create ongoing political friction with the United States and Israel that could destabilise the arrangement at short notice.
OPEC+ approved an additional output hike for July 2026, but the arithmetic of that decision needs to be understood in context. With approximately 13 million bpd effectively removed from global supply, even a substantial OPEC+ production increase of several hundred thousand barrels per day represents a fraction of the volume required to rebalance the market. Incremental hikes cannot compensate for a Hormuz-scale disruption. The broader oil geopolitics analysis for 2025 and 2026 makes clear that geopolitical risk premiums of this magnitude have historically not been resolved by production pledges alone.
Frequently Asked Questions: Strait of Hormuz Oil Price Spike
What is the Strait of Hormuz and why does it matter for oil prices?
The Strait of Hormuz is a narrow waterway between Iran and Oman connecting the Persian Gulf to the Gulf of Oman and the broader Arabian Sea. It is the world's most critical oil chokepoint, through which approximately 20% of all globally traded seaborne crude and a significant share of LNG exports transit under normal conditions. Any disruption to traffic through the strait directly reduces global oil supply available to importers in Asia, Europe, and beyond, exerting upward pressure on crude prices worldwide.
How much oil transits the Strait of Hormuz each day?
Under normal operating conditions, approximately 13 million barrels per day of crude oil and condensates move through the strait, alongside significant LNG volumes from Qatar and the UAE.
What would happen to oil prices if the Strait of Hormuz was blocked for a month?
Price modelling by industry executives suggests Brent crude could spike toward $350 per barrel in a full month-long blockade scenario before demand destruction began to act as a corrective mechanism. A more sustained partial blockade lasting one to three months is modelled at $150 to $200 per barrel by major oil company analysts. For further context, Yahoo Finance has reported on U.S. oil prices notching their biggest weekly surge since at least 1985 as the crisis has deepened.
How low are global oil inventories right now?
As of late May 2026, U.S. crude and petroleum product inventories had fallen to 1.53 billion barrels, the lowest level recorded in weekly ending stock data since 2004. Global observed inventories declined by approximately 250 million barrels across March and April 2026 alone, at a draw rate of 4 million bpd.
What is demand destruction and how does it limit oil price spikes?
Demand destruction refers to the economically driven reduction in consumption that occurs when prices rise to levels that make certain uses unaffordable or economically irrational. High fuel prices cause consumers and businesses to reduce discretionary travel, switch to alternative energy sources, and cut energy-intensive production. This demand reduction reduces the volume of oil needed, which partially offsets the price pressure created by supply shortfalls. However, demand destruction is a reactive and limited mechanism. Once inventories reach critically low levels, even significant demand reduction may be insufficient to prevent disorderly price spikes.
Could the U.S. Strategic Petroleum Reserve prevent a major price spike?
The SPR provides a meaningful short-term buffer but is not designed to offset a sustained 13 million bpd supply loss. The reserve has already been drawn down substantially, and SPR borrowers currently owe the U.S. government approximately 40 million additional barrels. The SPR can buy time but cannot substitute for restored physical supply access.
Which countries are most vulnerable to a Strait of Hormuz oil price spike?
Asia-Pacific economies including Japan, South Korea, India, and China carry the heaviest import dependency on Persian Gulf crude. India is currently experiencing some of the most visible economic strain, with fuel demand down 6.5% and LPG consumption falling 20%. European economies face downstream refined product price inflation but have more diversified supply access than Asian peers.
Key Takeaway: The Convergence Is Coming
The central insight from the current Hormuz crisis is that futures markets and physical markets cannot remain disconnected indefinitely. Every day that physical supply falls short of demand, the gap between what is priced in futures contracts and what is actually available in storage tanks widens. The mechanisms that have absorbed that gap — strategic reserves, Chinese drawdowns, demand destruction, and dark tanker flows — are all finite and all simultaneously depleting.
When the paper market finally catches up to the physical reality of the worst supply disruption in modern energy history, the adjustment is unlikely to be gradual. The combination of critically low inventory levels, peak summer demand season timing, and the structural inability of incremental OPEC+ output or SPR releases to fill a 13 million bpd hole creates conditions where a rapid and disorderly price correction toward the $150 to $200 per barrel range is not a tail risk scenario. It is becoming the base case.
This article is intended for informational purposes only and does not constitute financial or investment advice. Oil price forecasts and scenario projections involve significant uncertainty and are subject to rapid change based on geopolitical developments, diplomatic outcomes, and market conditions. Readers should conduct their own research and consult qualified financial advisers before making investment decisions.
Further Exploration: Readers seeking live crude oil price data, IEA report coverage, and ongoing analysis of the Strait of Hormuz situation can access related reporting and market intelligence tools at OilPrice.com, which provides real-time price feeds and in-depth energy market analysis.
Want to Position Ahead of the Next Major Commodity Discovery Driven by Energy Market Disruption?
Discovery Alert's proprietary Discovery IQ model instantly identifies significant ASX mineral discoveries — including those in energy commodities — delivering real-time alerts that translate complex market signals into actionable opportunities, whether you're a short-term trader or a long-term investor. Explore historic discoveries and their exceptional returns to understand the potential, then start your 14-day free trial at Discovery Alert to ensure you're never the last to know when the next major opportunity emerges.