June 8, 2026
The Hidden Arithmetic Behind a Coming Oil Price Shock
Every major energy crisis in modern history has been preceded by a period of collective denial. Traders, policymakers, and consumers tend to anchor their expectations to recent normality, systematically discounting the possibility that a disruption they believe is temporary could instead become structurally transformative. That psychological pattern is playing out in real time across global oil markets in 2026, and the arithmetic underneath current inventory levels tells a story that futures prices are not yet reflecting.
The Strait of Hormuz oil price surge now unfolding is not simply a geopolitical premium layered on top of a stable supply picture. It is the product of a deepening physical inventory crisis that is approaching thresholds most market participants have never encountered in their professional lifetimes. Furthermore, understanding the geopolitical oil price analysis behind this crisis is essential for anyone tracking energy markets in 2026.
When big ASX news breaks, our subscribers know first
Why the Strait of Hormuz Is Genuinely Irreplaceable
The geography of the Strait of Hormuz creates a structural vulnerability with no practical workaround at scale. The passage connects the Persian Gulf to the Gulf of Oman and serves as the sole maritime exit for crude oil exports from Iran, Iraq, Kuwait, Saudi Arabia, Qatar, and the United Arab Emirates. At its navigable width, the strait measures approximately 33 kilometres, with designated shipping lanes far narrower than that figure implies.
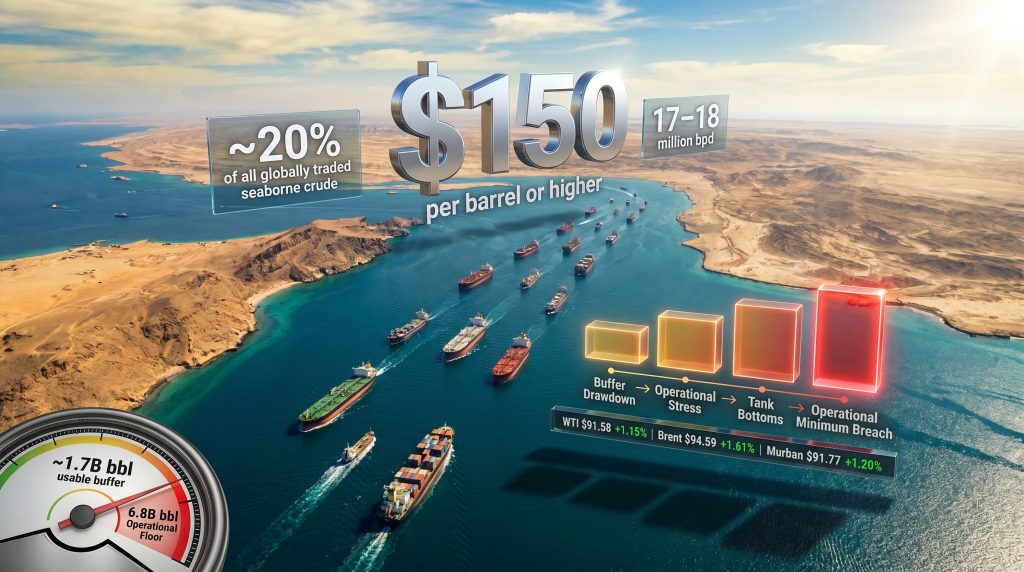
Under normal operating conditions, roughly 17 to 18 million barrels per day transit this single passage, representing approximately 20% of all globally traded seaborne crude oil. The pipeline bypass infrastructure that does exist, including Saudi Arabia's East-West Pipeline and the UAE's Habshan-Fujairah line, can handle an estimated 4 to 5 million barrels per day combined. That leaves a structural gap of roughly 12 to 13 million barrels per day that simply cannot be rerouted through any existing alternative.
To put that in perspective, the entire daily oil output of Russia, the world's third-largest producer, is approximately 9 to 10 million barrels per day. The unsubstitutable volume transiting Hormuz exceeds that figure. According to Al Jazeera's reporting on the crisis, violence in the strait has driven prices sharply higher as supply fears intensify.
A Historical Lens on Hormuz Disruptions and Price Responses
Past episodes of Hormuz tension offer instructive but imperfect precedents. Each previous disruption involved threats, partial interference, or short-lived incidents rather than a full operational closure of the type currently in effect.
| Event | Year | Brent Price Before | Brent Price Peak | % Change |
|---|---|---|---|---|
| Iran-Iraq Tanker War | 1984-1988 | ~$28/bbl | ~$35/bbl | +25% |
| Gulf War I Disruption | 1990-1991 | ~$20/bbl | ~$46/bbl | +130% |
| Iran Nuclear Standoff | 2012 | ~$100/bbl | ~$128/bbl | +28% |
| 2026 Iran-Israel War Closure | 2026 | ~$83/bbl | $94-$97/bbl+ | +14-17% (ongoing) |
The 2026 event is categorically different from every prior episode in the table above. Previous Hormuz disruptions triggered price spikes on the basis of risk and partial interference. The current situation, however, involves a full operational closure, meaning the inventory drawdown mechanism is active and compounding with every passing week.
Understanding the Two Thresholds That Now Define the Crisis
Two technical concepts have moved from specialist energy literature into mainstream market discussions as this crisis deepens. Understanding them is essential to grasping why the Strait of Hormuz oil price surge could accelerate sharply from current levels. In addition, the broader oil price volatility trends of recent years provide important context for what may follow.
Operational Minimum: The Physical Floor of the Global Oil System
The operational minimum is not a policy buffer or a comfort zone. It is the irreducible volume of oil required to keep global energy infrastructure physically operational. Pipelines must contain product to function. Refineries require continuous feedstock. Tankers in transit carry oil that is technically part of global inventories but is entirely inaccessible for immediate use. Below this threshold, the system does not slow down. It stops.
The global oil system's estimated absolute operational minimum floor is approximately 6.8 billion barrels. This volume is effectively locked into infrastructure and cannot be drawn upon regardless of price signals or policy decisions.
At the start of the current disruption in late February 2026, total global commercial inventories stood at approximately 8.5 billion barrels. Subtracting the 6.8 billion barrel operational floor leaves a genuinely usable buffer of only 1.7 billion barrels — a figure radically smaller than the headline inventory number suggests.
This distinction between reported inventories and accessible inventories is one of the most consequential analytical gaps in current market pricing.
Tank Bottoms: The Point Where Bidding Wars Begin
The term tank bottoms originates from a specific technical phenomenon in petroleum storage: the sediment and sludge that accumulates at the base of large storage tanks, requiring periodic removal and reprocessing. In a market context, the phrase has been adopted to describe the moment when practical commercial storage volumes fall so low that they can no longer reliably bridge gaps between supply and demand.
Critically, tank bottoms conditions are reached before the operational minimum floor is breached. Once buyers perceive that available prompt supply is genuinely scarce at the commercial level, competitive bidding intensifies rapidly. Industry executives and veteran market analysts have stated that oil prices could reach $150 per barrel or higher once this threshold is crossed.
A senior ExxonMobil executive recently communicated to investors and analysts that inventory levels are approaching territory that the industry has not previously encountered. Separately, industry representatives have communicated concerns directly to senior levels of the U.S. government, warning that the market is approaching tank bottom conditions and urging close attention to the pace of inventory drawdown.
The Four-Stage Drawdown: How the Crisis Is Unfolding in Real Time
Mapping the trajectory of global oil inventories against the two critical thresholds above produces a four-stage scenario model that clarifies what has already happened and what likely lies ahead.
Stage 1: Buffer Drawdown Phase (March–May 2026)
- Commercial inventories deployed to compensate for the loss of Persian Gulf supply
- Strategic Petroleum Reserve releases activated globally to extend available runway
- Futures markets remained relatively calm; forward curves implied traders expected swift conflict resolution
- WTI one-year forward price settled around $75/bbl, only approximately $8 above the February 27, 2026 pre-war baseline
Stage 2: Operational Stress Emergence (June 2026)
- Analysis indicates global oil system operational stress begins manifesting during June 2026
- Characteristics of operational stress include extreme price volatility, early-stage product rationing in the most exposed markets, and near-zero margin for supply chain error
- Even full SPR deployment at this stage extends the runway by weeks, not months, at prevailing drawdown rates
Stage 3: Tank Bottoms Approached (Late June–July 2026)
- Practical commercial storage volumes approach critically low levels
- Prompt WTI futures for July 31 delivery settled at $90.54/bbl, a figure analysts argue still underprices the physical inventory reality
- Market complacency persists despite clear warning signals from industry insiders
Stage 4: Operational Minimum Breach Risk (September 2026)
- Current trajectory places the global system approaching the 6.8 billion barrel operational floor by September 2026
- Price spikes to $150/bbl or beyond become structurally probable rather than merely possible
- Supply chain rationing, regional fuel shortages, and involuntary demand destruction become unavoidable outcomes
Why Oil Futures Markets Are Mispricing This Risk
The persistence of relatively contained futures prices in the face of an accelerating physical inventory crisis represents one of the more striking examples of collective market mispricing in recent energy history. Three structural factors explain why repricing has been delayed.
1. The Anchoring Effect of Repeated Resolution Assurances
Frequent and consistent public statements from the Trump administration asserting that the Iran conflict is approaching resolution have anchored trader expectations towards normalisation. When authoritative sources repeatedly signal that a disruption is temporary, futures markets tend to price accordingly, even when physical evidence points in the opposite direction. Historical precedent from multiple prior geopolitical supply disruptions confirms that markets systematically underestimate duration during the early and middle phases of a crisis. This mirrors the broader trade war impact on oil markets, where political signals have repeatedly delayed accurate market repricing.
2. Fuel Subsidy Distortions Masking the True Demand Signal
In multiple major consuming nations, government fuel subsidies are insulating end consumers from the full price impact of the supply disruption. This dampens the demand destruction mechanism that would ordinarily function as a self-correcting force, reducing consumption in response to higher prices and thereby slowing inventory drawdowns. Without visible demand destruction in the data, the market lacks the signal that would ordinarily trigger more aggressive forward pricing.
3. The Headline Inventory Illusion
Widely reported figures showing approximately 8.5 billion barrels of global commercial inventory create an impression of substantial cushion. Most market participants have not internalised the distinction between total reported stocks and genuinely accessible buffer volumes. When the 6.8 billion barrel operational floor becomes widely understood, a rapid and potentially disorderly repricing event becomes structurally likely.
The combination of anchored expectations, subsidy-distorted demand signals, and misunderstood inventory thresholds does not create conditions for a gradual price trend. It creates conditions for a sudden, disorderly repricing event when the market is forced to confront the physical reality.
Real-Time Price Signals Across Global Benchmarks
Current market data confirms that upward pressure is building across the full spectrum of petroleum products, not just crude benchmarks.
| Benchmark | Recent Price | Change | Signal |
|---|---|---|---|
| WTI Crude | $91.58/bbl | +1.15% | Upward pressure intensifying |
| Brent Crude | $94.59/bbl | +1.61% | Approaching key resistance levels |
| Murban Crude | $91.77/bbl | +1.20% | Gulf-linked grades reflecting disruption premium |
| Heating Oil | $3.641/gal | +1.49% | Refined product tightness emerging |
| Gasoline | $3.088/gal | +1.37% | Consumer-level price pressure building |
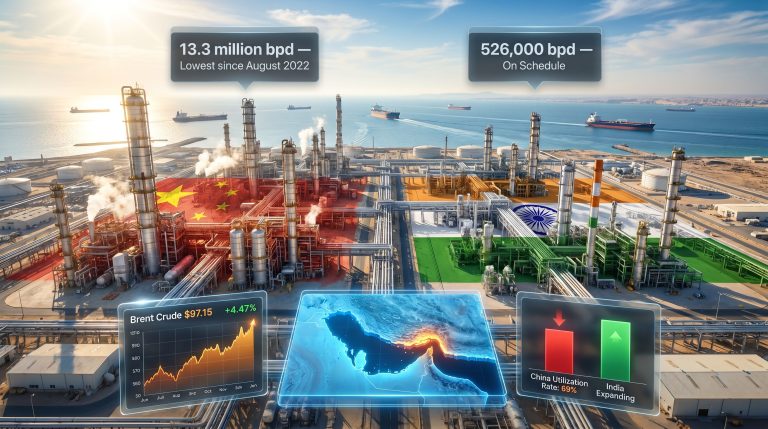
Downstream effects are materialising across multiple regions simultaneously. Eurozone fuel sales volumes have declined 3.5% as elevated prices begin suppressing consumption. China has delayed approximately 500,000 barrels per day of refining capacity as Hormuz disruptions deepen, while the country's LNG imports have reached their highest level since the Iran war began. South Korea has locked in Canadian crude and LNG supply contracts as part of a sweeping supply diversification programme.
Indian crude imports from Venezuela surged 51% in a single month as buyers scrambled for non-Gulf supply alternatives, and India has separately launched an 85% ethanol fuel blend programme to reduce oil import dependence. Compounding the Hormuz disruption, ongoing Houthi targeting of Israeli-linked vessels in the Red Sea is extending shipping disruptions well beyond the strait itself, tightening the overall tanker market and raising freight costs globally.
The next major ASX story will hit our subscribers first
The SPR Problem: A Tool Designed for Weeks, Not Months
Strategic petroleum reserves have historically been calibrated to manage supply disruptions measured in weeks — specifically to bridge the period between an unexpected supply loss and the market's ability to redirect alternative sources. The current crisis has, however, exposed the limitations of this design assumption.
Analysis confirms that even full deployment of all available global strategic reserves extends the inventory runway by only weeks at current drawdown rates, not the months required for the crisis to resolve itself through negotiation and physical normalisation of Hormuz traffic.
The U.S. SPR faces an additional structural constraint: borrowers from prior SPR releases owe approximately 40 million barrels that have not yet been returned to storage. This reduces the effective available reserve below its nominal headline figure at precisely the moment maximum capacity would be most valuable. OPEC's market influence has also proven insufficient to offset the scale of the disruption through production adjustments alone.
Why a Ceasefire Would Not Immediately Resolve the Supply Crisis
A widely held assumption in oil futures markets is that a ceasefire or peace agreement would rapidly normalise supply conditions. The timeline arithmetic does not support this view.
| Scenario | Trigger | Time to Normalise Hormuz Traffic | Price Outcome |
|---|---|---|---|
| Best Case | Immediate ceasefire + full diplomatic agreement | Minimum 3 months to normalise flows | Prices remain elevated; $90–$110/bbl range |
| Base Case | Negotiated pause with phased reopening | 4–6 months | Prices spike before declining; $120–$140/bbl peak |
| Stress Case | Prolonged conflict; no agreement in 2026 | 6–12+ months | $150+/bbl; demand destruction and global recession risk |
Under even the most optimistic scenario, a minimum of three months is required to safely normalise tanker traffic through the strait after any agreement is reached. Minesweeping, security verification, insurance reinstatement for commercial vessels, and the physical logistics of restarting suppressed production chains all take time that cannot be compressed regardless of political will.
Kuwait has publicly stated that its oil output cannot recover for 10 to 12 weeks after Hormuz reopens, adding a production restoration lag on top of the transit normalisation lag. Consequently, commercial inventories will continue declining for months after any ceasefire announcement, and the tank bottoms scenario is not avoidable even under a best-case diplomatic outcome. Time Magazine's analysis of gas prices confirms that consumer-level impacts will persist well beyond any formal peace agreement.
Sectors and Regions Facing the Greatest Exposure
The vulnerability profile of this supply shock is not evenly distributed. Certain regions and industries face structurally higher exposure due to their dependence on Middle Eastern crude grades and limited substitution flexibility.
Highest Exposure Regions:
- East Asia (Japan, South Korea, Taiwan): heavy reliance on Gulf crude with minimal domestic production base
- South Asia (India, Pakistan): large import volumes combined with subsidy burdens that constrain fiscal response capacity
- Western Europe: refining infrastructure calibrated for Gulf crude grades with limited short-term substitution flexibility
Most Exposed Industries:
- Aviation: jet fuel tightness already emerging; EU has flagged supply monitoring across member states
- Road freight and logistics: diesel as primary fuel with no rapid substitution pathway available
- Petrochemicals: feedstock cost inflation transmitting into plastics, fertilisers, and packaging across supply chains
- Power generation in oil-dependent economies across the Middle East and parts of Asia
Partial Buffers Worth Noting:
- U.S. domestic shale production provides meaningful insulation for American consumers; research from the Federal Reserve confirms that oil price shocks no longer transmit to the U.S. economy with the same severity as in prior decades
- Norway's offshore sector remains fully operational following a recently averted industrial strike, keeping North Sea supply stable
- Iraq is targeting 770,000 barrels per day through the Ceyhan pipeline as southern output recovers, providing partial incremental relief
The Structural Verdict: What the Inventory Mathematics Actually Imply
The current Strait of Hormuz oil price surge is not a standard geopolitical risk premium that will fade as diplomatic activity progresses. It is the early price signal of a physical inventory crisis that is arithmetically constrained in ways most market participants have not yet fully priced. This differs fundamentally from the more contained oil price rally driven by tariff uncertainty earlier in the year.
The core facts are these:
- Genuinely accessible global oil buffer stocks stand at approximately 1.7 billion barrels, not the 8.5 billion barrels suggested by headline inventory data
- Operational stress is already emerging, with tank bottoms conditions projected to be approached in late June to July 2026
- The operational minimum floor breach risk arrives in September 2026 on the current drawdown trajectory
- Oil futures markets remain structurally mispriced relative to the physical inventory reality
- Even an immediate peace agreement cannot prevent continued inventory drawdowns during the minimum three-month Hormuz normalisation period
- Kuwait's 10 to 12-week production recovery lag compounds the timeline further
- SPR deployment buys weeks, not months, at current drawdown rates
The combination of anchored trader expectations, subsidy-distorted demand signals, and widespread misunderstanding of the operational minimum concept has created conditions not for a gradual price trend but for a disorderly repricing event. When futures markets are forced to confront the physical floor arithmetic, the adjustment is unlikely to be orderly.
Disclaimer: This article is intended for informational and educational purposes only and does not constitute financial, investment, or trading advice. Oil price forecasts, inventory projections, and scenario analyses involve inherent uncertainty and are subject to rapid change based on geopolitical developments, policy decisions, and market dynamics. Readers should conduct their own research and consult qualified financial advisers before making investment decisions.
Want to Stay Ahead of the Next Major Resource Discovery While Energy Markets Shift?
While oil markets grapple with the deepening Hormuz supply crisis, significant opportunities continue to emerge across ASX-listed resource companies — and Discovery Alert's proprietary Discovery IQ model delivers real-time alerts the moment a major mineral discovery hits the exchange, turning complex data across 30+ commodities into clear, actionable insights. Explore historic discoveries and the returns they generated, then begin your 14-day free trial to ensure you're positioned ahead of the market when the next transformative find is announced.