August 8, 2026
The Hidden Architecture of Global Energy: Why One Narrow Waterway Controls Everything
Every barrel of crude oil, every liquefied natural gas cargo, and every tanker that navigates the world's most strategically sensitive maritime corridor does so within a framework most traders never see until it breaks. The Strait of Hormuz is not simply a geographic feature. It is a pressure valve for the entire global energy system, and in 2026, that valve is partially closed, conditionally monitored, and politically contested in ways that are reshaping how oil markets price risk at a fundamental level.
Understanding the current volatility in Strait of Hormuz oil prices requires moving beyond headline figures. The real story lies in the transmission mechanisms, the structural incompatibilities of proposed solutions, and the compounding risk layers that are making this disruption categorically different from previous episodes. For context on broader crude oil volatility trends, the current disruption represents one of the most structurally complex episodes in recent memory.
When big ASX news breaks, our subscribers know first
Why No Alternative Can Replace the Strait of Hormuz at Scale
The strait connects the Persian Gulf to the Gulf of Oman across a navigable channel that narrows to approximately 33 kilometres at its tightest point. Despite its modest width, this corridor accommodates roughly one-fifth of the world's combined oil and LNG supply under normal operating conditions, a concentration of energy transit that has no functional equivalent anywhere on earth.
Alternative routing options exist but carry severe economic penalties:
- The East-West Pipeline across Saudi Arabia (the Petroline) has a maximum capacity of approximately 5 million barrels per day, a fraction of total Hormuz throughput.
- The Habshan-Fujairah pipeline in the UAE bypasses the strait but operates at limited capacity relative to total Gulf export volumes.
- Re-routing supertankers around the Cape of Good Hope adds 10 to 15 days of transit time per voyage, multiplying freight costs and vessel requirements simultaneously.
- LNG carriers face even more acute constraints, as liquefaction terminals and receiving facilities are geographically fixed and cannot be easily redirected.
The practical reality is that the strait functions as a geographic monopoly. No combination of bypass infrastructure currently in operation can absorb the volume shortfall created by even a partial closure. This is precisely why markets respond so violently to even credible threat signals, not just confirmed physical disruptions.
Quantifying the Throughput at Stake
To appreciate the scale of the current disruption, consider the contrast between normal operating conditions and the post-conflict reality that energy markets are now navigating.
| Metric | Estimated Figure |
|---|---|
| Share of global oil and LNG through the strait | ~20% |
| Post-conflict flow recovery estimate | ~30-35% of pre-war levels |
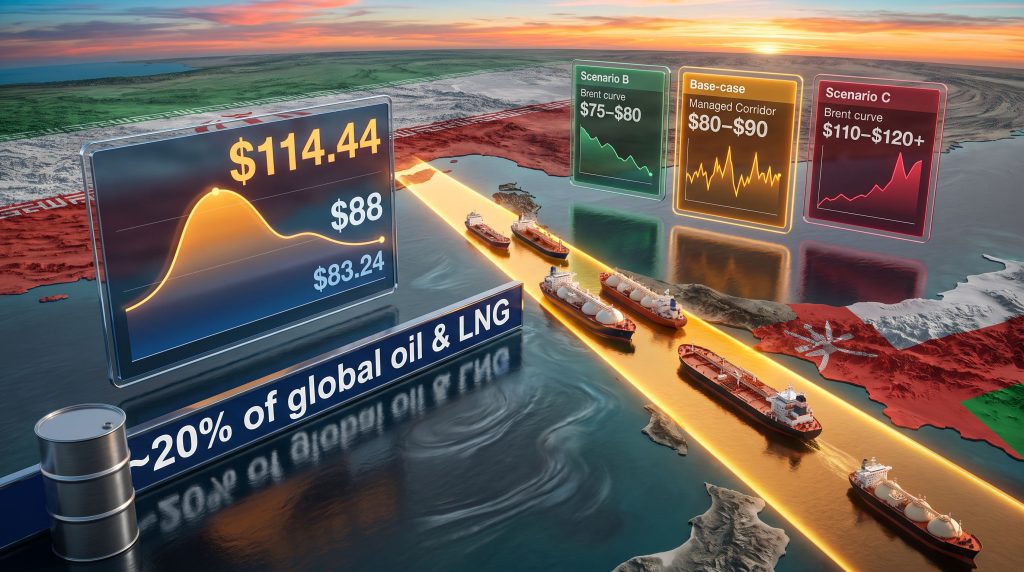
| Brent price during peak disruption | $103-$114.44/barrel |
| Brent price after partial flow restoration | ~$88/barrel |
| Most recent Brent price level | ~$83.24/barrel |
| WTI most recent level | ~$77.71/barrel |
The partial recovery to 30-35% of pre-war flow levels is often misread as a positive development. In reality, it means the vast majority of normal throughput remains suppressed, and the commercial and legal framework governing what vessels can transit, under what conditions, and at what cost remains fundamentally unresolved.
How Geopolitical Risk Translates Into Barrel Pricing
The mechanics of how Strait of Hormuz disruptions move Brent crude prices follow a specific sequence that traders and analysts have observed repeatedly across historical episodes, though the 2026 iteration carries structural features that make it more complex than its predecessors. Furthermore, the trade war impact on oil adds an additional layer of complexity that compounds the geopolitical pricing dynamic currently unfolding.
The five-stage transmission mechanism works as follows:
- Physical shipping disruptions, or credible threat signals, reduce available tanker supply and compress effective corridor capacity.
- War-risk insurance premiums surge sharply, raising the effective delivered cost of every cargo even when vessels are technically still transiting.
- The spot market tightens as buyers compete for non-Hormuz-routed cargoes, driving up prices for alternative supply sources.
- Futures markets embed a geopolitical risk premium that persists until the market receives clarity on corridor access conditions.
- Sentiment reversal occurs rapidly when diplomatic signals suggest potential reopening, often producing sharp intraday price collapses.
This fifth stage was vividly demonstrated during the current disruption period. According to reporting by Al Jazeera, when Iranian officials publicly stated that the strait remained open to commercial vessels, Brent crude dropped sharply from above $98/barrel to approximately $88/barrel within a single trading session. Conversely, when Iran reviewed a legislative bill that would formalise bans and financial penalties for vessels deemed hostile, futures contracts settled more than $3/barrel higher on the day.
The most dramatic single-session move saw Brent reach an intraday high of approximately $114.44/barrel during peak disruption conditions, following direct military exchanges near the corridor. The earlier phase of escalation had already pushed prices to approximately $103/barrel, representing a nearly 3% single-session gain.
Rystad Energy's analysis frames the current situation precisely: the market is not simply pricing in a negative outcome. It is pricing in confirmation that whatever arrangement emerges will represent a managed, conditional corridor rather than a restoration of unrestricted commercial flow.
The Proposed Transit Fee Framework and Why It Cannot Work
At the centre of the current impasse sits Iran's proposed fee structure for Strait of Hormuz transit rights. Understanding why this framework is structurally unworkable requires examining it from legal, commercial, and insurance perspectives simultaneously. In addition, OPEC's influence on oil markets means that any prolonged disruption here would likely prompt coordinated production responses that further complicate the pricing picture.
| Stakeholder | Proposed Transit Fee | Key Position |
|---|---|---|
| Iran | 5%-7% of cargo value | Vessels deemed compliant with Iranian rules |
| Oman (mediating) | ~3% of cargo value | Negotiated compromise position |
| United States | 0% (no fees) | Full commercial restoration without conditions |
Four independent industry sources have characterised the proposed framework as not practically workable in its current form. The barriers are structural, not merely political:
- US sanctions architecture makes fee payment to Iranian-controlled authorities legally prohibited for the majority of Western-flagged or Western-insured vessels, regardless of the political intent behind any agreement.
- War-risk insurance clauses contain restrictive provisions that create direct compliance conflicts with any payment mechanism directed toward Iranian authorities. These clauses were designed precisely to prevent insurers from indirectly facilitating payments to sanctioned entities.
- Enforcement ambiguity represents perhaps the most underappreciated risk. No clear, verifiable threshold exists for determining which vessels Iran would classify as hostile or in violation of proposed rules. This discretionary enforcement dimension introduces a category of risk that markets price as a permanent premium, not a temporary disruption cost.
- Verification mechanisms are entirely absent from the current framework, meaning even vessels that pay fees would have no legal certainty regarding their status under Iranian interpretation.
The absence of a clear compliance threshold means that even well-intentioned participants cannot achieve certainty. This is not a regulatory grey area. It is a structural gap that transforms every transit decision into a probabilistic risk assessment rather than a routine commercial operation.
Vanda Insights has observed that while diplomatic signals have driven significant swings in market sentiment throughout the current period, the market remains without clarity on the specific conditions required to finalise any workable agreement. This information vacuum is itself a persistent price driver.
Brent vs. WTI: Understanding the Divergence in Hormuz Sensitivity
Not all benchmarks respond identically to Strait of Hormuz oil prices stress. The divergence between Brent crude and West Texas Intermediate during the current disruption period reveals something important about the underlying structure of each market.
Both benchmarks were tracking weekly losses of approximately 8% at the time of the most recent reporting, but their intraday behaviour differed meaningfully:
- Brent crude carries disproportionately high Hormuz sensitivity because it serves as the primary pricing benchmark for Middle Eastern crude flows and Asian import contracts. The bulk of the physical oil disruption is denominated and priced through Brent.
- WTI draws its pricing base from domestic US production in the Permian Basin and other shale plays, giving it partial structural insulation from Persian Gulf supply disruptions. This explains its comparatively tighter intraday move of 0.5% versus Brent's 0.9% on the most recent trading day.
- The Brent-WTI spread has therefore widened during peak disruption periods, functioning as a real-time market indicator of perceived Hormuz supply risk. Traders monitoring this spread gain a more granular read on how the market is weighting physical supply concerns versus broader macroeconomic pricing factors.
The next major ASX story will hit our subscribers first
The Multi-Front Risk Environment Compounding Hormuz Uncertainty
The Strait of Hormuz situation does not exist in isolation. Two additional risk dimensions are operating simultaneously and amplifying the baseline disruption premium in ways that single-source analysis frameworks fail to capture.
How Are Regional Military Activities Affecting Oil Markets?
Yemen's Houthi movement conducted coordinated missile and drone strikes against Saudi military deployments in the Marib and Hadramout provinces, introducing a second active theatre of Gulf infrastructure risk. Historically, Houthi attacks on Gulf energy infrastructure have added between $2 and $5/barrel in reactive premium to Brent futures, though sustained campaigns have shown diminishing market sensitivity over time as traders recalibrate baseline expectations.
What Role Does US Federal Reserve Policy Play?
Oil markets were simultaneously pricing in the implications of upcoming US non-farm payrolls data, with direct consequences for Federal Reserve interest rate expectations. This creates an unusual analytical challenge for energy traders:
- Higher interest rate trajectories suppress consumer spending, compress industrial activity, and reduce forward oil demand forecasts.
- Simultaneously, supply-side geopolitical disruptions through the strait create upward price pressure.
- The net result is a market pricing two fundamentally opposing forces at once, producing compression in directional conviction and amplification in volatility amplitude.
This monetary-geopolitical overlay is a key reason why the 8% weekly loss in oil benchmarks occurred even during a period of acute supply disruption. Strong payrolls data suggesting sustained rate pressure was sufficient to partially offset the geopolitical risk premium in the futures strip.
Scenario Modelling: Three Pathways and Their Price Implications
Market participants are currently assigning probabilities across three structurally distinct resolution scenarios, each carrying materially different implications for Brent crude pricing. Understanding these scenarios is essential for anyone monitoring US-China oil price risks, as Chinese demand dynamics would be severely affected under the more extreme outcomes.
Scenario A: Managed Conditional Corridor (Current Base Case)
Transit continues under informal or formally codified Iranian conditions, with partial compliance from non-sanctioned vessels. The flow recovery remains capped at 30-35% of pre-war levels, with ongoing fee negotiation uncertainty.
- Brent likely trades in the $80-$90/barrel range with structurally elevated volatility.
- War-risk insurance premiums remain high, adding an effective 1-3% to cargo costs that are invisible in headline benchmark prices but material to delivered economics.
- The current price of approximately $83.24/barrel is broadly consistent with this scenario's implied range.
Scenario B: Negotiated Full Restoration
A US-Iran agreement removes fee structures entirely and restores unrestricted commercial access. The risk premium fully unwinds.
- Brent likely retraces toward the $75-$80/barrel range as the geopolitical premium is removed from the forward curve.
- Asian LNG spot prices would ease materially, with particular relief for Japanese, South Korean, and Chinese buyers facing elevated spot premiums.
Scenario C: Escalation and Effective Blockade
Physical interdiction of commercial vessels or a formal closure declaration pushes the strait to near-zero throughput.
- Brent could test $110-$120+/barrel territory based on historical disruption precedents and current supply tightness.
- Asian LNG markets would face acute spot shortages, with no sufficient alternative supply source capable of bridging the gap within a commercially relevant timeframe.
The current Brent price level implies that market participants are assigning the highest probability weight to Scenario A, with Scenario C tail risk providing the floor under any dip below $80/barrel. However, as The Guardian has reported, the picture shifts rapidly as tanker movements through the corridor continue to evolve.
Key Indicators to Monitor for Hormuz Oil Price Direction
For participants navigating oil market exposure during the current disruption period, five indicators carry the highest signal value. Furthermore, a broader understanding of oil trade and geopolitics provides essential context for interpreting these signals correctly:
- Tanker tracking data: Real-time vessel movement through the strait provides the most reliable leading indicator of actual physical flow recovery, ahead of any official statement or negotiating signal.
- War-risk insurance premium movements: Sustained compression in premiums signals genuine commercial normalisation. Spike resumptions signal renewed physical risk regardless of diplomatic rhetoric.
- Iranian legislative progress: Formal passage or rejection of the transit fee bill will crystallise the regulatory framework and remove a significant source of market uncertainty.
- Oman-mediated diplomatic channel activity: Oman's role as a mediating party makes its public statements and behind-the-scenes signalling the most reliable indicator of negotiating progress.
- Houthi operational tempo: Continued or intensifying attacks on Gulf infrastructure extend and compound the multi-front risk premium beyond the strait itself.
Frequently Asked Questions: Strait of Hormuz and Oil Prices
What percentage of global oil passes through the Strait of Hormuz?
Approximately 20% of the world's combined oil and LNG supply transits the Strait of Hormuz under normal operating conditions, making it the single highest-volume energy chokepoint globally.
How high did oil prices go during the 2026 Hormuz disruption?
Brent crude reached an intraday high of approximately $114.44/barrel during peak disruption conditions. Prices subsequently moderated to the $83-$88 range as partial flow recovery occurred.
What fees is Iran proposing for Strait of Hormuz transit?
Iran has proposed transit fees of between 5% and 7% of cargo value. Oman, acting as a mediating party, has proposed approximately 3%, while the United States has rejected any fee structure entirely.
Why are the proposed transit fees considered unworkable?
Existing US sanctions make fee payment legally prohibited for most Western-flagged or insured vessels. War-risk insurance clauses create additional compliance conflicts, and no verification or enforcement mechanism has been defined.
What would a full closure of the Strait of Hormuz do to oil prices?
Based on current supply conditions and historical disruption precedents, a formal closure could push Brent crude above $110-$120+/barrel, with acute secondary effects on Asian LNG spot markets where alternative supply options are severely limited.
Disclaimer: This article is intended for informational purposes only and does not constitute financial advice. Oil price forecasts and scenario analyses involve significant uncertainty. Past price behaviour during geopolitical disruptions does not guarantee equivalent outcomes in current or future events. Readers should conduct independent research before making investment or trading decisions.
Want to Position Yourself Ahead of the Next Major Resource Discovery?
Discovery Alert's proprietary Discovery IQ model delivers real-time alerts on significant ASX mineral discoveries, instantly transforming complex resource data into actionable investment insights — explore historic discoveries and their returns to understand the magnitude of opportunity, then begin your 14-day free trial at Discovery Alert to ensure you're never the last to know when the next major find hits the market.