
June 17, 2026
When Politics Moves Faster Than Physics: Understanding the Real Timeline for Strait of Hormuz Oil Production Recovery
Energy markets have a persistent tendency to price recoveries as though geopolitical resolutions translate instantly into barrels flowing. History disagrees. When the physical mechanics of oil production intersect with damaged infrastructure, depleted reservoirs, and dislocated shipping markets, the gap between a ceasefire announcement and genuine supply normalisation can stretch from months into years. The current disruption to Gulf crude flows represents arguably the most technically complex supply shock the modern oil market has ever encountered, and the pace of Strait of Hormuz oil production recovery will ultimately be dictated not by diplomats, but by drill pipes, tanker schedules, and reservoir pressure gradients.
When big ASX news breaks, our subscribers know first
The Scale of What Has Actually Been Disrupted
To appreciate why recovery will be slower than consensus expects, it helps to first understand the magnitude of what has been lost. The Strait of Hormuz ordinarily serves as the transit corridor for roughly one-fifth of all global oil and gas trade, with baseline throughput of approximately 20 million barrels per day (mbd). Historical peak flows have reached 23.3 mbd, a figure that underscores just how deeply the global energy system depends on this narrow waterway remaining open. The World Economic Forum has highlighted the Strait's enduring strategic importance to global trade and energy flows.
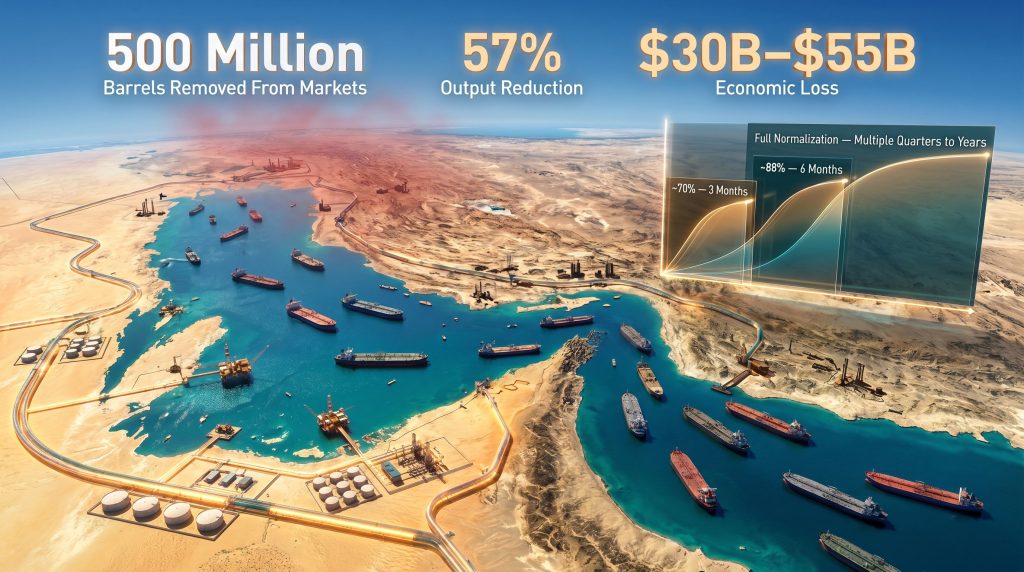
The disruption to Gulf crude output since hostilities began has been staggering by any historical measure. Goldman Sachs research estimated that Gulf production fell by approximately 14.5 mbd, representing a 57% reduction from pre-conflict output levels. To put that in context, the 1990–1991 Gulf War, which is typically cited as a major supply shock, removed roughly 4 to 5 mbd at its peak. The current disruption is more than three times that scale.
The cumulative impact of this reduction has effectively removed an estimated 500 million barrels of crude oil from accessible global markets, with associated economic losses estimated in the range of $30 billion to $55 billion. Goldman Sachs has explicitly characterised this event as unprecedented in the modern oil market era, noting that no historical analogy offers a clean recovery template. Furthermore, these crude oil price trends have reinforced just how exposed global markets remain to concentrated supply points.
Goldman Sachs research identified the current Gulf supply shock as without precedent in its scale, cautioning that historical recovery models may not adequately capture the complexity or duration of the normalisation process.
Why the Optimistic Recovery Scenarios Deserve Scrutiny
What the Forecasts Actually Say
Recovery projections compiled from external forecasting agencies, including the U.S. Energy Information Administration (EIA) and the International Energy Agency (IEA), suggest that under favourable conditions, approximately 70% of lost production could return within three months of the Strait reopening, rising to roughly 88% by the six-month mark. These figures are frequently cited by market commentators as evidence that recovery will be relatively swift. However, several qualifications embedded within the same analysis are receiving far less attention.
First, these projections assume no renewed strikes on oil assets following the Strait's reopening. Second, they assume a full and safe reopening rather than a partial or contested one. Third, they are averages derived from historical episodes that involved meaningfully smaller and less complex disruptions. Goldman Sachs explicitly flagged that the last leg of any production ramp-up could be prolonged and may fail to fully materialise if the closure persists or conditions deteriorate.
The Table Markets Are Not Pricing
| Recovery Scenario | Timeline Post-Reopening | Output Restoration |
|---|---|---|
| Best-case partial recovery | 3 months | ~70% of lost production |
| Moderate recovery | 6 months | ~88% of lost production |
| Full normalisation | Multiple quarters to years | Potentially incomplete |
| Capacity scarring outcome | Indefinite | Permanent loss possible |
The most important row in this table is the last one. Capacity scarring, examined in more detail below, represents the scenario where full recovery never arrives — not because of ongoing conflict, but because of irreversible physical and reservoir-level damage that forecloses production potential permanently.
The Four Bottlenecks That Will Determine the Pace of Recovery
1. Tanker Market Dislocation: The Constraint Nobody Is Talking About
Physical reopening of the Strait does not automatically restore export flows. Goldman Sachs estimated that available empty tanker capacity within the Gulf corridor fell by approximately 50%, equivalent to a reduction of roughly 130 million barrels of shipping capacity, since the conflict began. At a typical very large crude carrier (VLCC) capacity of around 2 million barrels per vessel, this equates to the effective removal of approximately 65 large tankers from the Gulf market.
These vessels did not disappear; they were repositioned to alternative routes or idled due to war-risk insurance constraints. Bringing them back requires:
- Sustained demonstrated security in the corridor over multiple weeks
- Normalisation of war-risk insurance premiums, which have risen sharply and are unlikely to retrace quickly
- Commercial confidence from vessel operators that voyage economics justify re-entry
- Resolution of disrupted routing economics that developed as tankers restructured their operating patterns
The insurance market dynamic is particularly underappreciated. War-risk premiums in conflict zones tend to remain elevated well beyond the formal end of hostilities, as underwriters price in the residual probability of renewed conflict. This creates a structural lag between political resolution and commercial normalisation that can persist for six to eighteen months even under genuinely improving security conditions.
2. Pipeline Capacity Is Already Saturated
During the Strait closure, Gulf producers attempted to redirect flows through alternative pipeline infrastructure. Historical data cited by Goldman Sachs shows that pipeline redirection capacity was operating at approximately 3.5 mbd above normal throughput — a buffer that has been largely absorbed. This is a critical constraint that limits the ability to use phased Strait reopening as a gradual ramp mechanism.
With pipeline alternatives already running near capacity, there is minimal headroom to compensate for continued restrictions during any transitional reopening period. New pipeline capacity operates on multi-year construction timelines, meaning this constraint cannot be resolved within the recovery window. In addition, these oil market impacts compound the existing logistical pressures facing producers throughout the region.
3. Reservoir Physics Cannot Be Rushed
This is the bottleneck that receives the least attention in mainstream market commentary but carries the greatest long-term significance. When oil wells are forced offline for extended periods, the reservoir itself changes in ways that require physical intervention before production can resume. The key technical mechanisms involved include:
- Pressure depletion: In pressure-driven reservoirs, reduced production allows reservoir pressure to drop, requiring pressure restoration through gas injection or water flooding before wells can flow at economic rates
- Paraffin and scale deposition: Reduced temperatures and flow rates during shut-in periods can allow waxy hydrocarbons and mineral scale to accumulate in wellbores, restricting or blocking production pathways
- Sand migration: Depressurised formations can experience increased sand production into wellbores, potentially damaging downhole pumps and completion equipment
- Workover backlogs: Each affected well requires physical intervention by a specialised workover rig, and workover rig availability across the Gulf is finite
Adding to this complexity is the procurement dimension. Goldman Sachs highlighted that the longer the closure persists, the more extensive the workover requirements become, and the slower the procurement of depleted inputs such as drill pipes, which compounds restart delays further.
4. The Operational Readiness Gap
Restarting large-scale hydrocarbon production is not analogous to switching on a light. It requires the coordinated return of specialist engineering personnel, maintenance contractors, chemical supply chains, and operational management systems that may have been partially or fully stood down during the conflict period. Extended disruption erodes institutional readiness in ways that are difficult to quantify but real in their impact on restart timelines.
How Recovery Capacity Differs Across Gulf Producers
Not all Gulf producers face equivalent restart challenges. The structural differences between countries will produce meaningfully divergent recovery trajectories even under identical political conditions.
| Producer | Recovery Speed | Primary Strengths | Key Constraints |
|---|---|---|---|
| Saudi Arabia | Fastest | Spare capacity available, limited oil field damage | Minimal |
| UAE | Fast | High infrastructure standards, limited damage | Limited |
| Iraq | Moderate to slow | Meaningful production base | Reservoir pressure issues, maintenance gaps |
| Iran | Slowest | Large reserve base | Low-pressure fields, sanctions exposure, equipment procurement barriers |
Goldman Sachs identified three reasons for relative optimism about near-term recovery in the cases of Saudi Arabia and the UAE specifically. Physical damage to oil field assets in these countries remains limited compared to LNG infrastructure. Statements from Saudi Aramco's leadership in early 2026 indicated that Saudi production could ramp up relatively quickly following a Strait reopening. Both countries also retain meaningful spare production capacity that can be deployed to support market stabilisation during the recovery phase.
The situation for Iran and Iraq is structurally different. Goldman Sachs assessed both countries as having a disproportionately high share of production from fields with relatively low reservoir pressure, making restart operations materially more complex. Iran faces the additional constraint of sanctions exposure, which complicates access to specialist equipment, technical services, and project financing. Consequently, Iran and Iraq are likely to lag Saudi Arabia and the UAE by a significant margin even under the most favourable political scenario. OPEC's market influence will also play a pivotal role in how coordinated any broader Gulf production response ultimately becomes.
Capacity Scarring: The Tail Risk Markets Are Underweighting
What Scarring Actually Means
Capacity scarring refers to the permanent or semi-permanent degradation of oil production capability resulting from extended disruption, physical damage, or deferred maintenance beyond the point of economic recovery. Goldman Sachs warned that while this is not its baseline scenario, the risk of scarring rises materially if hostilities resume, as observed in several of the previous five largest oil supply shocks in history.
Goldman Sachs cautioned that while capacity scarring is not its central case, the probability of irreversible production capacity loss increases significantly if conflict resumes following any initial ceasefire, based on patterns observed across the five largest historical oil supply disruptions.
Why LNG Faces a Worse Scarring Outcome Than Crude Oil
One underappreciated dimension of the current disruption is the bifurcated nature of infrastructure damage. Goldman Sachs noted that reported physical damage to oil field assets remains limited compared to LNG facilities, which have sustained more significant harm. This matters because LNG infrastructure operates on fundamentally different repair timelines than conventional oil facilities.
LNG liquefaction trains, storage tanks, and loading terminals are highly engineered, capital-intensive assets with complex procurement and construction requirements. Damage to these facilities can require multi-year reconstruction programmes. This creates a scenario where crude oil production potentially recovers within one to two years while gas supply constraints persist for three to five years or longer, producing a bifurcated energy market recovery with very different implications across commodity classes. Goldman Sachs' analysis on the pace of output recovery, should the Iran conflict conclude, provides further context for understanding these divergent timelines.
The next major ASX story will hit our subscribers first
What Investors and Analysts Should Actually Be Monitoring
Given the complexity of the recovery process, single-point timeline estimates are analytically misleading. A more rigorous framework involves tracking leading indicators that reveal the genuine pace of normalisation rather than political announcements that precede actual operational progress.
Key leading indicators to monitor:
- Tanker re-entry rates into the Gulf corridor, measured as a weekly or monthly vessel count, provide a real-time signal of commercial confidence in the corridor's security
- War-risk insurance premium trajectory in Gulf shipping lanes, as premiums function as a forward-looking market assessment of residual conflict probability
- Workover rig utilisation rates across Gulf producers, as elevated utilisation signals active restart operations rather than merely announced intentions
- Pipeline throughput data from alternative routes, where declining throughput signals that Strait flows are genuinely beginning to substitute rather than supplement
- Procurement lead times for specialist oilfield equipment, which will lengthen if workover demand simultaneously spikes across multiple Gulf producers
Structural risks that could derail even the moderate recovery scenario:
- Resumption of strikes on energy infrastructure following any ceasefire agreement
- Prolonged sanctions complications limiting Iran's access to technical services and financing
- Reservoir degradation in low-pressure fields advancing beyond economically viable recovery thresholds
- LNG facility reconstruction requirements absorbing engineering and procurement capacity that would otherwise support oil field restarts
The Core Analytical Mistake to Avoid
The Strait of Hormuz oil production recovery is not a binary event that will be resolved by a political agreement or a ceremonial first tanker passage. It is a multi-layered operational, technical, and commercial process that will unfold unevenly across producers, asset types, and market segments over an extended period measured in quarters and potentially years. The geopolitical oil price factors at play here extend well beyond the immediate conflict, shaping how rapidly any normalisation can take hold.
Markets that price in a smooth, rapid normalisation based on political headlines risk being structurally wrong about both the timeline and the ultimate destination. Goldman Sachs' own analysis, while relatively constructive on the near-term recovery trajectory for Saudi Arabia and the UAE, explicitly acknowledges that a full return to pre-war production levels across the Gulf could take multiple quarters and may prove permanently incomplete in some cases.
The more analytically rigorous approach treats recovery as a probabilistic distribution with a wide range of outcomes rather than a single consensus timeline. The upside scenario — a 70–88% recovery within three to six months — is achievable but contingent on a chain of conditions, each of which introduces independent failure risk. The downside scenario of capacity scarring and multi-year normalisation is described as unlikely by Goldman Sachs but historically documented across several prior supply shocks of lesser scale.
Given that the current disruption is explicitly characterised as unprecedented in its magnitude, applying historical recovery probabilities without upward adjustment for the greater complexity involved may represent a systematic underestimation of tail risk. This oil price shock has reinforced the importance of modelling the full range of scenarios rather than anchoring to a single central case. Investors and energy analysts positioning around Gulf recovery timelines would consequently be well served by stress-testing their assumptions across the complete distribution of possible outcomes, not just the consensus view.
This article draws on reporting from ET EnergyWorld and Goldman Sachs research coverage as published on April 25, 2026. The content contains forward-looking projections and scenario analysis that involve significant uncertainty. This article does not constitute financial or investment advice. Readers should conduct independent research and consult qualified financial advisors before making investment decisions based on energy market developments.
Want to Stay Ahead of Major Commodity Discoveries Driven by Energy Market Shifts?
Discovery Alert's proprietary Discovery IQ model delivers real-time alerts on significant ASX mineral discoveries — cutting through market noise to surface actionable opportunities the moment they are announced, including those across energy-adjacent commodities affected by supply disruptions like the current Gulf crisis. Explore how historic discoveries have generated substantial returns on Discovery Alert's dedicated discoveries page, and begin your 14-day free trial today to position yourself ahead of the broader market.