
July 5, 2026
The global energy system's vulnerability to critical chokepoint disruptions poses significant challenges for economic stability worldwide. When major shipping lanes face potential closure, the resulting Strait of Hormuz oil supply disruption creates cascading effects that extend far beyond immediate price fluctuations, fundamentally altering market dynamics and energy security calculations across multiple sectors and regions.
Understanding these vulnerabilities requires examining both the physical infrastructure constraints and the psychological market forces that amplify initial disruptions into systemic challenges affecting energy security insights worldwide.
Critical Infrastructure Dependencies in Global Energy Transport
The world's energy infrastructure relies heavily on a limited number of strategic maritime corridors, with certain passages handling disproportionate volumes of global petroleum trade. These geographical constraints create fundamental vulnerabilities that extend beyond simple supply and demand calculations.
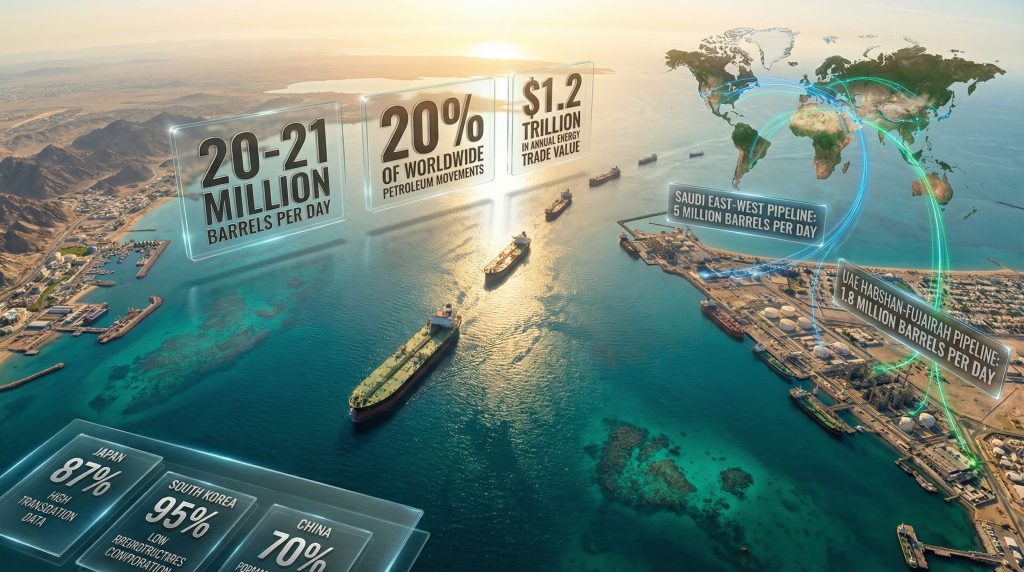
The most significant chokepoint handles approximately 20-21 million barrels per day of crude oil and condensate transit, representing roughly 20-21% of globally traded petroleum liquids according to the U.S. Energy Information Administration. This concentration creates systemic risk where relatively small disruptions can generate outsized market impacts.
Key Strategic Chokepoint Characteristics:
- Narrow navigational channels limiting vessel maneuverability
- High traffic density creating scheduling dependencies
- Limited alternative routing options
- Concentrated regional export infrastructure
The geographic reality of a 21-nautical-mile width at the narrowest point forces all supertankers through designated traffic lanes separated by minimal buffer zones. This constraint means that vessels operating near maximum draft limitations face reduced operational flexibility during emergency situations.
Infrastructure Vulnerability Assessment
Beyond physical geography, the supporting infrastructure creates additional risk layers. Export terminals, loading facilities, and port management systems represent potential failure points that can amplify disruption impacts even when shipping channels remain physically accessible.
Historical precedent demonstrates these vulnerabilities. During the Iran-Iraq War tanker conflict phase (1980-1988), over 500 vessels were attacked, with insurance premiums spiking to 20-50% of cargo value according to U.S. Navy Historical Center records. This pattern illustrates how perceived threats can create economic disruption even without complete passage closure.
When big ASX news breaks, our subscribers know first
Market Response Mechanisms During Supply Disruption Events
Financial markets exhibit distinct behavioural patterns when Strait of Hormuz oil supply disruption scenarios emerge. These responses operate through multiple interconnected mechanisms that compound initial price pressures, particularly when combined with broader geopolitical tensions such as US‑China trade tensions.
Primary Market Reaction Phases:
- Immediate Response (minutes to hours): Futures curve adjustments and volatility index expansion
- Secondary Response (hours to days): Cash market repricing with widening bid-ask spreads
- Tertiary Response (days to weeks): Inventory management decisions and refinery utilisation adjustments
Historical data reveals consistent patterns in risk premium incorporation. The 2011 Libya Crisis generated $10-15 per barrel risk premiums when 1.6 million barrels per day of production was disrupted. The 2022 Russia-Ukraine conflict saw WTI crude spike to approximately $130 per barrel, representing roughly $60-70 per barrel in risk premium over baseline expectations.
Currency and Economic Transmission Effects
Strait of Hormuz oil supply disruption impacts extend beyond energy markets into currency valuations and broader economic metrics. Oil-importing nations typically experience currency weakness during price spikes due to several interconnected factors.
Current account deficit expansion from higher import costs becomes particularly pronounced when combined with tariffs and market impact effects. Furthermore, capital flight toward safe-haven currencies during uncertainty creates additional pressure on emerging market economies.
Central bank intervention necessity to stabilise domestic markets often coincides with monetary policy complications from imported inflation pressures. The Federal Reserve's research on commodity-currency correlations shows historical correlation coefficients of 0.65-0.75 between energy price volatility and equity market turbulence during major supply disruption events.
Alternative Transportation Routes and Capacity Analysis
When primary shipping routes face disruption, global energy flows must redirect through alternative pathways with significantly different cost structures and capacity limitations. Understanding these alternatives reveals the true scope of potential supply constraints during a Strait of Hormuz oil supply disruption.
Major Pipeline Bypass Infrastructure:
| Pipeline System | Verified Capacity | Operational Status | Geographic Limitations |
|---|---|---|---|
| Saudi East-West | 5.0 million bbl/day | Fully operational | Saudi crude only |
| UAE Habshan-Fujairah | 1.5 million bbl/day | Active | Limited regional access |
| Iraq-Turkey Northern | 0.6-1.6 million bbl/day | Security-dependent | Cross-border vulnerabilities |
| Iran Goreh-Jask | 0.3 million bbl/day | Sanctions-restricted | Minimal throughput |
Combined pipeline bypass capacity reaches approximately 8.3-8.7 million barrels per day maximum, covering roughly 40% of normal transit flows through the primary chokepoint. Consequently, this leaves a significant 11-13 million barrels per day gap that cannot be absorbed through existing infrastructure during full closure scenarios.
Maritime Rerouting Economics
Alternative shipping routes require substantial additional resources and time commitments. The Cape of Good Hope routing adds 6,000-8,000 nautical miles to standard transit paths, increasing voyage duration by 14-16 days according to World Maritime News routing analysis.
Transportation Cost Implications:
- Additional fuel consumption: $2-4 per barrel
- Extended charter periods: 200-500% rate increases during crisis
- Insurance premium escalation: From 0.05% to 1-2% of cargo value
- Vessel availability constraints limiting capacity utilisation
These economic realities demonstrate why pipeline alternatives cannot fully compensate for maritime disruptions, particularly when global spare production capacity is limited to 2-3 million barrels per day maximum from primarily Saudi Arabian sources, as detailed in OPEC production impact analyses.
Regional Vulnerability Mapping and Strategic Reserve Analysis
Different regions exhibit varying degrees of exposure to Strait of Hormuz oil supply disruption based on import dependency, sourcing patterns, and strategic reserve capacity. This variation creates uneven global impacts during crisis periods.
Regional Vulnerability Assessment:
| Region | Import Dependency | Middle East Share | Strategic Reserve Days | Risk Classification |
|---|---|---|---|---|
| Northeast Asia | 85-95% | 75-85% | 90-180 | Critical |
| Europe | 60-70% | 25-30% | 90-120 | Moderate |
| North America | 15-20% | 10-15% | 180+ | Limited |
| Emerging Asia | 70-85% | 60-70% | 30-90 | High |
Japan and South Korea face the highest vulnerability levels due to extreme import dependency (87-95%) combined with concentrated Middle Eastern sourcing (80%+). These economies lack domestic production alternatives and depend on energy-intensive manufacturing requiring consistent supply availability.
Strategic Reserve Deployment Capabilities
Global strategic petroleum reserves provide temporary supply buffers during disruption events, though their effectiveness depends on coordination and scale of deployment. However, the reserves must be carefully managed considering broader geopolitical implications.
Major Strategic Reserve Systems:
- U.S. Strategic Petroleum Reserve: 714 million barrels maximum capacity
- IEA Member Collective: Approximately 1.5 billion barrels across OECD nations
- Japan JOGMEC: 324 million barrels verified capacity
- China Strategic Reserves: Estimated 500+ million barrels (unofficial)
Historical deployment analysis reveals varying effectiveness levels. The 2011 Libya Crisis response involved 60 million barrel releases providing 3-month price stabilisation. In addition, the 2022 coordinated release of 240 million barrels over six months demonstrated larger-scale intervention capability.
Geopolitical Escalation Pathways and Conflict Scenarios
Understanding how regional tensions escalate into supply disruption events requires examining both military capabilities and diplomatic pressure points that can transform localised conflicts into global energy crises. These dynamics often intersect with broader policy changes, including considerations around Venezuela oil policy adjustments.
Military Engagement Escalation Mechanisms:
- Naval mine deployment in critical shipping channels
- Anti-ship missile threats targeting commercial vessels
- Infrastructure attacks on loading terminals and pipelines
- Cyber warfare against port management systems
Asymmetric Threat Capabilities:
- Small boat swarm attacks against large tankers
- Coastal missile battery positioning
- Drone surveillance and coordinated strike potential
- Proxy group activation in multiple geographic areas
These scenarios demonstrate how relatively modest military assets can generate disproportionate economic impacts by threatening critical infrastructure or creating insurance and routing challenges for commercial shipping operations.
Diplomatic Intervention and Coalition Responses
International response mechanisms play crucial roles in determining disruption duration and severity. Historical patterns show that coordinated diplomatic pressure and naval security provision can significantly reduce crisis duration.
Key Response Frameworks:
- International coalition formation for passage security
- United Nations maritime intervention protocols
- Sanctions enforcement coordination challenges
- Regional alliance strain management between affected parties
The effectiveness of these mechanisms depends heavily on great power cooperation and the willingness of naval forces to provide convoy protection or maintain freedom of navigation operations in contested areas, as highlighted in recent analysis of regional security dynamics.
Secondary Economic Impacts Across Industrial Sectors
Strait of Hormuz oil supply disruption effects cascade through interconnected industrial networks, creating supply chain disruptions that extend far beyond energy markets themselves. Furthermore, these impacts often coincide with other global economic pressures affecting trade patterns.
Petrochemical Manufacturing Vulnerabilities
The petrochemical sector experiences immediate feedstock cost pressures during energy price spikes. Historical data shows 40-60% feedstock cost increases during major disruptions, leading to several interconnected challenges.
Production curtailments in ethylene, propylene, and aromatics create ripple effects throughout manufacturing sectors. Moreover, global plastic and synthetic material price inflation affects consumer goods pricing worldwide. Supply chain delays affecting automotive and consumer goods compound these pressures, while regional refinery margin compression limits industry adaptation capacity.
Transportation Industry Transmission Effects
Multiple transportation segments face simultaneous pressure during energy supply disruptions, creating compound effects across logistics networks.
Commercial Aviation:
- Jet fuel price volatility exceeding crude oil movements
- Route optimisation to reduce fuel consumption
- Passenger fare adjustments reflecting higher operating costs
Maritime Shipping:
- Bunker fuel cost escalation affecting global trade
- Container shipping rate adjustments
- Supply chain timing disruptions from vessel rerouting
Ground Transportation:
- Diesel fuel price transmission to freight costs
- Consumer gasoline price impacts on discretionary spending
- Electric vehicle adoption acceleration during sustained high prices
Agricultural Sector Dependencies
Agriculture faces dual exposure through both energy costs and fertiliser production disruptions. Natural gas-dependent fertiliser manufacturing experiences significant cost pressures during energy crises, while farm operations face direct diesel fuel cost increases.
These pressures affect planting and harvesting operational costs whilst simultaneously increasing transportation expenses for agricultural products. Consequently, food price inflation through energy cost transmission creates regional food security concerns in import-dependent areas.
The next major ASX story will hit our subscribers first
Insurance Markets and Maritime Risk Assessment
The marine insurance industry provides critical early warning signals for escalating supply disruption risks through premium adjustments and coverage availability decisions. These market signals often precede broader recognition of emerging threats.
War Risk Insurance Premium Escalation:
| Risk Level | Premium Range | Market Conditions |
|---|---|---|
| Normal Operations | 0.05-0.1% of cargo value | Routine coverage |
| Elevated Tension | 0.5-1.0% of cargo value | Selective underwriting |
| Active Conflict | 2.0-5.0% of cargo value | Coverage denial risk |
These premium adjustments reflect insurers' real-time risk assessment and often precede broader market recognition of escalating threats. Lloyd's of London P&I Club historical data demonstrates how insurance costs can multiply by 10-50 times during active conflict periods.
Shipping Industry Operational Adjustments
Commercial shipping operators implement multiple risk mitigation strategies during heightened threat periods. However, these adjustments create additional cost pressures that compound the economic impacts of supply disruptions even when physical flows continue.
Flag state considerations for vessel protection under different national registrations become critical during crisis periods. Charter rate negotiations incorporating war risk premiums substantially increase transportation costs, whilst crew safety protocols including hazard pay and rotation policies add operational complexity.
Vessel routing optimisation balancing time and security considerations requires sophisticated logistics planning that may not be readily available during crisis periods.
Market Recovery Dynamics and Normalisation Timelines
Understanding how markets return to normal operations after supply disruptions reveals the long-term structural changes that emerge from crisis periods. These recovery patterns provide insights into planning for future disruption scenarios.
Recovery Phase Analysis:
- Immediate Response (Days 1-7): Emergency reserve activation and diplomatic intervention
- Short-term Adaptation (Weeks 2-8): Alternative routing establishment and inventory management
- Medium-term Adjustment (Months 3-12): Supply chain reconfiguration and contract renegotiation
- Long-term Stabilisation (Years 1-3): Infrastructure redundancy development and sourcing diversification
Historical examples demonstrate varying recovery timelines based on disruption severity and international response effectiveness. For instance, the 1990-1991 Gulf War required approximately 6-9 months for complete market normalisation, while the 2003 Iraq invasion saw 3-4 month recovery periods due to better international coordination.
Infrastructure Repair and Replacement Timelines
Physical infrastructure damage creates the longest recovery delays, with repair timelines varying significantly by facility type. These timelines assume adequate repair resources and stable security conditions, both of which may be compromised during extended conflict periods.
Infrastructure Restoration Periods:
- Port facility damage: 2-6 months depending on extent
- Pipeline infrastructure: 3-12 months for major damage
- Refinery complex repairs: 6-18 months for significant impacts
- Shipping channel clearance: 1-4 weeks for mine removal operations
Long-term Strategic Adaptations and Energy Security Enhancement
Major supply disruption events catalyse structural changes in global energy architecture that persist long after immediate crises resolve. These adaptations reflect lessons learned about supply chain vulnerabilities and the costs of geographic concentration.
Infrastructure Diversification Investments
Post-crisis periods typically see accelerated investment in alternative transportation infrastructure designed to reduce dependency on critical chokepoints. Capital expenditure requirements for meaningful bypass capacity expansion are estimated at $40-60 billion globally, with lead times of 5-10 years for major projects.
Pipeline capacity expansion to reduce maritime dependency becomes a priority for energy-importing nations. Strategic storage facility development in consuming regions provides additional buffer capacity, whilst port infrastructure enhancement outside traditional chokepoint areas creates routing alternatives.
Alternative energy transition acceleration to reduce petroleum dependency gains momentum during crisis periods when supply vulnerabilities become apparent to policymakers and consumers.
Supply Chain Reconfiguration Trends
Energy importing nations implement systematic sourcing diversification following major disruption events. These changes create permanent shifts in global trade patterns that persist even after geopolitical tensions subside.
Diversification Strategies:
- Increased Western Hemisphere production investment
- Strategic partnership development with non-OPEC suppliers
- Regional refining capacity expansion to reduce refined product imports
- Enhanced bilateral energy cooperation agreements
Risk Management and Crisis Preparedness Frameworks
Effective preparation for Strait of Hormuz oil supply disruption scenarios requires coordinated planning across multiple stakeholders and time horizons. These frameworks must account for both immediate response capabilities and long-term vulnerability reduction strategies.
Corporate Risk Management Strategies
Energy-dependent industries implement various hedging and contingency planning mechanisms to mitigate exposure to supply disruptions. Financial hedging through futures and options contracts provides short-term price protection, whilst supply diversification across multiple geographic sources reduces dependency risks.
Inventory optimisation balancing storage costs against supply security requires sophisticated planning models. Moreover, alternative energy integration reducing petroleum dependency over time creates long-term resilience against price volatility.
National Energy Security Policies
Government-level preparedness involves both immediate response capabilities and long-term vulnerability reduction through comprehensive policy frameworks. Strategic reserve sizing and deployment protocols must be regularly updated based on changing threat assessments and supply patterns.
Policy Framework Components:
- International cooperation agreements for crisis response
- Domestic production incentives and capacity maintenance
- Infrastructure protection and redundancy requirements
- Regular simulation exercises testing coordination mechanisms
The effectiveness of these frameworks depends heavily on advance planning and regular testing through simulation exercises that reveal coordination challenges before actual crises occur.
Understanding the complex dynamics surrounding critical energy chokepoints enables better preparation for potential disruptions while highlighting the fundamental importance of infrastructure diversification and international cooperation in maintaining global energy security. The interconnected nature of modern energy systems means that localised disruptions can create worldwide impacts, making comprehensive risk assessment and mitigation strategies essential for economic stability.
Future energy security will increasingly depend on reducing single-point-of-failure vulnerabilities through technological innovation, infrastructure redundancy, and diplomatic engagement that prevents conflicts from escalating into supply disruption scenarios that destabilise global markets for extended periods.
Looking to Capitalise on Energy Market Volatility?
Discovery Alert's proprietary Discovery IQ model delivers real-time alerts on significant energy and critical mineral discoveries across ASX-listed companies, empowering investors to identify actionable opportunities during periods of heightened market uncertainty. When global energy security concerns create market volatility, strategic mineral discoveries often present exceptional investment potential for those positioned ahead of the broader market.