August 21, 2026
When Chokepoints Become Crisis Points: Understanding the 2026 Hormuz Shock
Every few decades, a single geographic feature becomes the axis around which the entire global energy system pivots. In 1973, it was the Arab oil embargo routes through the Mediterranean. In 1990, it was Kuwait's oil fields. In 2026, it is a narrow corridor of water barely 21 nautical miles across at its tightest point, connecting the Persian Gulf to the Gulf of Oman. The Strait of Hormuz oil supply disruption now unfolding is not simply a regional shipping problem. It is a structural fracture in the architecture of global energy supply, and its consequences are rippling into fuel prices, import bills, freight markets, and downstream industries across five continents.
Understanding why this crisis is categorically different from previous supply shocks requires stepping back from the daily price moves and examining the deeper mechanics of what makes Hormuz irreplaceable, what triggered the breakdown, and what the physical shipping data actually reveals about how severe the disruption has become. For broader context on crude oil volatility, our crude oil volatility guide offers a useful framework.
When big ASX news breaks, our subscribers know first
Why No Other Waterway Compares to the Strait of Hormuz
The Mathematics of Dependency
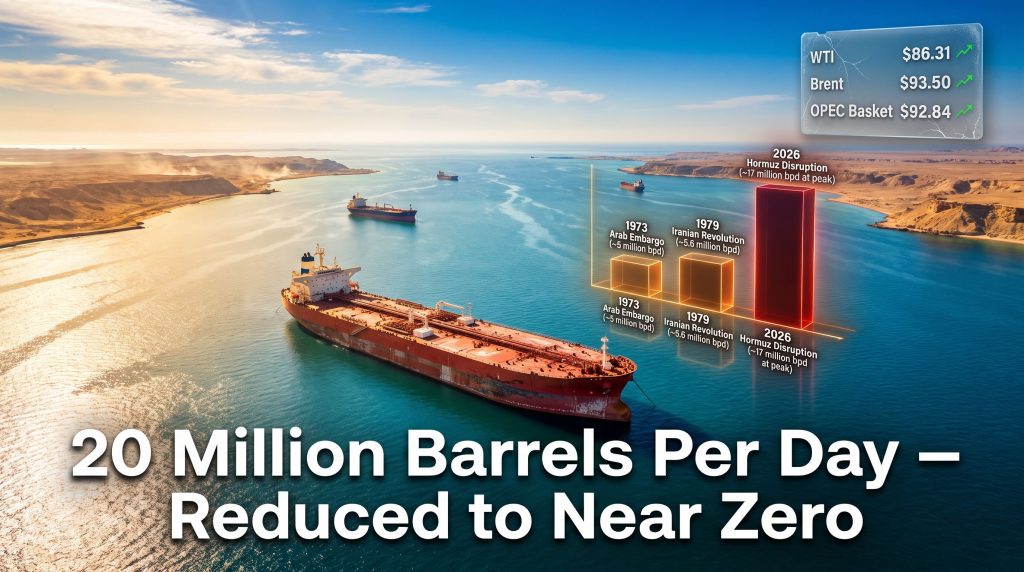
Before the current crisis, approximately 20 million barrels per day (bpd) of crude oil and petroleum products transited the Strait of Hormuz, according to the International Energy Agency. That figure represents roughly one-fifth of total global oil consumption moving through a single maritime corridor.
The nations dependent on this route read like a who's who of global energy production:
- Saudi Arabia relies on Hormuz for the majority of its seaborne crude exports
- Iraq has virtually no alternative export path for its southern oil fields
- Kuwait, the UAE, and Bahrain face similar structural dependencies
- Qatar routes approximately 20% of global LNG supply through the strait, making Hormuz not just an oil chokepoint but a natural gas chokepoint of enormous consequence
- Iran itself depends on the strait for its own export revenues, creating a strategic paradox at the heart of the current standoff
How Hormuz Stacks Up Against Other Global Chokepoints
| Chokepoint | Approximate Daily Volume | Primary Function |
|---|---|---|
| Strait of Hormuz | ~20 million bpd | Gulf crude and LNG exports |
| Strait of Malacca | ~16 million bpd | Asian import transit route |
| Suez Canal / SUMED | ~9 million bpd | North Africa and re-routing flows |
| Bab el-Mandeb | ~8 million bpd | Red Sea corridor to Europe |
| Turkish Straits | ~3 million bpd | Russian Caspian exports |
Critical Perspective: What makes Hormuz categorically different from every other chokepoint is the concentration of export-origin supply, not just transit volume. A disruption at Malacca delays oil from reaching buyers. A disruption at Hormuz prevents oil from leaving its source. That distinction has profound consequences for how quickly markets can adapt. The Brookings Institution's analysis of the strait provides further depth on this structural vulnerability.
The Sequence of Events That Produced the Strait of Hormuz Oil Supply Disruption
A Diplomatic Architecture That Collapsed Layer by Layer
The current Strait of Hormuz oil supply disruption did not emerge from a single dramatic incident. It developed through a sequential failure of every diplomatic and structural mechanism that had previously moderated risk in the Persian Gulf. Furthermore, understanding OPEC's market influence helps explain why collective producer responses have been slower than markets expected.
The critical timeline unfolded across a single week in mid-to-late August 2026:
| Date | Event | Market Effect |
|---|---|---|
| Late July | Interim ceasefire arrangement in effect | Prices elevated but contained |
| Monday, Aug 18 | Ceasefire expires without renewal | WTI gains more than $2 in a single session |
| Tuesday, Aug 19 | Washington confirms no diplomatic talks underway or scheduled | Uncertainty premium builds further |
| Wednesday, Aug 20 | UAE suspends all financial and economic ties with Iran following missile incidents near its coastline | Additional upward pressure; Brent approaches $93.50 |
| Thursday, Aug 21 | U.S. threatens economic consequences for nations providing Iran with financial lifelines | Largest single-day price move of the week |
Iran publicly indicated the strait would remain under restriction until Washington satisfied conditions tied to the lapsed interim agreement. With no talks scheduled and the ceasefire formally dead, the market concluded it was looking at an open-ended disruption rather than a temporary spike.
Treasury Secretary Scott Bessent signalled that a formal announcement of expanded sanctions actions against Iran was forthcoming, shifting market attention from military risk to economic escalation as the primary driver of the premium.
How Bad Is the Physical Disruption? The Shipping Data Tells a Stark Story
From 20 Million Barrels Per Day to Near-Standstill Conditions
At the peak of the disruption in the March to May 2026 period, transit volumes collapsed from approximately 20 million bpd to roughly 2.7 million bpd, a reduction exceeding 86% of normal throughput. This is not a statistic that fits comfortably into any prior framework for energy market disruption.
Shipping intelligence firm Kpler recorded as few as five commodity vessels transiting the strait on a Saturday during the crisis period, with zero vessels recorded the following Sunday. By mid-week, daily counts had recovered only to six ships, down from nine the prior day. Under normal peacetime conditions, dozens of tankers would pass through daily.
Operational Reality for Refiners: Refineries do not simply need oil. They need oil that can be insured, scheduled, and delivered on a predictable timeline. Even a strait that is technically open but operationally dangerous forces purchasing managers to seek alternative supply, absorb spot premiums, or reduce processing run rates. The practical market disruption from a partially restricted Hormuz is nearly equivalent to a fully closed one.
One particularly significant but underreported dimension of the crisis is the emergence of what analysts have described as a shadow oil highway running approximately 4 million bpd through a combination of untracked vessel movements and alternative corridor utilisation. However, this creates a different kind of market problem: the physical market becomes extremely difficult to read. Traders and refiners cannot easily determine how much crude is actually reaching processing facilities through these opaque channels, which sustains the geopolitical risk premium even when visible supply disruption appears to ease.
Oil Price Response: Structural Premium, Not Panic
How WTI and Brent Have Moved Through the Crisis
October WTI crude oil futures reached $86.31 late Thursday of the week in question, representing a weekly gain of $4.82, or approximately 5.91%. The contract's weekly range extended from a low of $80.80 to a high of $87.69, reflecting sustained directional buying rather than the volatile spike-and-retreat pattern typically associated with panic-driven supply fear.
Brent crude surpassed $93.50 during the week. The OPEC Basket traded near $92.84. Murban crude, the UAE benchmark that has gained strategic relevance as an alternative routing reference for barrels that can bypass the strait, climbed to a four-month high, pricing in the scarcity premium for Gulf barrels with accessible export routes.
The character of this rally is important. The gains built progressively across four trading sessions, with each escalation in the diplomatic and physical situation adding an incremental layer of premium. This pattern indicates market participants were pricing a sustained disruption, not betting on a short-term resolution. In addition, our trade and geopolitics analysis outlines how interconnected these forces have become.
The Bull and Bear Case in Structured Form
| Factor | Bullish Argument | Bearish Argument |
|---|---|---|
| Hormuz shipping data | Single-digit vessel counts; no recovery signal | Some vessels still transiting; not fully sealed |
| Diplomacy | No talks scheduled; ceasefire expired | Resolution remains theoretically possible |
| Alternative routing | Pipeline and transfer capacity falls well short of normal flows | Saudi Red Sea exports and Fujairah transfers are active |
| U.S. crude inventories | Distillate stocks falling for third straight week | Crude stocks rose 4.4 million barrels to 428.8 million barrels |
| Refinery utilisation | Running at 97.2%; product margins strong | High utilisation could signal approaching demand destruction |
| Sanctions trajectory | Escalating; Treasury action imminent | Further pressure could incentivise negotiation |
What the EIA Inventory Report Actually Tells Us in This Context
Why a Crude Build Did Not Break the Rally
The U.S. Energy Information Administration reported a crude inventory build of 4.4 million barrels, bringing total U.S. crude stocks to 428.8 million barrels. Under ordinary market conditions, a build of this magnitude would typically suppress prices by signalling adequate domestic supply. It did not.
The reason lies in the downstream picture. Distillate inventories, covering diesel and heating oil, declined for the third consecutive week, reflecting the product-level tightness created by disrupted Middle Eastern refined product flows. U.S. refinery utilisation reaching 97.2% confirms that domestic refiners are pushing operations toward their operational ceiling to capture elevated fuel margins.
Analyst Framework: In geopolitically disrupted markets, product inventory signals frequently override crude stock movements as the more accurate indicator of underlying supply stress. Diesel and jet fuel tightness tends to drive sustained price premiums during Middle East supply events more reliably than crude headline numbers. This is the pattern playing out now.
One lesser-known dimension worth understanding: refinery utilisation at 97.2% leaves almost no spare processing capacity as a buffer. Consequently, if a domestic refinery event, seasonal demand shift, or incremental supply reduction occurs simultaneously, the downstream market has virtually no slack to absorb the additional pressure.
The next major ASX story will hit our subscribers first
Alternative Routes and Their Limits: A Capacity Gap Analysis
What Gulf Producers Are Doing to Keep Barrels Moving
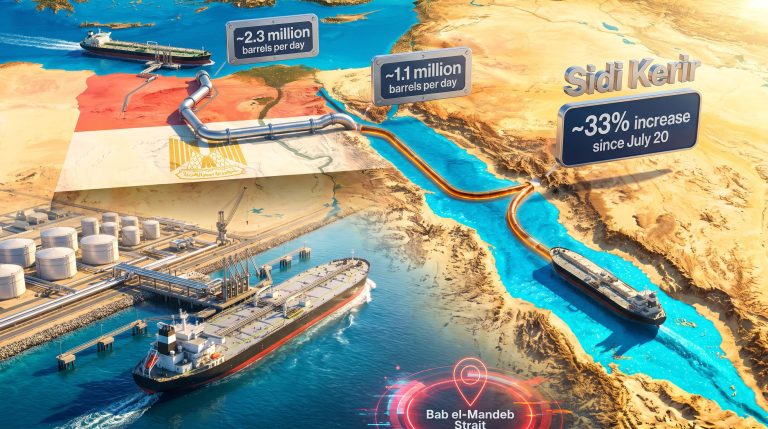
Saudi Aramco resumed tanker loadings from within the strait while simultaneously offering cargo transfers at Fujairah, the UAE's east coast oil hub situated outside the Persian Gulf. This allows buyers to receive Gulf barrels without routing vessels through the restricted corridor. Saudi Arabia also increased utilisation of its East-West Pipeline, which moves crude from the Eastern Province to the Red Sea port of Yanbu.
Chinese national oil companies began collecting crude at offshore transfer points outside the Gulf rather than routing tankers directly through the strait, reducing interdiction risk while maintaining some supply continuity. Iraqi crude collected outside normal Gulf routing channels has become a preferred alternative for several Asian refiners.
| Alternative Route | Estimated Capacity | Gap vs. Normal Hormuz Volume |
|---|---|---|
| Saudi East-West Pipeline (Yanbu) | ~5 million bpd | Covers approximately 25% of normal flows |
| Fujairah offshore transfers | ~2 to 3 million bpd | Partial and operationally complex |
| Iraq-Turkey (Kirkuk-Ceyhan) Pipeline | ~0.4 million bpd | Minimal contribution |
| Shadow and untracked vessel flows | ~4 million bpd (estimated) | Opaque; insurance and tracking gaps |
| Total Alternative Capacity | ~11 to 12 million bpd | ~40 to 45% shortfall vs. 20 million bpd norm |
Even under the most optimistic assumptions about alternative routing, the structural gap remains enormous. This is why the coordinated release of 400 million barrels from International Energy Agency member strategic petroleum reserves, while meaningful as a short-term bridge mechanism, cannot resolve the underlying supply deficit if the disruption persists. The global LNG supply outlook further illustrates why Qatar's restricted exports compound this shortfall significantly.
Who Bears the Greatest Exposure? Asia's Acute Vulnerability
The Import Nations Facing the Largest Cost Pressures
Asian importers face by far the greatest structural exposure to the Strait of Hormuz oil supply disruption. Their combination of high dependence on Gulf crude and limited domestic production creates a vulnerability that has no near-term structural fix.
- China is the world's largest crude importer, with Chinese tankers documented turning back from the strait and refiners pivoting to Iraqi crude collected outside the Gulf
- Japan has seen import costs reach all-time highs, with elevated oil prices compounding yen weakness to create a dual-pressure scenario on the national energy import bill
- India is managing reduced access to Iranian crude due to sanctions alongside higher spot prices for Gulf alternatives, while also absorbing increased LPG costs that are driving a domestic shift toward piped natural gas
- Pakistan has seen power generation costs jump 38% as the country resorts to record spot LNG purchases to offset disrupted pipeline supply
- South Korea and Taiwan face structurally similar exposure with limited domestic alternatives
The cascade extends well beyond crude oil. Qatar's LNG exports, representing approximately 20% of global LNG supply, face the same transit constraints. Spot LNG prices across Asia and Europe have risen accordingly. Petrochemical feedstocks sourced from Gulf refineries are in tighter supply, affecting plastic and chemical production chains. Elevated diesel and natural-gas-derived fertiliser costs are beginning to filter into agricultural production cost structures.
Supertanker day rates on the Gulf-to-China route reached a record $510,000 per day, a figure that encapsulates the war-risk insurance premium, the scarcity of willing operators, and the extraordinary demand pressure being placed on every available vessel capable of navigating the region.
The Diesel Problem Nobody Is Talking About Loudly Enough
One of the most important but underappreciated dimensions of this crisis was articulated by commodities strategist Jeff Currie, who argued that the real stress in the current disruption is not crude oil at $91 per barrel for Brent but rather the diesel market, which in a prolonged full-disruption scenario could reach $170 per barrel equivalent in physical spot markets.
Diesel is the fuel of the real economy in a way crude oil is not. Trucks, freight trains, agricultural equipment, construction machinery, and maritime shipping all run on distillate fuels. When diesel supply tightens, the cost pressure is not absorbed by consumers at a petrol station. It propagates through supply chains as freight costs, food prices, and manufactured goods prices.
The three consecutive weeks of declining U.S. distillate inventories, combined with refinery utilisation already at 97.2%, suggests the product-level stress is not theoretical. It is already visible in the data. Furthermore, the oil market disruption risks associated with ongoing trade tensions add another layer of complexity to the downstream pricing picture.
Technical Price Levels That Will Define What Comes Next
Key WTI Thresholds for the Weeks Ahead
For traders and market observers tracking the technical structure of WTI crude oil futures, several price levels will serve as critical decision points:
- $88.07 is the July swing high. A sustained weekly close above this level would break the prevailing sequence of lower highs and formally shift the primary trend to bullish for the first time since the week ending June 19
- $91.27 represents the May swing top and the next meaningful resistance zone above $88.07
- $100.00 is the psychological round-number threshold that would signal a significant escalation in both market sentiment and policy response
- $82.05 to $79.20 is the primary retracement support zone, the initial downside target if WTI fails to hold above $88.07
- $73.10 is the downside swing bottom, a break of which would signal resumption of the longer-term downtrend
- $69.21 is the 52-week moving average, which has provided structural support since late February 2026
Scenario Matrix: Price Pathways Based on Hormuz Developments
| Scenario | Trigger Condition | WTI Price Target Range |
|---|---|---|
| Full diplomatic resolution | Talks resume; ceasefire restored | Rapid decline toward $73 to $79 |
| Partial reopening | Vessel counts recover to 50%+ of normal | Gradual pullback to $80 to $84 |
| Status quo maintained | No talks; restricted but stable | Consolidation at $85 to $92 |
| Escalation event | Military incident or expanded closure | Acceleration toward $100 and beyond |
| Prolonged full closure | Extended near-zero transit; no resolution | Potential spike well beyond $120 |
How This Crisis Compares to Every Prior Supply Shock in History
| Event | Year | Volume Disrupted | Peak Price Impact |
|---|---|---|---|
| Arab Oil Embargo | 1973 | ~5 million bpd | Prices quadrupled |
| Iranian Revolution | 1979 | ~5.6 million bpd | Prices roughly doubled |
| Gulf War (Kuwait invasion) | 1990 | ~4.3 million bpd | Prices briefly doubled |
| Libya Civil War | 2011 | ~1.6 million bpd | ~$20 per barrel premium |
| Russia-Ukraine sanctions | 2022 | ~2 to 3 million bpd | Brent reached $139 |
| 2026 Hormuz Disruption | 2026 | ~17 million bpd at peak | Prices above $100 per barrel |
Historical Context: The 2026 Hormuz disruption dwarfs every prior supply shock in volumetric terms. The 1973 Arab embargo, long considered the defining energy crisis of the modern era, disrupted approximately 5 million bpd. The current event has, at its worst moments, removed more than three times that volume from accessible global supply while simultaneously affecting LNG, petrochemical feedstocks, and downstream refined products in ways that purely crude-focused historical events did not. The EIA's latest energy data provides additional context for understanding the scale of this volumetric shift.
Frequently Asked Questions: Strait of Hormuz Oil Supply Disruption
What percentage of global oil supply passes through the Strait of Hormuz?
Approximately 20% of global oil consumption, or around 20 million barrels per day, transited the Strait of Hormuz under normal 2025 conditions according to the IEA. This makes it the single most consequential maritime energy chokepoint in the world by volume and by the concentration of export-origin supply.
Can alternative routes fully replace Hormuz if it remains restricted?
No. The combined capacity of Saudi Arabia's East-West Pipeline, Fujairah offshore transfers, the Iraq-Turkey pipeline, and estimated shadow tanker flows totals approximately 11 to 12 million bpd. This leaves a structural shortfall of 8 to 9 million bpd relative to normal Hormuz volumes, a gap that cannot be bridged by infrastructure currently in existence.
Why did a large U.S. crude inventory build fail to suppress oil prices?
The crude build of 4.4 million barrels would typically be bearish. However, distillate inventories (diesel and heating oil) declined for a third consecutive week, and refinery utilisation reached 97.2%. The product market remained tight even as crude stocks rose, and traders correctly identified distillate tightness as the more meaningful signal in a disruption environment.
How high could oil prices go in a prolonged disruption scenario?
Based on the current technical structure, the immediate resistance levels are $91.27 and the psychological $100.00 threshold. In a prolonged full-closure scenario, analyst scenario modelling suggests WTI could extend well beyond $120 per barrel, with distillate and diesel markets experiencing even more extreme pricing stress. These are speculative projections based on current market dynamics and do not constitute investment advice.
Which countries are most vulnerable to the Strait of Hormuz oil supply disruption?
Asian importers carry the greatest structural exposure. China, Japan, India, South Korea, Taiwan, and Pakistan face the most acute combination of Gulf crude dependence and limited domestic production alternatives. European nations are secondarily exposed through LNG market tightness and refined product shortages rippling through global supply chains.
This article is intended for informational purposes only and does not constitute financial, investment, or trading advice. Oil market forecasts, price targets, and scenario projections involve significant uncertainty and are subject to rapid change based on geopolitical, diplomatic, and physical supply developments. Readers should conduct their own research and consult qualified financial professionals before making investment decisions.
Want to Know Which ASX Mining Stocks Could Benefit From the Energy Crisis?
The 2026 Hormuz disruption is reshaping commodity markets at a speed that rewards investors who act on real-time intelligence — Discovery Alert's proprietary Discovery IQ model scans ASX announcements daily, instantly identifying significant mineral discoveries across more than 30 commodities and turning complex market data into clear, actionable opportunities. Explore how major discoveries have historically delivered substantial returns on Discovery Alert's dedicated discoveries page, and begin your 14-day free trial today to position yourself ahead of the broader market.