
June 13, 2026
When the World's Most Important Waterway Becomes a Chokepoint
Every major oil supply shock in modern history has originated from a production-side failure. Wells shut down, fields were embargoed, or upstream infrastructure was destroyed. The mechanics of those crises were painful but comprehensible: one country or bloc removed its output from global supply, and the market scrambled to redistribute what remained. What the global energy system is now confronting with the Strait of Hormuz oil supply disruption is fundamentally different in structure, scale, and cascading consequence.
A transit-side disruption at the Strait of Hormuz does not remove one country's production from the market. It simultaneously blockades every Gulf producer's export capacity, cuts off refinery feedstocks for Asian industrial economies, and severs LNG supply lines serving power grids from Tokyo to Mumbai. The chokepoint multiplier effect is unlike anything the market has previously priced, and understanding oil's role in the global economy helps contextualise just how far-reaching these effects can be.
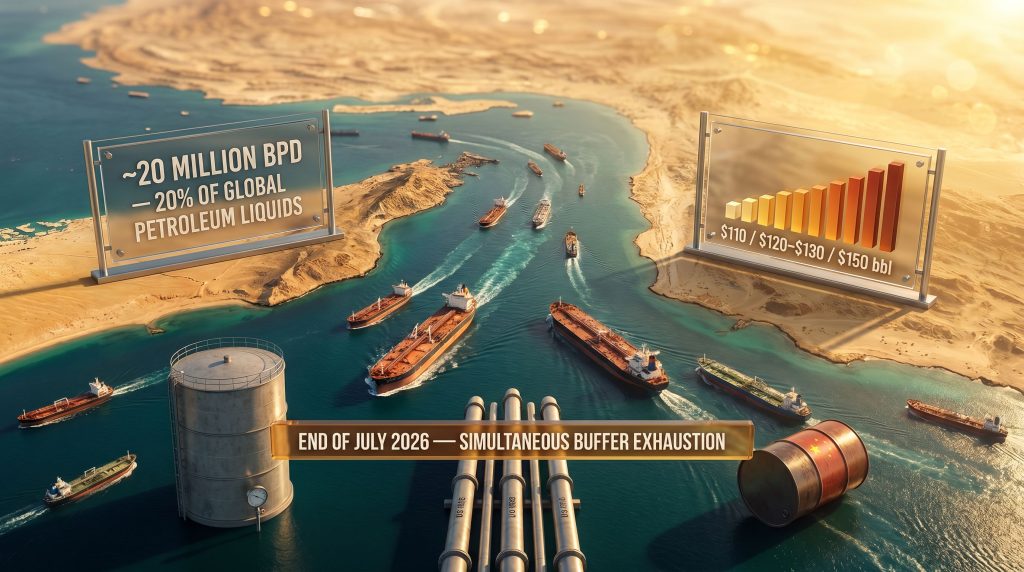
Approximately 20 million barrels per day (bpd) transited the strait in 2024, representing roughly 20% of global petroleum liquids consumption. The navigable channel measures approximately 21 miles at its narrowest point, a geographic constraint that gives an extraordinary amount of leverage to any actor capable of denying access. Bloomberg modelling has estimated net flow reductions of approximately 11 million bpd even after partial mitigation efforts are factored in, with the gross supply removed from accessible markets reaching approximately 13 million bpd.
No existing pipeline infrastructure can bridge that gap. The arithmetic is unambiguous.
When big ASX news breaks, our subscribers know first
Why This Disruption Is Structurally Distinct From Every Prior Oil Shock
Comparing the current Strait of Hormuz oil supply disruption to historical supply shocks requires distinguishing between the mechanics of production interruption and transit interruption. The 1973 Arab Oil Embargo, the 1979 Iranian Revolution, and the 1990 Gulf War all removed specific production volumes from global supply. Buyers could, at significant cost, source from alternative producers.
A Hormuz closure functions differently. It does not remove one country's barrels; it removes the delivery pathway for multiple producers simultaneously. Saudi Arabia, the UAE, Kuwait, Iraq, and Qatar all route the majority of their export volumes through the strait. Even a producer with untouched infrastructure and willing buyers cannot fulfil contracts if the transit corridor is inaccessible.
This distinction matters enormously for price modelling. Historical shock analysis tends to underestimate Hormuz disruption severity because it anchors to production-side precedents. The real comparison is not to any prior oil crisis but to a scenario where the Panama Canal, the Suez Canal, and the Strait of Malacca were all blocked simultaneously. Furthermore, the broader geopolitical risk landscape adds additional layers of complexity to what markets must now price in.
The Geography of Vulnerability
The table below illustrates how differently positioned economies face the consequences of constrained Hormuz access:
| Region | Primary Exposure | Secondary Risk | Estimated Timeline to Shortage |
|---|---|---|---|
| Asia (Japan, South Korea, India) | Immediate crude shortfall | Refinery run-rate cuts | Days to weeks |
| Europe | Diesel and refined product scarcity | Industrial slowdown | 2 to 4 weeks |
| United States | Indirect price pressure | Inflation pass-through | 4 to 6 weeks |
| Emerging Markets | Currency and import cost squeeze | Fiscal stress | Weeks to months |
Asian economies face the most acute and immediate exposure. Japan and South Korea are structurally reliant on Middle Eastern crude with limited diversification alternatives at scale. India, despite its growing domestic production base, imports a substantial portion of its crude requirements from Gulf producers. The Trans Mountain Pipeline reaching full capacity in Canada has increased Pacific-facing supply options, but volumes are insufficient to replace Gulf supply at the scale required.
The Three Buffers Holding the Market Together
Despite what analysts have described as the worst oil supply disruption in recorded history, Brent Crude prices have remained below $100 per barrel for most of the period since the closure began. Understanding why requires examining the three structural buffers that have absorbed the supply shock.
Buffer One: China's Demand Suppression
China's crude imports in May 2026 fell to their lowest level since October 2017, according to reporting by Oilprice.com. Rather than paying elevated spot prices, Beijing chose to draw down strategic and commercial stockpiles, restrict refinery throughput, limit refined product exports, and benefit from accelerating EV adoption reducing road transportation fuel demand.
This is a multi-layered demand management approach that reflects rational economic behaviour under price stress, but it has physical limits. Inventory drawdowns cannot continue indefinitely. Reduced refinery output creates downstream industrial pressure. The question analysts are focused on is not whether China will re-enter the active spot market, but when. Current modelling suggests the tolerance window is measured in weeks, not months.
Buffer Two: Record U.S. Export Volumes
American crude and fuel exports have been running approximately 1.8 million bpd above year-ago levels since the start of the disruption, according to ING Commodities Strategy analysis. This surge has helped redirect non-Gulf supply toward markets most affected by Hormuz constraints.
However, ING Head of Commodities Strategy Warren Patterson has noted that these elevated export volumes are being sourced from existing inventory drawdowns rather than incremental production growth. This creates a hard ceiling. Once domestic U.S. commercial inventories reach critical thresholds, the export surge becomes self-limiting, and there is a non-trivial risk that domestic supply tightness could prompt government pressure to restrict crude exports, which would simultaneously remove a key global market buffer.
U.S. crude and gasoline inventories have been declining even as SPR releases continue, signalling that underlying demand is absorbing supply faster than strategic interventions can compensate.
Buffer Three: Strategic Petroleum Reserve Releases
Coordinated SPR drawdowns across IEA member nations have provided the third layer of market insulation. In the United States, these releases are scheduled to conclude by end of July 2026. At that point, the policy tool that has been suppressing crude oil price volatility is removed from the equation precisely as summer demand peaks and the other two buffers approach exhaustion.
ING's Warren Patterson has described end of July as a potential inflection point for the oil market if no meaningful improvement in Persian Gulf energy flows materialises. The bank projects Brent Crude averaging $110 per barrel across Q3 2026 under its base case, with upside risk to $120 to $130 per barrel if all three buffers fail simultaneously. (Source: ING Think, June 2026)
The End-of-July Convergence: Why Timing Matters More Than Price Levels
What makes the current situation uniquely dangerous is not any single factor in isolation, but the convergence of multiple buffer exhaustion timelines within the same narrow window. The sequence looks like this:
- Now through mid-July: All three buffers absorbing the supply gap; prices elevated but contained below $100 per barrel
- Late July: U.S. SPR releases conclude; domestic inventory drawdowns approach critical thresholds; China's stock-draw tolerance window closes
- August (if unresolved): Triple convergence of buffer failure, peak summer demand, and continued Hormuz constraint creates the conditions for a non-linear price response
This is not a scenario of gradual price escalation. The simultaneous failure of multiple independent buffers produces a step-change dynamic where price discovers a new equilibrium rapidly rather than drifting higher. This distinction matters for both risk managers and policymakers.
The $120 to $130 per barrel range is identified by analysts as the threshold at which the political cost of inaction for the U.S. administration becomes greater than the diplomatic cost of a deal. At extreme price levels, a secondary scenario also becomes possible: buyers paying Iran directly for guaranteed safe transit, an arrangement that would represent a fundamental restructuring of Persian Gulf geopolitical norms and set a concerning precedent for maritime chokepoint economics globally.
Why Pipeline Alternatives Cannot Fill the Gap
Two bypass infrastructure options exist for Gulf producers seeking to route crude without transiting Hormuz:
- Saudi Arabia's East-West Pipeline (Petroline): Connects Eastern Province fields to the Red Sea port of Yanbu, with capacity of approximately 5 million bpd
- UAE's Abu Dhabi Crude Oil Pipeline (ADCOP): Routes crude to the Gulf of Oman port of Fujairah, bypassing Hormuz, with capacity of approximately 1.5 million bpd
Combined, these routes can handle roughly 6 to 7 million bpd at maximum throughput. Against a normal Hormuz transit volume of 20 million bpd, the structural gap exceeds 13 million bpd and cannot be bridged by any infrastructure combination currently in existence.
Additional complicating factors include destination and crude quality mismatches, operational constraints limiting which producers can access bypass routes, and the emergence of so-called dark mode tanker traffic, where vessels navigate through Hormuz with AIS transponders disabled. While this represents an attempt to maintain some flow continuity, it reduces market transparency, creates significant insurance and liability complications, and does not resolve the underlying supply gap.
Scenario Analysis: Brent Crude Price Trajectories
| Scenario | Condition | Brent Price Outlook | Risk Assessment |
|---|---|---|---|
| Base Case | Flows remain largely constrained through end of July | Average ~$110/bbl (Q3 2026) | Moderate probability |
| Upside Risk | Buffers exhausted; no diplomatic resolution by August | Spike to $120 to $130/bbl | Elevated if no deal materialises |
| Tail Risk | Prolonged closure, buffer failure, and seasonal demand surge | Potential breach of $150/bbl | Low probability, extreme consequence |
| Resolution Case | U.S.-Iran deal restores meaningful flow by early August | Trend lower through Q4 2026 and into 2027 | Contingent on diplomatic timeline |
Disclaimer: Price projections represent analyst estimates based on current scenario modelling and should not be interpreted as financial advice. Actual outcomes will depend on geopolitical developments, demand conditions, and policy decisions that remain highly uncertain.
The next major ASX story will hit our subscribers first
Inflation Transmission: From Crude Prices to Consumer Costs
Energy price shocks of this magnitude do not remain contained within energy markets. The transmission mechanism from crude price escalation to consumer-level economic impact follows a multi-stage pathway:
- Crude oil price escalation compresses or expands refinery margins depending on product demand
- Refined product prices increase, raising costs for road transport, aviation, and heating
- Petrochemical feedstock costs rise, pushing up prices for plastics, packaging, and consumer goods
- Fertiliser production costs increase through natural gas-derived ammonia price escalation, feeding into agricultural input costs and food prices
- Shipping war risk premiums escalate, broadening import price inflation across all trade categories
Historical precedent from the 1970s oil crises and the 2021 to 2022 energy shock demonstrates that crude price spikes sustained above $110 to $130 per barrel generate measurable second-round inflation effects across food, manufactured goods, and services within three to six months.
Country-level vulnerability varies significantly. India is already flagging fiscal stress from elevated oil import costs, with fuel sales caps introduced to manage domestic shortages and budget deficit targets under pressure. Japan has been tapping reserves while securing alternative LNG supply agreements, with the global LNG supply outlook now directly shaped by the disruption's scale. Emerging market importers more broadly face a compound vulnerability where currency depreciation amplifies already elevated import costs.
The Diplomatic Variable: Why U.S.-Iran Negotiations Are the Primary Price Lever
Every quantitative model of the current crisis ultimately reduces to a qualitative question: when, if ever, does a credible U.S.-Iran agreement restore meaningful Hormuz access?
A self-reinforcing feedback mechanism is now operating in the background. Higher oil prices generate greater U.S. domestic inflation pressure, which increases the political cost of stalemate for Washington, which strengthens the incentive to reach a deal, which would provide immediate price relief. The $120 to $130 per barrel threshold is where this feedback loop historically becomes politically irresistible. Oil market trade war risks are, however, adding further uncertainty to whether a diplomatic resolution can be reached swiftly.
Three non-diplomatic risk pathways also warrant monitoring:
- Toll payment scenario: Energy-importing nations paying Iran directly for guaranteed safe passage, which would create a precedent-setting and diplomatically destabilising arrangement
- Military escalation scenario: Further strikes on Iranian infrastructure amplifying near-term supply disruption
- Structural adaptation scenario: Markets forced to accept constrained Hormuz access as a new normal, triggering long-term investment in alternative infrastructure, non-Gulf supply diversification, and potentially accelerating energy transition timelines
Five Key Indicators for Monitoring Market Stress
Participants seeking to track the progression of this crisis in real time should focus on the following variables:
- U.S. SPR release completion date: The clearest hard deadline in the current market structure, with releases scheduled to conclude by end of July
- China's crude import volumes: A return to active spot purchasing signals buffer exhaustion and imminent demand-driven price pressure
- U.S. commercial crude inventory levels: Declining inventories independent of SPR drawdowns indicate the export surge is approaching its structural ceiling
- Hormuz tanker traffic data: Volume trends and AIS transponder activity provide the most direct window into actual flow conditions
- U.S.-Iran diplomatic signals: Any credible ceasefire or nuclear framework agreement would immediately and substantially reprice the Brent forward curve
For longer-term energy investors, the strategic question extends beyond the current disruption timeline. Non-Gulf producers including the United States, Canada, Norway, and Kazakhstan stand to benefit from sustained demand for supply diversification. LNG infrastructure investment is being reassessed globally as a partial substitute for pipeline gas with Gulf route dependencies. Strategic reserve adequacy is being recalibrated by governments across IEA and non-IEA nations alike.
Sustained crude prices above $110 per barrel also historically accelerate EV adoption rates and renewable energy investment, suggesting the current disruption may carry structural energy transition implications that outlast the physical blockage itself. According to the U.S. Energy Information Administration, the strait's role as a critical global chokepoint has been well documented, underscoring just how significant its sustained disruption truly is.
FAQ: Strait of Hormuz Oil Supply Disruption
How much oil flows through the Strait of Hormuz each day?
Approximately 20 million barrels per day transited the strait in 2024, representing roughly 20% of global petroleum liquids consumption. This makes it the single most consequential oil transit chokepoint in the world.
Why haven't oil prices already exceeded $100 per barrel despite the disruption?
Three simultaneous buffers have suppressed prices: China reduced crude imports to levels not seen since October 2017, the U.S. ramped exports approximately 1.8 million bpd above year-ago levels, and coordinated SPR releases provided additional supply relief. All three are now approaching exhaustion.
Can pipeline alternatives replace Hormuz oil flows?
No. Saudi Arabia's Petroline and the UAE's ADCOP pipeline together provide a maximum combined capacity of approximately 6 to 7 million bpd, far short of the 20 million bpd that normally transits Hormuz. The structural gap cannot be bridged by existing infrastructure.
What is dark mode tanker traffic?
Some Gulf producers have been routing tankers through the strait with AIS transponders disabled. This reduces market visibility into actual flow volumes and creates additional risk for commercial shipping and insurance markets without resolving the underlying supply constraint.
What would trigger oil prices to fall back below $100 per barrel?
The primary catalyst would be a credible U.S.-Iran diplomatic agreement restoring meaningful Hormuz traffic. ING projects that if such a resolution materialises, Brent prices would trend lower through Q4 2026 and into 2027 as Middle Eastern flows gradually recover.
Which economies face the most acute exposure?
Asian economies, particularly Japan, South Korea, and India, face the most immediate impact due to structural dependence on Gulf crude. Emerging market importers face a compound risk from both higher prices and currency depreciation amplifying import costs. The current Strait of Hormuz oil supply disruption consequently represents one of the most significant stress tests the global energy system has faced in the modern era.
Want to Stay Ahead of the Commodity Shifts Driving the Next Wave of ASX Discoveries?
When energy disruptions of this magnitude reshape global commodity markets, the knock-on effects for mineral exploration and ASX-listed resource stocks can be swift and substantial. Discovery Alert's proprietary Discovery IQ model scans ASX announcements in real time, delivering instant alerts on significant mineral discoveries across more than 30 commodities — visit the Discovery Alert discoveries page to see how historic finds have generated exceptional returns, and begin your 14-day free trial to ensure you're positioned before the broader market moves.