June 8, 2026
The Geography of Vulnerability: Why One Waterway Controls Global Energy Security
Few structural realities in global commodity markets are as stark as the dependence of modern civilisation on a single 33-kilometre-wide maritime passage. The Strait of Hormuz has long been acknowledged as the world's most consequential energy chokepoint, but abstract risk assessments rarely capture the full weight of what closure actually means until it happens. That moment arrived in early 2026, and the Strait of Hormuz oil supply disruption is now cascading through energy markets, industrial supply chains, and macroeconomic forecasts in ways that are redefining what an oil supply shock looks like in the modern era.
Understanding this crisis requires more than tracking crude prices. It demands a forensic examination of how global energy infrastructure was designed, where its single points of failure lie, and why decades of awareness about Hormuz dependency produced so little structural redundancy. Furthermore, geopolitical trade tensions between key nations have accelerated the fragility of these systems in ways that were previously underestimated.
When big ASX news breaks, our subscribers know first
Why the Strait of Hormuz Remains the World's Most Critical Oil Chokepoint
The Arithmetic of Dependency: What One Waterway Means for Global Supply
The numbers that define Hormuz's centrality to global energy are not in dispute. Under normal operating conditions, approximately 20 million barrels per day (b/d) transit this corridor, representing roughly 20% of total global oil supply and 25% of all seaborne oil trade. No other single piece of maritime infrastructure comes close to concentrating this volume in such a geographically constrained space.
The directional flow of that volume is equally significant. Around 80% of Persian Gulf oil exports are destined for Asian economies, including China, India, Japan, and South Korea. These nations have limited ability to rapidly diversify sourcing at scale, meaning any prolonged disruption creates acute supply shortfalls across the world's most populous and fastest-growing energy markets.
The strait's importance extends well beyond crude oil. It also serves as a critical transit corridor for:
- Liquefied natural gas (LNG), particularly from Qatar, one of the world's largest LNG exporters
- Fertilisers, including nitrogen and phosphate products essential to global agricultural supply chains
- Methanol, a key feedstock for plastics, adhesives, and industrial chemicals
- Petrochemical intermediates including ethylene and propylene
- Sulfur, a refinery byproduct with broad agricultural and industrial applications
This multi-commodity exposure means that a Hormuz closure is not simply an oil supply event. It is a simultaneous disruption to food security inputs, industrial manufacturing, and energy systems across interconnected global markets. For further context on global LNG supply dynamics and how they interact with this crisis, the implications extend well beyond what headline crude prices suggest.
Comparative Chokepoint Risk: How Hormuz Stacks Up Against Other Vulnerabilities
| Chokepoint | Daily Oil Volume | Primary Risk Factor | Alternative Route Availability |
|---|---|---|---|
| Strait of Hormuz | ~20 million b/d | Military conflict / blockade | Extremely limited |
| Strait of Malacca | ~16 million b/d | Piracy / congestion | Partial (Lombok Strait) |
| Suez Canal | ~5.5 million b/d | Political disruption | Cape of Good Hope (costly) |
| Bab el-Mandeb | ~6 million b/d | Houthi attacks | Suez bypass |
"No other maritime chokepoint combines Hormuz's volume, geographic isolation, and lack of viable bypass infrastructure. Any prolonged closure is categorically different from disruptions at other chokepoints because there is simply no equivalent mechanism to reroute the volume at scale."
What Triggered the Current Strait of Hormuz Oil Supply Disruption?
Geopolitical Origins: The Military Conflict That Closed the Strait
The 2026 Hormuz closure was triggered by military conflict involving Iran, the United States, and Israel, with hostilities escalating from late February 2026. By the ninth week of the blockade, traffic through the strait had fallen to near zero, an operational halt with no direct modern precedent.
Diplomatic channels have not provided relief. U.S.-Iran negotiations stalled as both parties hardened their positions, removing any near-term pathway to a negotiated reopening. Compounding the problem, Houthi activity along the Red Sea corridor intensified during the same period, directly threatening the primary alternative routing option for tankers attempting to bypass the Gulf. According to UNCTAD's analysis of Hormuz disruptions, the implications for global trade and development are severe and far-reaching.
Timeline of Escalation and Market Response
- Weeks 1–2: Initial supply disruption triggers emergency strategic petroleum reserve (SPR) releases coordinated through IEA member nations
- Weeks 3–5: Petrochemical and LPG markets across Asia and the Middle East register the first-order price impacts as feedstock availability tightens
- Weeks 6–7: Transportation fuel markets in Europe and North America begin absorbing secondary price shocks as supply buffers erode
- Weeks 8–9: Cumulative supply loss approaches 1 billion barrels; demand destruction replaces stockpile drawdowns as the primary market adjustment mechanism
How Large Is the Supply Shock? Quantifying a Historic Market Disruption
The Billion-Barrel Loss: Scale, Context, and Precedent
The numbers involved in this disruption are historically extraordinary. Cumulative supply losses have reached approximately 1 billion barrels, a figure that is more than double the volume of emergency reserves released during the crisis response period. The IEA has characterised the disruption as the largest oil supply shock in modern market history.
At full closure, the market is absorbing the simultaneous removal of roughly 12–13 million barrels per day from available global supply. To place this in context, this volume exceeds the entire crude output of Russia or Saudi Arabia individually, and it arrives not through a gradual decline but as an abrupt operational halt.
Scale Check: The ongoing Strait of Hormuz oil supply disruption has removed an estimated 12–13 million barrels per day from global supply, producing a cumulative loss approaching 1 billion barrels. This represents the largest single oil supply disruption in modern market history, exceeding the combined volume of emergency reserve releases deployed in response.
Supply Loss vs. Historical Disruptions: A Structural Comparison
| Disruption Event | Peak Supply Loss (b/d) | Duration | Market Resolution Mechanism |
|---|---|---|---|
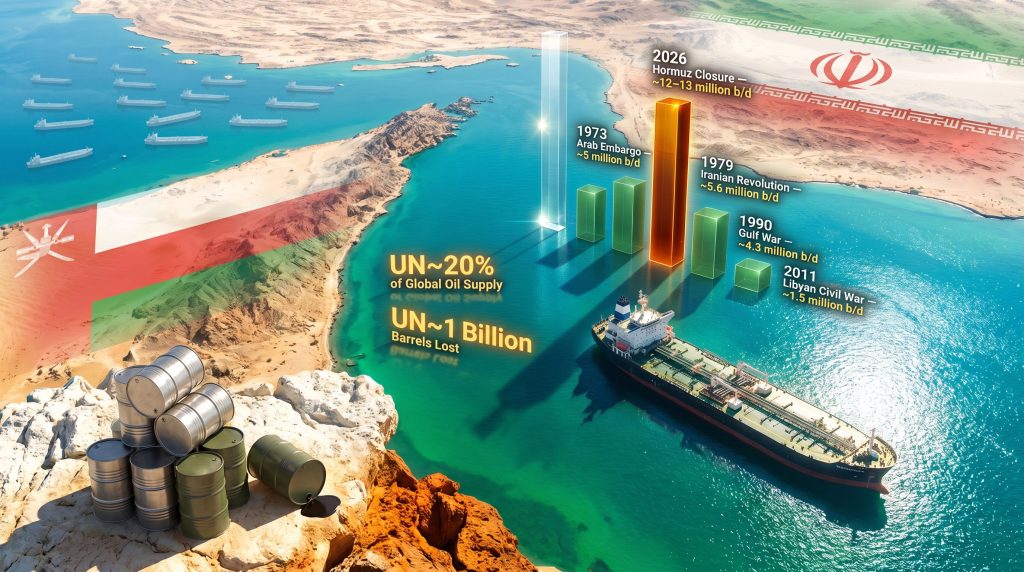
| 1973 Arab Oil Embargo | ~5 million b/d | ~5 months | Diplomatic resolution + demand rationing |
| 1979 Iranian Revolution | ~5.6 million b/d | ~12 months | Demand destruction + price spike |
| 1990–91 Gulf War | ~4.3 million b/d | ~6 months | Coalition military action + SPR release |
| 2022 Russia-Ukraine (oil) | ~3 million b/d | Ongoing | Rerouting + sanctions management |
| 2026 Hormuz Closure | ~12–13 million b/d | 9+ weeks (ongoing) | Demand destruction + SPR depletion |
The table above illustrates a critical structural distinction. Every prior major oil supply disruption peaked at volumes that, while economically painful, left substantial global spare capacity intact. The 2026 closure operates at a scale roughly 2.5 times larger than any predecessor event, eliminating the buffer that historically allowed price signals alone to manage market rebalancing.
What Is Demand Destruction and Why Is It Now the Central Market Mechanism?
Understanding Demand-Side Adjustment in a Supply-Constrained Environment
When emergency reserves are depleted and rerouting options are exhausted, oil markets have only one remaining adjustment mechanism: prices rise until enough consumers and industries reduce their consumption to match the constrained supply. This process is known as demand destruction, and it is now the dominant force shaping market outcomes.
Demand destruction is not a single event. It unfolds in sequential waves, moving from the most price-sensitive industrial users through to transportation sectors and eventually broader consumer markets. The process is also partially irreversible; consumption habits and capital allocation decisions made during a supply shock do not fully unwind when supply is restored.
Trafigura Group's chief economist Saad Rahim has noted that demand adjustment is already occurring in markets that do not function as primary pricing centres, and that the scale of this adjustment must expand substantially if the disruption continues. This observation captures an important asymmetry: the visible pricing signals in benchmark crude markets understate the real-world consumption adjustments already underway in less transparent markets across Asia and the Middle East. (Bloomberg/World Oil, April 2026)
The Wave Structure of Demand Destruction: Sector-by-Sector Breakdown
Wave 1: Industrial Feedstocks (Asia and Middle East, Weeks 1–4)
- Petrochemical producers in Asia were the first to absorb meaningful price shocks as feedstock costs surged
- LPG consumers across Gulf-adjacent markets faced immediate availability constraints
- Refinery run-rate reductions in the region cut downstream product output, compressing supply further along the value chain
Wave 2: Transportation Fuels (Europe and North America, Weeks 5–8)
- Diesel and middle distillate markets tightened sharply, creating pressure across freight and industrial logistics networks
- U.S. gasoline prices climbed above $4 per gallon, a threshold that historically produces measurable consumer demand suppression
- Airlines began reducing capacity in response to elevated jet fuel costs, with knock-on effects for passenger travel and air cargo
Wave 3: Macro-Level Consumption Shock (Projected, Month 3+)
- The IEA projects global oil demand is on track for its sharpest monthly decline in five years
- Analysis from FGE NexantECA suggests demand losses could reach 5 million b/d within the following month, representing approximately 5% of global supply
- A closure extending beyond three months without resolution carries recession-level macroeconomic implications
Cuneyt Kazokoglu of FGE NexantECA has described the demand destruction process as moving in waves, with Asia absorbing the first shock and European markets already beginning to experience fuel availability constraints and price impacts. (Bloomberg/World Oil, April 2026)
"The critical insight here is that demand destruction is not a failure of the market. It is the market functioning exactly as designed under extreme supply constraint. The question is not whether demand will fall, but how far it must fall before equilibrium is restored."
Which Sectors and Regions Face the Greatest Exposure?
Sector Vulnerability Matrix
| Sector | Exposure Level | Primary Impact Mechanism | Recovery Timeline |
|---|---|---|---|
| Petrochemicals | Critical | Feedstock unavailability | Slow (infrastructure dependent) |
| Aviation | High | Jet fuel cost surge and capacity cuts | Medium |
| Road Freight / Diesel | High | Middle distillate shortage | Medium |
| Agriculture / Fertilisers | High | Fertiliser supply chain disruption | Slow (seasonal dependency) |
| Consumer Gasoline | Moderate-High | Retail price inflation above $4/gal | Fast (demand elastic) |
| Manufacturing / Industrial | Moderate | Energy cost pass-through | Medium |
| Renewable Energy Supply Chains | Moderate | Chemical and material input disruption | Slow |
Regional Exposure: Who Bears the Heaviest Burden?
Asia carries the greatest systemic risk. Approximately 80% of Persian Gulf oil exports flow toward Asian markets, meaning countries including India, China, Japan, and South Korea face acute supply shortfalls with limited ability to source equivalent volumes elsewhere at comparable cost and speed.
The agricultural dimension of Asian exposure is particularly underappreciated. India sources approximately 18% of its fertiliser imports through Hormuz-linked supply chains. Brazil, despite its geographic distance, relies on the same channels for roughly 10% of its fertiliser imports. China's dependency sits at approximately 8%. These numbers translate directly into food production risk if the disruption extends into planting seasons.
Europe faces secondary but growing exposure. Fuel availability concerns are spreading across key European economies, with middle distillate shortages beginning to affect freight and industrial sectors. Energy inflation is compounding existing cost-of-living pressures, creating political as well as economic urgency around resolution.
North America occupies a more complex position. Retail gasoline prices above $4 per gallon are already suppressing consumer demand, while U.S. energy producers are simultaneously benefiting from elevated global crude pricing and increased demand for domestically produced LNG and crude oil exports. The trade war impact on oil markets has further complicated the policy environment for major consuming nations navigating these pressures simultaneously.
The next major ASX story will hit our subscribers first
Are There Viable Alternatives to Strait of Hormuz Oil Transit?
Pipeline Bypass Infrastructure: Capacity vs. Reality
The engineering response to Hormuz dependency has produced several bypass pipeline projects, however the capacity gap between available infrastructure and normal strait throughput is enormous:
- UAE Fujairah Pipeline: Designed specifically to bypass Hormuz; operational capacity of approximately 1.5 million b/d, representing less than 8% of normal strait volumes
- Saudi East-West Pipeline (Petroline): Capacity of approximately 5 million b/d to Red Sea terminals, but the Red Sea corridor is itself exposed to active Houthi interdiction
- Iran's Goreh-Jask Pipeline: Intended to provide an Iranian bypass route, but is operating at below 70,000 b/d and has experienced operational halts
- Combined bypass capacity across all available pipelines: Estimated at approximately 2.6 million b/d, covering roughly 10–20% of normal Hormuz throughput
Why Rerouting Cannot Solve the Crisis
- Red Sea and Bab el-Mandeb alternative routes expose tankers to active Houthi missile and drone threats, creating a compounded security risk
- The Suez Canal imposes vessel size restrictions that limit the volume of Asia-bound crude that can realistically be rerouted through this pathway
- Cape of Good Hope routing adds 10–14 days of voyage time per journey, increasing freight costs substantially and reducing effective supply velocity to Asian markets
- Even if Hormuz were to reopen tomorrow, voyage delays, port congestion, and potential infrastructure damage would prevent any immediate supply rebound
Available bypass infrastructure can offset no more than 10–20% of normal Hormuz throughput. The structural dependency on this single waterway has no short-term engineering solution, and this fact was known long before the 2026 crisis began.
What Are the Price Scenarios Under Different Closure Durations?
Crude Price Trajectory Modelling by Closure Duration
| Closure Duration | Estimated Brent Crude Range | Primary Market Driver | Macro Risk Level |
|---|---|---|---|
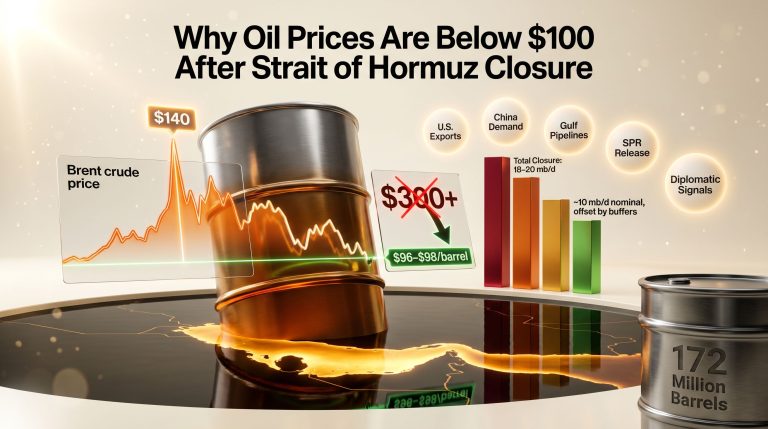
| 4–6 weeks | $90–$105/bbl | SPR releases + demand softening | Elevated |
| 8–12 weeks | $105–$130/bbl | Reserve depletion + demand destruction | High |
| 12+ weeks | $130–$154/bbl | Full demand rationing + recession risk | Severe |
| 6+ months (no resolution) | $154+/bbl or demand collapse | Global recession trigger | Systemic |
Brent crude has already moved into the 8–12 week disruption pricing band, consistent with the current timeline. Monitoring crude oil price trends remains essential, as analyst projections indicate prices could approach $154 per barrel under a sustained 12-week closure, a level at which demand destruction accelerates sharply across all consuming sectors.
It is worth noting that very high crude prices are self-limiting to a degree: they accelerate the very demand destruction that brings markets back toward balance. However, the economic collateral damage from reaching those price levels, in the form of inflation, unemployment, and reduced industrial output, does not reverse quickly when prices eventually fall.
Disclaimer: Price projections represent analyst scenario modelling under specified assumptions. Actual market outcomes will depend on geopolitical developments, policy responses, and demand dynamics that cannot be predicted with certainty.
Beyond Oil: How the Disruption Is Cascading Through Global Commodity Markets
The Non-Oil Supply Chain Crisis
The Strait of Hormuz oil supply disruption is triggering secondary effects across a wide range of globally traded commodities that receive less media attention but carry significant real-world consequences. Furthermore, commodity market volatility is being amplified across multiple asset classes as investors reassess risk exposures in this environment.
Fertilisers represent perhaps the most serious non-energy concern. Gulf-region producers supply a substantial share of global nitrogen and phosphate fertiliser exports. Disruption to these flows threatens agricultural input availability across major farming economies and carries downstream food inflation risk that could persist well beyond any energy market recovery.
Methanol production in the Gulf region is significantly impaired, affecting global supply chains for plastics, adhesives, and fuel additives. Sulfur supply chains are being reshaped as Gulf refinery operations face dual constraints from fuel costs and supply disruptions. Aluminium smelting operations in the region, which are energy-intensive and already under cost pressure, face compounding input constraints.
For advanced technology sectors, the disruption is creating upstream pressure on materials including graphite and specialty chemicals used in battery manufacturing and high-technology production.
Structural Risk: Fertiliser supply disruptions operate on agricultural cycle timelines. The food security consequences of a prolonged Hormuz closure may outlast the energy market recovery by 6 to 18 months, creating a delayed second-order crisis even after geopolitical resolution.
What Are the Macroeconomic Consequences If the Crisis Persists?
Recession Risk Modelling: The Three-Month Threshold
Energy market analysts have identified a three-month sustained closure as the threshold at which this disruption transitions from a sector-level supply shock to a systemic macroeconomic event. Frederic Lasserre, head of research at Gunvor Group, has stated that if the strait remains closed for three months without resolution, the situation transforms into a macro issue with recession-level global consequences. (Bloomberg/World Oil, April 2026)
The mechanism through which an energy supply shock becomes a recession is well understood, if politically inconvenient. Persistent energy price inflation feeds directly into broader consumer price indices, compressing household purchasing power across all import-dependent economies. Central banks are then caught in a stagflationary dilemma: raising interest rates to combat energy-driven inflation risks accelerating economic contraction that is already being pressured by supply disruptions. The IEA's assessment of Middle East energy markets provides further context on how these dynamics interact with broader global energy security concerns.
Who Benefits? Identifying the Structural Winners
Not all economies face negative outcomes from the crisis. In fact, several groups stand to gain:
- U.S. energy producers benefit from elevated global crude pricing and dramatically increased demand for domestically produced LNG and crude exports
- Non-Gulf oil exporters including Norway, Canada, Brazil, and Angola gain significant pricing power as buyers urgently seek Hormuz-independent supply sources
- Nations with large strategic petroleum reserves gain geopolitical leverage during the crisis window, as reserve access becomes a diplomatic currency
- Alternative energy and energy efficiency sectors see the economic case for electrification, renewable deployment, and energy efficiency investment strengthened materially by sustained high fuel prices
Frequently Asked Questions: Strait of Hormuz Oil Supply Disruption
How much oil passes through the Strait of Hormuz daily?
Under normal conditions, approximately 20 million barrels per day transit the Strait of Hormuz, representing roughly 20% of global oil supply and 25% of all seaborne oil trade.
What caused the 2026 Strait of Hormuz closure?
The closure was triggered by military conflict involving Iran, the United States, and Israel, which escalated from late February 2026 and resulted in Hormuz traffic falling to near zero by the ninth week of the disruption.
How does demand destruction work during an oil supply disruption?
Demand destruction occurs when sustained high prices force consumers and industries to reduce consumption rather than pay elevated costs. It typically unfolds in sequential waves, first affecting price-sensitive industrial users, then transportation sectors, and ultimately broader consumer markets across multiple geographies.
What is the total supply loss from the Hormuz closure?
Cumulative supply losses have reached approximately 1 billion barrels, with ongoing losses estimated at 12–13 million barrels per day, making this the largest single supply disruption in modern oil market history.
Could a global recession result from the Hormuz closure?
Analysts warn that if the closure extends beyond three months without diplomatic resolution, the energy supply shock is likely to trigger recession-level macroeconomic consequences, particularly across oil-import-dependent economies in Asia and Europe.
What alternative routes exist for Hormuz oil?
Available pipeline bypass infrastructure offers a combined capacity of approximately 2.6 million b/d, covering only 10–20% of normal Hormuz throughput. No viable full-scale alternative exists at current infrastructure capacity.
The Path Forward: Scenarios, Resolution Timelines, and Market Recovery
Three Scenarios for Hormuz Resolution
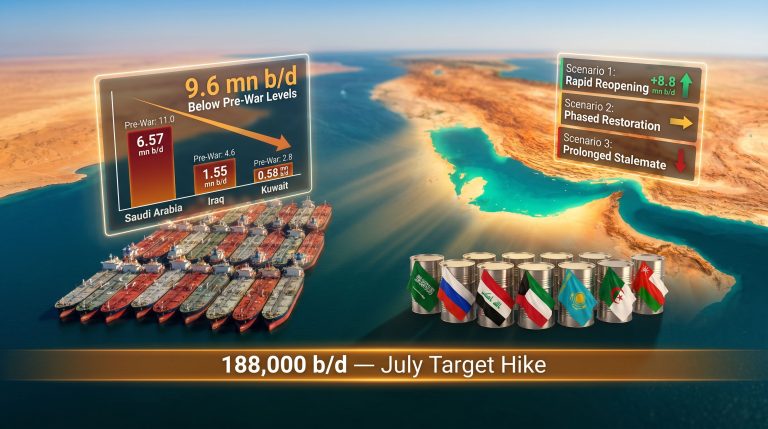
Scenario A: Diplomatic Resolution Within 30 Days
Crude prices stabilise and begin retreating from peak levels. Supply recovery remains gradual due to voyage delays and infrastructure assessment requirements. Some permanent consumption shifts persist even as demand partially recovers.
Scenario B: Partial Reopening With Negotiated Passage (30–90 Days)
Select tanker passage is negotiated through bilateral arrangements. Partial supply restoration reduces but does not eliminate price pressure. Fertiliser and petrochemical supply chains remain disrupted beyond the timeline of energy market recovery, creating a decoupled secondary crisis.
Scenario C: Sustained Closure Beyond 90 Days
Global recession risk becomes the dominant market narrative. Demand rationing replaces price-induced demand destruction as the primary adjustment mechanism. Structural shifts in global energy trade routing accelerate permanently, with long-term implications for Gulf producer revenues and Asian import strategies.
What Market Recovery Actually Looks Like
Recovery from a disruption of this scale is not a simple rebound. Energy sector pricing will likely improve before downstream industrial and agricultural markets stabilise. Fertiliser supply disruptions operating on agricultural cycle timelines may create food security consequences lasting 6 to 18 months beyond any Hormuz reopening.
Tanker market congestion, port backlogs, and potential infrastructure repair requirements will delay full supply normalisation by weeks to months even after the strait physically reopens. Long-term investment in Hormuz-bypass infrastructure and supply chain diversification is likely to accelerate as a strategic priority for major importing nations, though the lead times for meaningful new capacity are measured in years rather than months.
The deeper lesson of the 2026 crisis may ultimately be structural: global energy markets spent decades building extraordinary efficiency into supply chains without building equivalent resilience. The Strait of Hormuz oil supply disruption has exposed that tradeoff in the most consequential way possible, and the restructuring of global energy logistics that follows will reshape markets long after the immediate crisis is resolved.
Further analysis of global oil chokepoint risk and energy market dynamics is available from World Oil at worldoil.com.
Want to Know Which ASX Resources Companies Are Positioned for the Next Major Commodity Shift?
The Strait of Hormuz disruption is reshaping global energy and commodity markets in real time, creating significant opportunities for investors who can identify the right ASX-listed resource companies before the broader market does. Discovery Alert's proprietary Discovery IQ model delivers real-time alerts on significant ASX mineral and commodity discoveries — explore historic discoveries and their returns to see how early positioning can make a material difference, and begin your 14-day free trial today to stay ahead of the next major market move.