
July 23, 2026
When Energy Geography Becomes Destiny: Understanding the World's Most Dangerous Chokepoint
Few concepts in global economics are as quietly consequential as maritime chokepoints. These narrow corridors of water, often just kilometres wide, function as the circulatory system of international trade. For decades, energy planners, military strategists, and commodity traders have understood that the vulnerability of global oil supply is not primarily a question of how much oil exists underground, but rather how reliably it can move from producer to consumer. No single location illustrates this reality more starkly than the Strait of Hormuz oil supply disruption unfolding in 2026.
The strait sits at the mouth of the Persian Gulf, connecting it to the Gulf of Oman and ultimately the broader Indian Ocean. At its narrowest navigable point, it spans roughly 33 kilometres of water. That modest geographic feature, almost unremarkable on a global map, serves as the transit corridor for approximately 20% of the world's total petroleum supply under normal operating conditions.
An equivalent share of global liquefied natural gas flows passes through simultaneously, making it uniquely significant for both liquid fuel and gas markets in a way no other passage can claim. The LNG supply implications for importing nations are, consequently, severe.
The critical distinction between the Strait of Hormuz and other chokepoints is the absence of meaningful alternatives. The Suez Canal, for instance, can be bypassed via the Cape of Good Hope route at the cost of additional time and fuel. The Strait of Hormuz offers no comparable detour for the majority of Persian Gulf export volumes.
When big ASX news breaks, our subscribers know first
Why Bypass Infrastructure Cannot Save Global Markets
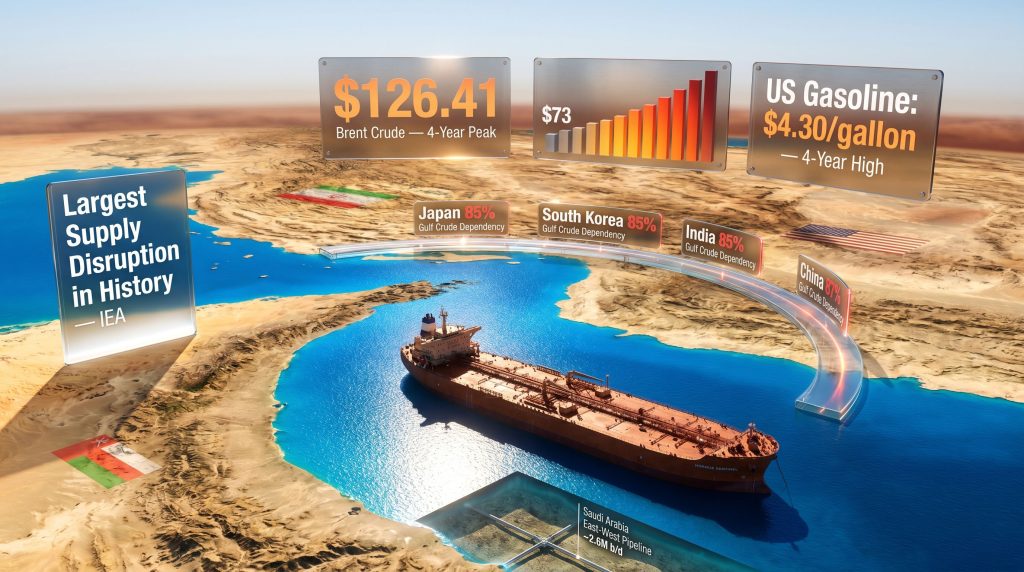
The limited pipeline alternatives that do exist highlight just how structurally dependent global energy trade remains on the strait remaining open. Saudi Arabia and the UAE operate combined pipeline bypass capacity that reaches approximately 2.6 million barrels per day, a figure that sounds substantial until measured against the 17 to 20 million barrels that ordinarily transit the strait each day.
| Bypass Route | Operator | Approximate Capacity | Key Limitation |
|---|---|---|---|
| Saudi East-West Pipeline | Saudi Aramco | Combined ~2.6 million b/d | Fraction of normal strait volume |
| Abu Dhabi Crude Oil Pipeline | ADNOC | Included in above | Not scalable in the short term |
| Goreh-Jask Pipeline | NIOC (Iran) | ~300,000 b/d | Exports fell below 70,000 b/d by mid-2024; halted after September 2024 |
Iran's Goreh-Jask pipeline was specifically designed to allow Iranian exports to bypass the strait via the Gulf of Oman, a project with clear strategic logic. However, its actual throughput fell dramatically short of its designed capacity, dropping below 70,000 barrels per day by mid-2024 before operations ceased entirely after September 2024.
Even at theoretical full utilisation across all available bypass routes, the infrastructure could offset only a fraction of normal strait throughput. Furthermore, OPEC's market influence over spare capacity decisions adds another layer of complexity to any coordinated supply response.
The structural reality is that no combination of existing bypass pipelines, alternative tanker routes, or emergency workarounds can compensate for the sustained closure of the Strait of Hormuz at anything approaching normal supply volumes. Global markets are structurally exposed, and no short-term engineering solution changes that fact.
How the 2026 Hormuz Crisis Unfolded
The sequence of events that brought the world to its current energy crisis began accelerating in the early months of 2026. Armed conflict involving the United States, Iran, and Israel triggered a near-complete collapse in commercial tanker movements through the strait beginning in late February 2026. Daily oil tanker transits, which under normal conditions number in the dozens, collapsed to single-digit figures, a historic low that the International Energy Agency described as the largest supply disruption in recorded history.
Iran issued formal communication to the relevant maritime authority permitting safe passage for vessels not affiliated with the United States or Israel. In practice, however, the ongoing security environment led the overwhelming majority of commercial operators to suspend transits regardless of the formal legal position. When war-risk insurance premiums surge dramatically, the theoretical legal permission to transit becomes commercially meaningless.
The Selene Incident: A Microcosm of the Crisis
One vessel became a symbol of the broader operational reality. The Selene, a container ship bound for Pakistan, was stopped and forced to reverse course after failing to secure authorisation from Iranian authorities. This was not an isolated case but one of multiple vessels turned back during the same period.
The incident illustrated the gap between Iran's stated legal framework for passage and the practical impossibility of transit for most commercial operators. Insurance underwriters responded to the deteriorating security environment by dramatically increasing war-risk premiums across the board. This created a self-reinforcing dynamic: even vessels technically permitted to pass found the financial cost of transit prohibitive, deepening the effective closure beyond what any single military action could have achieved.
Oil Prices at a Four-Year Peak: The Numbers Behind the Surge
Before conflict broke out, Brent crude was trading at approximately $73 per barrel. By early May 2026, it had surged to an intraday peak of $126.41 per barrel, its highest level in four years, before retreating to approximately $115.80. West Texas Intermediate fell 0.7% to around $106 per barrel during the same period.
For American consumers, the impact was already visible at the bowser: the national average retail gasoline price climbed to $4.30 per gallon, a four-year high according to AAA data. Monitoring crude oil price trends in the months preceding the crisis reveals how rapidly sentiment shifted once the military situation deteriorated.
| Benchmark | Pre-Conflict Level | Peak During Disruption | Trading Level (May 3, 2026) |
|---|---|---|---|
| Brent Crude | ~$73/barrel | $126.41/barrel | ~$115.80/barrel |
| WTI Crude | Proportionally lower | Not separately specified | ~$106/barrel (-0.7%) |
| US Average Gasoline | Below $3.50/gallon | Not separately specified | $4.30/gallon |
Crude had risen for eight consecutive trading sessions by early May 2026, with diplomatic efforts between Washington and Tehran having stalled completely. The market had stopped pricing in a near-term resolution and begun pricing in structural, long-term scarcity.
Futures Market Mechanics Adding Volatility
Part of the sharp overnight price movement observed in early May was driven not purely by fundamental supply concerns but by the mechanics of futures contract expiry. The heavily traded June futures contract rolled into July contracts, which were priced above $110 per barrel. This mechanical transfer of open interest into higher-priced forward contracts amplified upside price pressure at an already sensitive moment.
Saxo strategist Neil Wilson noted in a published market note that the oil market had transitioned away from monitoring diplomatic progress and was instead focused entirely on the physical scarcity of supply and the risk of further conflict escalation. Deutsche Bank analysts identified an Axios report about potential US military preparations for strikes on Iran as the primary catalyst behind the most acute phase of the overnight rally, according to reporting by CNN.
Vanda Insights founder Vandana Hari characterised the trajectory of oil prices as having nowhere to travel except upward until a permanent reopening of the strait becomes clearly visible to markets. She noted that the timing and mechanism of any such reopening remained entirely unclear as of early May 2026.
The Economic Damage Extends Well Beyond the Petrol Station
Understanding the Strait of Hormuz oil supply disruption requires looking beyond headline crude prices. The damage propagates through multiple simultaneous transmission channels that affect virtually every sector of the global economy.
The key transmission mechanisms are:
-
Direct fuel cost inflation – Rising crude prices immediately increase retail gasoline, diesel, and aviation fuel costs, compressing household disposable income and business operating margins across every fuel-using sector.
-
Petrochemical input cost escalation – Petroleum derivatives including plastics, synthetic rubber, and industrial textiles become more expensive, driving up input costs across manufacturing, agriculture, construction, and consumer goods.
-
Food system stress – Fertiliser production depends heavily on natural gas and petrochemical feedstocks. As input costs rise, agricultural output economics deteriorate, contributing to food price inflation that compounds energy-driven inflationary pressure.
-
Developing economy vulnerability – Nations including India, Brazil, and Turkey, which depend on substantial energy imports and lack significant domestic hydrocarbon reserves, face disproportionately severe exposure to sustained price increases in ways that resource-rich economies do not.
Asia's Supply Chain Exposure
Asian economies sit at the intersection of two compounding vulnerabilities: high energy import dependency and large-scale export manufacturing that relies on petrochemical-derived inputs. The combination creates outsized exposure relative to most other regions.
Supply shortages were already being reported across multiple product categories by early May 2026, including medical gloves, cosmetics, and processed foods such as instant noodles. These categories are not typically associated with oil market disruptions in public consciousness, yet they share a critical dependence on petrochemical-derived materials. Their shortage illustrates how broadly the secondary effects of an energy supply crisis can reach.
Rystad Energy vice president of oil markets Janiv Shah warned that further military escalation or attacks on energy infrastructure could force oil price benchmarks substantially higher still, while simultaneously cautioning that sustained price pressure at current levels may itself begin to destroy demand by weakening the global economy from below.
Global Recession Risk Is Now a Base Case Consideration
Analysts cited by CNN warned that if the disruption to oil flows through the strait persists into the second half of 2026, the probability of triggering a global recession becomes material. This is not a fringe view. In addition, global recession risks were already being flagged by leading analysts well before the current crisis took hold.
The combination of energy inflation, supply chain disruption, and weakening consumer demand creates a stagflationary dynamic. Central banks face a particularly difficult policy environment in such conditions because the standard tools for addressing inflation, primarily interest rate increases, risk accelerating the demand destruction already underway.
Historical Precedents and Why This Disruption Is Different
| Historical Event | Year | Estimated Supply Loss | Typical Duration | Peak Price Response |
|---|---|---|---|---|
| Arab Oil Embargo | 1973-74 | ~5 million b/d | ~6 months | Prices roughly quadrupled |
| Iranian Revolution | 1978-79 | ~2-3 million b/d | ~12 months | Prices approximately doubled |
| Gulf War Supply Shock | 1990-91 | ~4-5 million b/d | ~6 months | Prices briefly doubled |
| 2026 Hormuz Closure | 2026-ongoing | Up to 20% of global supply | Ongoing, no resolution path visible | Brent near-doubled from $73 to $126 |
Prior major supply disruptions each involved defined geopolitical circumstances with identifiable resolution pathways. The 1973 embargo was a political instrument that could be withdrawn. The Iranian Revolution disruption stabilised as new supply patterns were established. The Gulf War shock resolved with the military conclusion of a defined conflict.
The 2026 Hormuz crisis, however, involves multiple state actors with divergent strategic objectives and no obvious off-ramp visible from the current position. The IEA's characterisation of this event as the largest supply disruption in history reflects not only the volume of supply at risk but the absence of any near-term mechanism for normalisation. According to analysis from the Oxford Institute for Energy Studies, the structural anatomy of this shock differs meaningfully from all prior precedents.
The next major ASX story will hit our subscribers first
Why Strategic Reserves Cannot Solve This Problem
The instinctive policy response to an acute supply shortage is to release Strategic Petroleum Reserves. The United States, IEA member states, and other major consumers maintain stockpiles precisely for this purpose. However, SPR releases are designed to bridge temporary gaps measured in weeks to months, not to substitute for the structural loss of one-fifth of global daily supply over an extended period.
The US SPR has been drawn down significantly in prior years through releases tied to earlier market events, reducing the available buffer. Even at full theoretical release capacity across all IEA member states, the volumes available cannot replace sustained Hormuz closure volumes.
The alternative supplier ramp-up picture is similarly constrained:
- US shale producers could theoretically increase output but require 6 to 18 months of lead time and significant capital deployment
- Brazilian pre-salt operators face similar timeline and capital constraints for meaningful production increases
- West African exporters have limited spare capacity available on short notice
- OPEC+ spare capacity is concentrated primarily in Saudi Arabia and the UAE, both of which face their own geopolitical constraints given the regional conflict environment
Scenario Pathways: Where This Crisis Could Lead
Scenario A: Rapid Diplomatic Resolution (Low Probability)
A negotiated ceasefire or breakthrough agreement reopens the strait within four to eight weeks. Brent crude retreats toward the $85 to $95 range as the physical scarcity premium unwinds. Inflation persistence remains a challenge but global recession risk recedes substantially.
Scenario B: Prolonged Stalemate (Most Likely Near-Term Base Case)
Conflict persists without decisive military resolution or diplomatic breakthrough through mid-to-late 2026. Brent crude consolidates in the $110 to $130 range with periodic escalation-driven spikes. Global GDP growth forecasts are revised downward across major forecasting institutions. Supply chain restructuring accelerates as manufacturers seek to reduce dependency on petrochemical-intensive inputs.
Scenario C: Major Infrastructure Escalation (Low Probability, Extreme Impact)
Attacks on energy infrastructure, including production facilities, refineries, or export terminals, are executed by any party to the conflict. Brent crude tests or exceeds $150 per barrel. Global recession becomes the consensus base case. Emergency coordinated IEA SPR releases are triggered. Long-term structural damage to Middle East energy infrastructure extends the recovery timeline by years rather than months.
The single most important real-time indicator to monitor is daily tanker transit counts through the Strait of Hormuz. Any sustained return to double-digit daily transits would signal meaningful de-escalation and would be reflected in oil prices almost immediately.
Regional and Sector Vulnerability: Who Faces the Greatest Risk
| Region/Economy | Primary Exposure | Secondary Exposure | Vulnerability Assessment |
|---|---|---|---|
| Japan | 90%+ of crude imports via Gulf | LNG supply, manufacturing inputs | Critical |
| South Korea | ~70% of crude imports via Gulf | Petrochemical feedstocks | Critical |
| India | ~60% of crude imports via Gulf | Fertiliser costs, food inflation | High |
| China | Significant Gulf dependency | Industrial inputs, export competitiveness | High |
| Europe | Moderate direct exposure | LNG pricing, manufacturing costs | Moderate to High |
| United States | Net energy exporter | Gasoline prices, petrochemical costs | Moderate |
| Brazil and Turkey | Significant import dependency | Agriculture, construction input costs | High |
Beyond regional economic exposure, the sector-level impact picture reveals just how broadly the Strait of Hormuz oil supply disruption reaches into ordinary commercial life. Furthermore, the trade war oil impacts already weighing on markets have compounded these vulnerabilities considerably.
-
Aviation: Jet fuel is directly priced off crude benchmarks. Airline profitability faces severe pressure at sustained $115+ crude prices, with potential for capacity reductions and fare spikes affecting global travel.
-
Shipping and Logistics: War-risk insurance premium surges add substantial costs to all goods movements, even those entirely unrelated to energy cargoes. Every consumer product that moves by sea faces upward price pressure.
-
Agriculture: Fertiliser input costs are rising, particularly for nitrogen-based products dependent on natural gas feedstocks. This feeds into food price inflation with a lag of weeks to months as growing season costs are passed through.
-
Automotive Manufacturing: Synthetic rubber, ABS plastics, and numerous other petrochemical-derived components face simultaneous cost escalation, compressing already-thin manufacturing margins.
-
Healthcare Supply Chains: Medical gloves, disposable equipment, and numerous pharmaceutical packaging materials derive from petrochemical inputs. Shortages already documented in Asia as of early May 2026 may spread to other import-dependent regions.
Frequently Asked Questions
How much oil passes through the Strait of Hormuz each day?
Under normal operating conditions, the strait handles approximately 17 to 20 million barrels of crude oil and petroleum products daily, representing roughly 20% of the global petroleum supply. An equivalent share of global LNG trade also transits the waterway, making it simultaneously critical for both liquid fuel and gas markets.
Why can't tankers simply take a different route?
Unlike other maritime chokepoints, the Strait of Hormuz has no viable large-scale bypass for the majority of Gulf producer exports. Existing pipeline alternatives in Saudi Arabia and the UAE can accommodate only a small fraction of normal strait throughput. Rerouting around the Arabian Peninsula adds significant transit time and cost without resolving the fundamental supply volume problem.
How high could oil prices go if the strait remains closed?
Rystad Energy vice president Janiv Shah has noted that further military escalation or attacks on energy infrastructure could trigger rapid additional price gains beyond current levels. Some scenario analyses place Brent crude above $150 per barrel in a severe escalation scenario involving infrastructure attacks. The trajectory depends on the duration of the closure and the extent to which alternative supply sources can be mobilised.
Which countries are most vulnerable?
Japan and South Korea face the highest direct exposure given their overwhelming dependence on Gulf crude imports. India faces high exposure through both direct energy import dependency and downstream food and fertiliser cost effects. Developing economies including Brazil and Turkey face significant secondary exposure through petrochemical supply chains and agricultural input costs.
What could resolve this crisis?
A negotiated diplomatic agreement between the parties to the conflict, resulting in guaranteed safe passage for commercial shipping, would be the most direct resolution. Military conclusion of the conflict that restores Iranian compliance or removes the threat to commercial transit would serve a similar function. Both pathways face significant uncertainty given the multi-party nature of the conflict and the divergent strategic objectives involved. Reporting by the BBC suggests that diplomatic channels remain deeply strained, with no imminent breakthrough anticipated.
Disclaimer: This article contains forward-looking analysis, scenario projections, and references to analyst commentary. It does not constitute financial or investment advice. Oil price forecasts and economic projections involve significant uncertainty. Readers should conduct independent research before making any investment or commercial decisions based on energy market conditions.
Want To Know Which ASX Miners Could Benefit From the Global Energy Crisis?
Discovery Alert's proprietary Discovery IQ model scans ASX announcements in real time, delivering instant alerts on significant mineral discoveries — including the energy commodities at the centre of today's most volatile markets — so subscribers can identify actionable opportunities before the broader market reacts. Explore how historic mineral discoveries have generated substantial returns and begin your 14-day free trial at Discovery Alert to position yourself ahead of the next major market move.