June 21, 2026
When a Narrow Waterway Holds the World's Energy System Hostage
Picture a corridor of water barely wider than a mid-sized city is long. Through that corridor, every single day, flows enough crude oil to fuel every car, power every factory, and heat every home across Europe and North America combined. That is not a hypothetical thought experiment. It is the operating reality of the Strait of Hormuz oil supply disruption risk, a 33-kilometre passage between Iran and Oman that functions as the circulatory valve of global petroleum supply.
Any serious analysis must begin not with the politics, but with the physics. The waterway is geologically and geographically irreplaceable. It connects the oil-producing heartland of the Persian Gulf to the Arabian Sea and from there to every major consumption market on earth. There is no engineered alternative that can replicate its capacity. What makes Hormuz uniquely dangerous as a chokepoint is not merely its strategic location but the combination of enormous throughput volume, an almost complete absence of viable bypass infrastructure, and markets that respond to perceived risk as rapidly as they respond to actual supply loss.
When big ASX news breaks, our subscribers know first
Why the Strait of Hormuz Carries Irreplaceable Strategic Weight
The Geography That Cannot Be Redesigned
The Strait of Hormuz measures approximately 90 miles in total length and narrows to just 33 kilometres at its most constricted navigable point. The international shipping lanes within the strait consist of two two-mile-wide corridors separated by a two-mile buffer zone, meaning that the entirety of one of the world's largest commodity flows is channelled through a combined navigable width of roughly four miles.
The Persian Gulf itself, which the strait serves as the sole maritime exit point for, is a relatively shallow shelf sea averaging only 35 metres in depth. This geological characteristic limits the size of vessels that can transit at full load and rules out any deepwater routing alternatives within the Gulf basin.
Every Persian Gulf oil-producing state, including Saudi Arabia, Iraq, the UAE, Kuwait, Qatar, Bahrain, and Iran itself, depends on this single corridor as its primary maritime export route. There is no other ocean access point. The strategic concentration this creates is without parallel in global energy infrastructure.
How Much Oil Actually Flows Through the Strait?
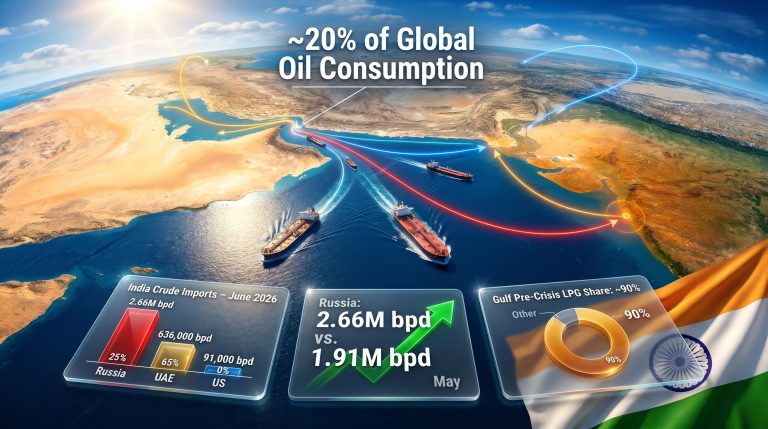
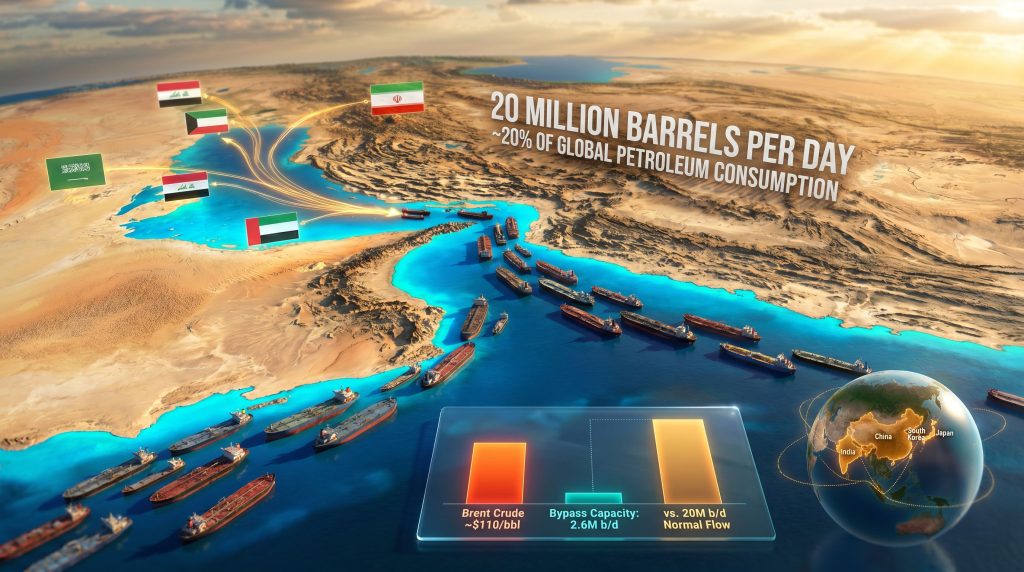
According to the U.S. Energy Information Administration, approximately 20 million barrels per day of oil and petroleum liquids transited the Strait of Hormuz in 2024, representing roughly 20% of total global petroleum consumption. This figure encompasses crude oil, condensates, liquefied natural gas, and refined petroleum products.
| Country | Estimated Daily Export Volume via Hormuz | Primary Destination Markets |
|---|---|---|
| Saudi Arabia | ~7–8 million b/d | Asia, Europe, US |
| Iraq | ~3.5 million b/d | Asia, Europe |
| UAE | ~2.5–3 million b/d | Asia |
| Kuwait | ~1.5–2 million b/d | Asia |
| Iran | ~1–1.5 million b/d | China, Asia |
To contextualise the scale: the combined daily throughput of the Suez Canal (approximately 6–7 million barrels per day) and the Malacca Strait (approximately 15–16 million barrels per day) together represent less than the volume concentrated through Hormuz alone. Furthermore, statistical analysis of vessel traffic patterns shows that approximately 65% of Persian Gulf oil exports travel to Asian markets, primarily China, Japan, India, and South Korea.
What Does a Strait of Hormuz Oil Supply Disruption Actually Mean?
The Difference Between Tension, Partial Restriction, and Full Closure
Not all disruptions are equal, and understanding the spectrum matters enormously for both market analysis and operational planning. Three scenarios carry meaningfully different implications:
- Heightened tension without physical blockage – Risk premiums are embedded in crude prices without any reduction in actual throughput. Markets respond to perceived probability rather than physical reality.
- Partial traffic restriction – Tanker delays, insurance cost spikes, and vessel rerouting reduce effective supply availability even while physical infrastructure remains intact.
- Full closure – Physical interruption of all transit flows, representing the catastrophic scenario that would remove roughly 20 million barrels per day from accessible global supply.
A critical and underappreciated dynamic is that commodity markets do not wait for physical confirmation. During recent escalation events, Brent crude moved from approximately $69 to $74 per barrel in a single trading session based on geopolitical headline risk alone, without any verified reduction in actual flows. The crude oil geopolitical tensions driving these movements also interact with broader supply-demand pressures that were already influencing markets before the latest escalation cycle.
The Concept of Operational Lag Risk
The most sophisticated framing applied to Hormuz disruption scenarios by institutional investors is what market participants increasingly call operational lag risk: the measurable gap between diplomatic resolution and the physical restoration of normal supply chains.
A ceasefire or peace agreement does not flip a switch that restores normal oil flows. Shipping rerouting, marine insurance re-rating, refinery procurement scheduling, and commercial inventory rebuilding each operate on independent timelines that can extend weeks to months beyond any political resolution.
Fujitomi Securities analyst Toshitaka Tazawa communicated this point clearly when telling Reuters that crude supply cannot quickly return to pre-disruption levels even after a peace agreement is reached, because physical commodity systems recover on fundamentally different timelines than political negotiations. This perspective is increasingly central to how institutional investors assess geopolitical energy risk.
Which Regions and Industries Face the Greatest Exposure?
Asia Bears the Heaviest Structural Burden
Asian economies carry disproportionate exposure to any Strait of Hormuz oil supply disruption because of their near-total dependence on Persian Gulf crude imports transiting this corridor. China, Japan, South Korea, and India collectively source the majority of their oil imports through Hormuz, making them structurally vulnerable in ways that European and North American markets are not.
For manufacturing-intensive Asian economies, the cascading effect is severe: higher energy input costs compress industrial margins, reduce export competitiveness, and accelerate consumer price inflation simultaneously. LNG supply disruption compounds the risk for nations with significant gas-fired power generation capacity, as the same corridor also transits a substantial portion of Qatar's LNG exports.
The Cascade Effect Across Non-Energy Industries
The downstream impact extends well beyond fuel prices. Industries that appear insulated from oil market volatility are often deeply exposed through second and third-order supply chain dependencies:
- Petrochemicals – Naphtha and ethane feedstocks sourced from Gulf producers underpin global plastics, synthetic fibres, and chemical manufacturing.
- Fertilisers – Natural gas from Gulf producers is the primary feedstock for ammonia and nitrogen-based fertiliser production, translating disruption directly into agricultural input cost shocks.
- Aluminium smelting – Energy-intensive aluminium production concentrated in the UAE relies on uninterrupted natural gas supply, and Gulf-origin aluminium feeds global automotive, aerospace, and packaging supply chains.
- Airlines and aviation – Jet fuel cost inflation of 50–60% has been reported under active disruption conditions, creating severe margin compression for carriers with limited hedging coverage.
- Construction and agriculture – Downstream exposure through plastics, coatings, fertiliser availability, and composite material pricing creates diffuse but persistent cost pressures.
| Industry Sector | Primary Exposure Channel | Severity of Impact |
|---|---|---|
| Airlines and Aviation | Jet fuel cost inflation (50–60% reported) | Very High |
| Petrochemicals | Naphtha/ethane feedstock availability | High |
| Agriculture | Fertiliser input costs (ammonia, nitrogen) | High |
| Manufacturing (Asia) | Energy input cost inflation | High |
| Aluminium and Metals | Gulf smelting energy disruption | Medium–High |
| Shipping and Logistics | Rerouting costs, insurance premiums | High |
| Construction | Plastics, coatings, materials cost inflation | Medium |
Are There Any Bypass Routes That Can Replace Hormuz?
The Pipeline Infrastructure Gap
Two principal bypass options exist for Persian Gulf producers seeking to export oil without transiting the strait: Saudi Arabia's East-West Pipeline, known as the Petroline, and the Abu Dhabi Crude Oil Pipeline (ADCOP) operated by the UAE. Combined, these two infrastructure assets provide approximately 2.6 million barrels per day of bypass capacity according to EIA assessments.
Against the backdrop of 20 million barrels per day of normal Hormuz throughput, this represents roughly 13% of normal daily flow. Even at full utilisation of every available bypass pipeline, more than 17 million barrels per day would have no alternative routing whatsoever. This structural gap is the core reason why a prolonged disruption carries global supply shock implications that existing infrastructure simply cannot mitigate.
The Cape of Good Hope Alternative
Vessels choosing to avoid the strait can reroute around Africa's Cape of Good Hope, adding approximately 10 to 15 additional sailing days per voyage depending on origin and destination. However, this option does not solve supply shortfalls. It delays and increases the cost of delivery without creating any new supply. The practical consequences include:
- Significantly higher freight rates reflecting extended voyage distances
- Elevated fuel consumption per voyage increasing shipping costs
- Tighter vessel availability as the global tanker fleet is stretched across longer routes
- Compounding increases in war risk and extended-voyage insurance premiums
The Cape rerouting option also creates operational coordination problems for refinery systems calibrated to specific delivery schedules, further amplifying the operational lag between political resolution and restored physical supply chains. Recent analysis of how markets have handled Hormuz crises confirms that rerouting adds cost and delay without addressing the fundamental supply gap.
How Do Treasury Yields and the US Dollar Amplify Commodity Market Stress?
The Macro-Financial Layer Operating Beneath the Headlines
The Strait of Hormuz oil supply disruption does not operate in isolation from macro-financial conditions. Rising US Treasury yields, with 10-year yields near multi-year highs, signal persistent inflation expectations and a Federal Reserve committed to higher-for-longer rate settings. A strengthening US dollar compounds this dynamic by creating a dual headwind for commodity prices denominated in USD, raising effective import costs for non-dollar economies already absorbing higher energy prices.
The interaction produces a counterintuitive market signal. Consequently, gold, typically viewed as a safe-haven asset during geopolitical stress, has lost upward momentum despite active regional conflict. The gold safe-haven dynamics currently at play are explored in more depth through analysis of how trade conflicts reshape commodity positioning, which illustrates how dollar strength and real yield movements can overwhelm traditional safe-haven demand. Spot gold declined to approximately $4,467 per ounce in recent trading as rising real yields simultaneously increased the opportunity cost of holding non-yielding assets.
| Indicator | Current Signal | Implication |
|---|---|---|
| Brent Crude | ~$110/bbl (elevated) | Sustained supply risk premium |
| WTI Crude | ~$103/bbl | US market tightness |
| Spot Gold | ~$4,467/oz | Safe-haven demand offset by dollar strength |
| 10-Year Treasury Yield | Near multi-year highs | Persistent inflation expectations |
| US Dollar Index | Near 6-week highs | Commodity headwind for non-USD importers |
Why the Federal Reserve Cannot Easily Offset an Oil Supply Shock
Monetary policy tools are calibrated to address demand-driven inflation, not supply-side commodity shocks. A crude price surge driven by physical Hormuz disruption would create a stagflationary trap for the Federal Reserve: oil price inflation would simultaneously push headline inflation higher while suppressing economic growth through transport and manufacturing cost inflation.
The Fed inflation outlook under this scenario is particularly constrained, as outlined in recent projections from policymakers who have acknowledged limited room to manoeuvre when supply-side shocks drive price increases. This interaction between commodity supply risk and macro-financial constraints means the full economic impact of a prolonged disruption would likely exceed what either oil price analysis or interest rate analysis would suggest when viewed independently.
The next major ASX story will hit our subscribers first
Realistic Scenarios for Oil Markets Over the Next 6 to 12 Months
Scenario 1: Diplomatic Resolution With Gradual Supply Normalisation
If negotiations reach a framework agreement and military activity ceases, physical supply recovery would still lag political resolution by weeks to months. Brent crude would moderate gradually but likely remain structurally elevated through the second half of 2026 as commercial inventories rebuild slowly. Full inventory normalisation may require 3 to 6 months beyond ceasefire.
Scenario 2: Negotiation Collapse and Renewed Escalation
A breakdown in diplomatic talks with resumed military operations would further constrain Hormuz traffic and trigger a sharp spike in tanker insurance costs. Brent crude would push materially above current levels, recession risk would escalate through transport and manufacturing cost inflation, and the Federal Reserve would face a stagflationary dilemma with limited policy flexibility.
Scenario 3: Prolonged Stalemate With Persistent Risk Premium
Neither resolution nor full escalation, but sustained uncertainty maintaining elevated oil prices. This scenario sees markets embed a persistent geopolitical risk premium of $10 to $20 per barrel above pre-conflict baselines. Furthermore, this may intensify competition over critical mineral supply chains as Western nations pursue accelerated diversification away from single-region energy dependency.
The trade war impact on oil prices adds another layer of complexity here, as escalating trade tensions interact with supply disruption risk to produce compounding demand destruction scenarios that are difficult to model with precision. In addition, the OPEC oil market influence during these scenarios will be pivotal, as member states must balance production decisions against geopolitical allegiances and market stability considerations.
Which Supply Chain Sectors Face the Longest Recovery Timeline?
Understanding the independent recovery timelines of different operational systems is essential for any realistic assessment of disruption duration:
- Shipping and tanker logistics – Vessel repositioning, charter renegotiation, and route recalibration require a minimum of 2 to 6 weeks from the point of ceasefire.
- Marine insurance markets – Underwriters reassess war risk premiums based on sustained incident-free periods. Meaningful premium reductions typically require 30 to 90 days of stable conditions.
- Refinery procurement – Refineries operating on just-in-time crude scheduling face feedstock gaps within days of disruption. Rebuilding procurement pipelines takes 4 to 8 weeks.
- Commercial inventory rebuilding – OECD commercial crude inventories, once drawn down during a disruption period, historically require 3 to 6 months to return to strategic buffer levels.
The most dangerous misreading of a Hormuz disruption scenario is treating diplomatic progress as equivalent to supply recovery. These are separate systems operating on separate timelines, and conflating them creates material errors in both investment positioning and operational planning.
How Should Industries and Investors Position Around Hormuz Risk?
Corporate Exposure Management
Companies with single-region sourcing models concentrated in the Persian Gulf carry the highest structural vulnerability to a prolonged disruption. Those with diversified supply chains, stronger balance sheets, and lower energy intensity per unit of output are comparatively better insulated. Specific risk management considerations include:
- Airlines and shipping operators should actively assess fuel hedging coverage relative to disruption scenarios extending 6 to 12 months
- Petrochemical producers should evaluate alternative feedstock sourcing options outside Gulf-dependent supply chains
- Fertiliser-dependent agricultural businesses should assess input cost exposure and consider forward procurement strategies
- Manufacturers with Asian production concentrated in high-energy-cost environments should model unit economics under sustained $100-plus oil price scenarios
Investor Considerations During Geopolitical Energy Shocks
Institutional investor behaviour during Hormuz-related events consistently demonstrates a pattern worth understanding: initial headline-driven positioning is followed by reassessment as the operational reality of supply recovery timelines becomes apparent. Key principles for navigating this environment include:
- Avoid treating diplomatic headlines as reliable short-term trading signals. Middle East geopolitical risk has a documented history of sudden reversals that make ceasefire optimism unreliable as a basis for commodity market positioning.
- Apply scenario-based rather than single-outcome analysis. The interaction between oil supply risk, Treasury yield movements, and Federal Reserve communications creates a multi-variable environment where single-point forecasts carry low reliability.
- Monitor earnings revision risk in energy-intensive sectors. Airlines, chemicals, agriculture, and logistics face compounding cost pressures that tend to surface in earnings guidance 1 to 2 quarters after the onset of disruption.
Three Indicators to Monitor Continuously
- Diplomatic communications from relevant parties – particularly any signals of negotiation breakdown or framework agreement announcements that would shift the probability weighting across the three scenarios outlined above.
- Weekly API and EIA crude inventory data – the primary quantitative signal distinguishing between financial risk pricing and actual physical supply tightening.
- US Treasury yield movements following Federal Reserve communications – the macro-financial signal that determines whether dollar strength continues suppressing commodity safe-haven demand or whether a policy pivot creates a new directional catalyst.
Frequently Asked Questions: Strait of Hormuz Oil Supply Disruption
How much oil passes through the Strait of Hormuz each day?
Approximately 20 million barrels per day of oil and petroleum liquids transited the Strait of Hormuz in 2024, representing roughly one-fifth of total global petroleum consumption, according to the U.S. Energy Information Administration.
What happens to oil prices if the Strait of Hormuz is blocked?
Even partial disruption or heightened tension, without any physical blockade, is sufficient to cause immediate crude price increases. Recent data shows Brent crude rising from approximately $69 to $74 per barrel in a single trading session during escalation events. A full closure would remove approximately 20 million b/d from accessible global supply with only 2.6 million b/d of pipeline bypass capacity available.
Which countries are most affected by a Strait of Hormuz disruption?
Asian economies, particularly China, Japan, South Korea, and India, face the greatest direct exposure given their heavy dependence on Gulf crude imports transiting Hormuz. European markets face secondary exposure through global price transmission.
Can Saudi Arabia and the UAE bypass the Strait of Hormuz?
Yes, but only partially. Saudi Arabia's East-West Pipeline and the UAE's Abu Dhabi Crude Oil Pipeline collectively provide approximately 2.6 million barrels per day of bypass capacity, a fraction of the 20 million b/d that normally transits the strait.
Why does gold sometimes fall during Middle East oil crises?
Gold's safe-haven demand can be offset when rising US Treasury yields and a strengthening US dollar simultaneously increase the opportunity cost of holding non-yielding assets. During periods of dollar strength and elevated real yields, institutional investors may reduce gold exposure despite active geopolitical risk.
How long does it take for oil supply to recover after a Hormuz disruption ends?
Physical supply recovery typically lags political resolution by weeks to months. Shipping rerouting, marine insurance normalisation, refinery procurement rebuilding, and commercial inventory replenishment each operate on independent timelines, with full normalisation potentially requiring 3 to 6 months even after a formal ceasefire.
The Structural Lesson That Keeps Being Deferred
Every cycle of Hormuz tension produces the same conclusion from energy security analysts: the concentration of 20% of global petroleum supply through a single 33-kilometre waterway is a systemic vulnerability that diplomacy cannot resolve and that brief periods of calm repeatedly obscure. The strait is not a temporary geopolitical flashpoint. It is a permanent structural feature of an energy architecture built around Persian Gulf production dominance.
Industries, policymakers, and investors who treat Hormuz disruptions as isolated headline events tend to be repeatedly surprised by the depth and duration of downstream economic effects. The physical commodity systems that move oil from wellhead to refinery to consumer operate on timelines that bear no relationship to the speed of diplomatic announcements, and the macro-financial environment of elevated yields and a strong dollar compounds the complexity rather than simplifying it.
The durable answer to Hormuz concentration risk lies in accelerated investment in alternative energy infrastructure, supply chain diversification, and strategic reserve capacity. These are multi-decade projects. In the near to medium term, the strait remains what it has always been: the single point through which global energy security is most exposed.
This article contains forward-looking analysis, scenario projections, and market commentary based on publicly available data and referenced third-party sources. It does not constitute financial advice. Commodity markets involve significant uncertainty, and actual outcomes may differ materially from the scenarios described. Readers should conduct their own independent analysis before making investment or operational decisions. U.S. Energy Information Administration throughput data and related chokepoint analysis is available at eia.gov.
Want to Know Which ASX Miners Are Positioned to Benefit From Rising Commodity Demand?
Geopolitical energy shocks like a Strait of Hormuz disruption ripple far beyond oil markets, accelerating demand for alternative energy minerals and domestic resource discoveries — and Discovery Alert's proprietary Discovery IQ model scans every ASX announcement in real time to deliver instant alerts on significant mineral discoveries, ensuring subscribers can act on opportunities before the broader market does. Explore how major discoveries have historically generated substantial returns on Discovery Alert's dedicated discoveries page, and begin a 14-day free trial to position ahead of the next transformative find.