
June 11, 2026
The Architecture of the World's Most Dangerous Energy Bottleneck
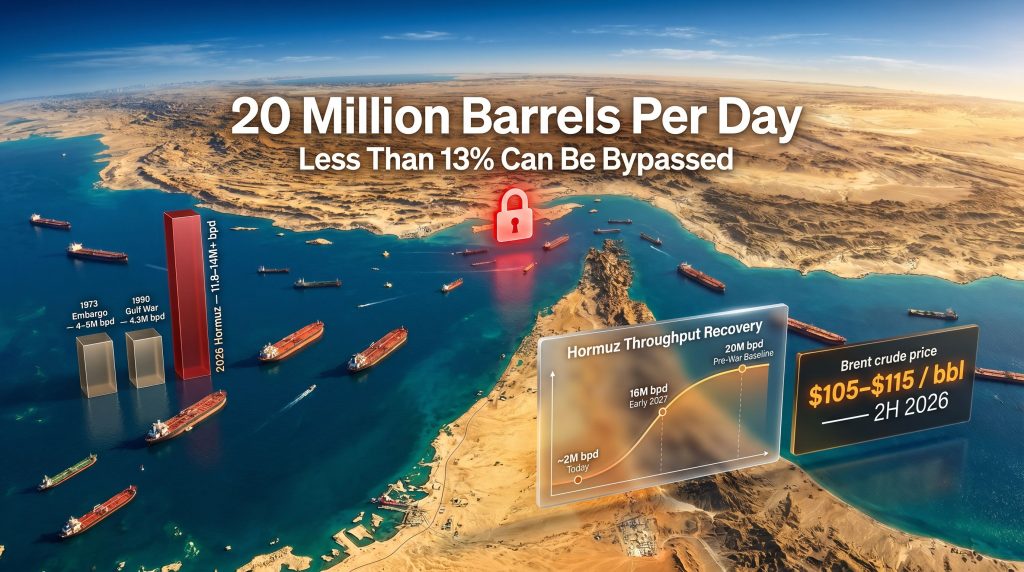
Every barrel of oil that leaves the Persian Gulf must pass through a corridor barely 33 kilometres wide at its narrowest navigable point. This is not a modern engineering choice — it is a geographic reality that has shaped global energy security for decades. The Strait of Hormuz oil supply disruption sits at the centre of current market anxiety, as the strait runs between the Iranian coast to the north and the Omani exclave of Musandam to the south. Under normal operating conditions, approximately 20 million barrels per day (bpd) transit this passage, representing roughly 20% of all global petroleum liquids consumption.
No pipeline network, alternative shipping lane, or combination of overland routes comes close to replicating this capacity. The strait is not merely important — it is structurally irreplaceable in the near term, a fact that transforms any prolonged disruption from an energy market problem into a global macroeconomic event. Furthermore, the scale of crude oil volatility now gripping markets reflects just how exposed the global economy remains to this single chokepoint.
When big ASX news breaks, our subscribers know first
Why Bypass Routes Cannot Fill the Gap
When analysts assess the resilience of global oil supply architecture, the Strait of Hormuz disruption exposes a fundamental vulnerability: the mismatch between what bypass infrastructure exists and what would actually be needed to compensate for a full closure.
| Bypass Route | Estimated Capacity | Operator | Limitation |
|---|---|---|---|
| Saudi Arabia's East-West Pipeline (Petroline) | ~5 million bpd (max design) | Saudi Aramco | Currently underutilised; limited surge capacity |
| UAE's Abu Dhabi Crude Oil Pipeline (ADCOP) | ~1.5 million bpd | ADNOC | Terminates at Fujairah; limited throughput |
| Combined Available Bypass Capacity | ~2.6 million bpd | Multiple | Far below 20 million bpd normal throughput |
Combined, these alternatives can offset less than 13% of pre-disruption Hormuz throughput. Even if every available pipeline were running at maximum capacity simultaneously, the structural shortfall would remain enormous. Full supply substitution is simply not achievable in any realistic near-term scenario.
Beyond crude oil, the strait also serves as a critical export corridor for liquefied natural gas (LNG), refined petroleum products, petrochemicals, fertilisers, and aluminium feedstocks. Qatar, the world's largest LNG exporter, routes significant volumes through Hormuz, and the broader LNG supply implications of a prolonged closure create cascading disruptions far beyond the oil market alone.
The Scale of What Has Already Been Lost
Benchmarking Against History
To understand the severity of the current Strait of Hormuz oil supply disruption, it is worth placing it in historical context. Every major supply shock of the past half-century is dwarfed by what is unfolding now.
| Disruption Event | Peak Daily Volume Lost | Duration | Estimated Cumulative Loss |
|---|---|---|---|
| 1973 Arab Oil Embargo | ~4–5 million bpd | ~6 months | ~700–900 million barrels |
| 1990–91 Gulf War (Kuwait/Iraq) | ~4.3 million bpd | ~7 months | ~900 million barrels |
| 2011 Libyan Civil War | ~1.4 million bpd | ~8 months | ~300 million barrels |
| 2019 Saudi Aramco Abqaiq Attack | ~5.7 million bpd | Days | Minimal (rapid restoration) |
| 2026 Strait of Hormuz Conflict | 11.8–14+ million bpd | Ongoing | 1 billion+ barrels and rising |
With 11.8 million bpd shut in across six Gulf producers simultaneously, Rystad Energy has characterised the current conflict as the most severe supply disruption in the modern petroleum era. For comparison, the 1973 Arab Oil Embargo removed roughly 4–5 million bpd from global markets — the current disruption is estimated to be two to three times larger in daily volume terms.
Cumulative supply losses have already surpassed one billion barrels since the conflict began, a volume equivalent to approximately 2.5 times the entire U.S. Strategic Petroleum Reserve (SPR), which holds roughly 400 million barrels at capacity, according to Rystad Energy's market analysis published through Rigzone on June 10, 2026. The Brookings Institution's analysis of chokepoint crises further underscores how structurally exposed global markets remain to Hormuz closure scenarios.
The Permanent Loss Problem
A feature largely absent from prior disruptions of comparable scale is now emerging: permanent production loss. Previous major shocks, including the Abqaiq attack of 2019, were resolved within days with minimal lasting damage. The current situation is structurally different.
Physical infrastructure damage, reservoir degradation from improper shut-in procedures, economic abandonment of marginal wells, and prolonged diplomatic impasse all compound recovery timelines in ways that earlier disruptions did not. Standard Chartered Bank's Energy Research team estimates that a meaningful portion of lost production may never return to market.
According to Standard Chartered Bank's analysis, while 30–40% of lost supply could re-enter the market within weeks of a reopening, and 80–90% within a year, between 10–20% of impaired production will require multi-year remediation, with up to 10% permanently lost through reservoir degradation or economic abandonment. (Standard Chartered Bank Energy Research, June 2026, via Rigzone)
This permanent loss component adds a layer of structural tightness to long-term supply forecasts that is often underappreciated in near-term price analysis.
The S-Curve Recovery: Why Supply Will Not Snap Back
Understanding the Recovery Mechanism
A common assumption in commodity markets is that once a disruption ends, supply returns quickly. However, the Strait of Hormuz oil supply disruption challenges this assumption directly. Analytical consensus from multiple independent research institutions points toward a phased, non-linear recovery that follows what energy economists describe as an S-curve pattern.
The S-curve model recognises three distinct phases:
- Slow initial restoration driven by logistical bottlenecks, primarily tanker repositioning
- Steeper mid-period ramp as production infrastructure comes back online sequentially
- Extended long tail for wells and facilities requiring multi-month or multi-year remediation
The first constraint is tanker repositioning. Vessels that have been rerouted, idled, or diverted during the conflict require two to three weeks to return to operational positions within the Gulf after any formal reopening announcement. This alone delays the first meaningful supply recovery by several weeks, regardless of when a diplomatic agreement is reached.
Projected Monthly Recovery Timeline (Base Case)
| Month | Estimated Recovery | Notes |
|---|---|---|
| Month of Reopening (est. mid-July 2026) | 10–15% of shut-in volumes | Tanker repositioning bottleneck |
| August 2026 | ~17.3 million bpd regional supply | Stronger production ramp begins |
| September 2026 | ~20.9 million bpd regional supply | Significant capacity restoration |
| October 2026 | ~85% of lost volumes restored | Near-recovery phase |
| January 2027 | 90–95% of pre-conflict volumes | Normalisation extending |
| Pre-conflict baseline (20 million bpd) | Not expected until 2027 | Full normalisation delayed |
Enverus Intelligence Research (EIR) models Hormuz throughput recovering from approximately 2 million bpd today to 16 million bpd by early 2027 — still meaningfully below the 20 million bpd pre-war baseline, according to EIR analysis published via Rigzone on June 10, 2026.
Each additional month of conflict, under Rystad Energy's modelling, adds approximately 350 million barrels to cumulative losses. Under the base-case scenario, which assumes a narrow diplomatic resolution by end-June 2026 and a phased Hormuz reopening from mid-July, cumulative losses are projected to approach two billion barrels by year-end 2026.
Oil Price Forecasts and Market Psychology During the Disruption
The War Premium vs. the Peace Discount
Oil markets are currently navigating two competing price forces simultaneously. On one side, the physical reality of 11.8+ million bpd shut in, tightening U.S. inventories, and ongoing conflict create sustained upward pressure. On the other, market expectations of a potential diplomatic resolution cap prices as traders price in anticipated supply restoration.
In addition, the broader oil price impacts of geopolitical tension continue to amplify uncertainty across global markets. Zaye Capital Markets (ZCM) describes oil as trading inside a tense balance between supply disruption risk and diplomatic relief, with prices rising when market focus centres on U.S.-Iran tension, Hormuz blockade pressure, and tighter U.S. inventories, but capped when traders believe a deal can reopen flows and reduce the embedded war premium. (Zaye Capital Markets analysis, June 2026, via Rigzone)
The Counterintuitive Peace Announcement Effect
One of the most important and least widely understood dynamics in the current market is what analysts describe as the bearish-then-bullish reaction sequence that would follow a formal peace announcement.
The initial market response to a U.S.-Iran deal announcement is expected to be bearish, as algorithmic and momentum traders rapidly price in anticipated supply restoration. However, the underlying physical market reality — characterised by deeply depleted OECD inventories — is expected to reassert upward price pressure within weeks as traders recognise the gap between headline optimism and actual supply recovery timelines.
EIR's analysis notes that OECD inventories are projected to remain near approximately 2.3 billion barrels through the second half of 2026, a level that, based on historical stocks-to-price relationships, is consistent with elevated Brent pricing of approximately $110 per barrel. (Enverus Intelligence Research, June 2026, via Rigzone)
Where Major Institutions Stand on Price Forecasts
| Institution | 2H 2026 Brent Forecast | 2027 Brent Forecast | Key Assumption |
|---|---|---|---|
| Enverus Intelligence Research (EIR) | $110/bbl | $105/bbl | U.S.-Iran deal by end-June; phased Hormuz reopening |
| Standard Chartered Bank | Elevated (multi-month lag) | Gradual normalisation | 30–40% supply return in weeks; 80–90% within 12 months |
| U.S. Energy Information Administration (EIA) | Elevated near-term | Partial normalisation | Hormuz effectively closed near-term; Q3 2026 partial resumption |
| Zaye Capital Markets | Range-bound with upside bias | Not provided | Tension between disruption risk and diplomatic relief |
EIR's updated outlook is explicitly characterised as a higher-for-longer call, with the reasoning that even with a path toward reopening, the strait does not recover overnight and the market does not rebuild its inventory cushion quickly either. The analysis from EIR, published via Rigzone on June 10, 2026, projects that low stocks and gradual normalisation will keep Brent supported well into 2027. Consequently, the oil price rally dynamics observed in prior periods of supply stress offer only partial guidance for what lies ahead.
The Diplomatic Pathway and Why It Remains Fragile
Three Scenarios for What Comes Next
The single most important variable in both supply recovery timelines and oil price trajectories is the diplomatic track between the U.S. and Iran. A fragile memorandum of understanding had briefly raised market expectations of a negotiated resolution, but both parties have since returned to active military engagement, materially narrowing the diplomatic pathway and widening the probability of a prolonged supply shock, according to Rystad Energy's analysis via Rigzone.
Scenario 1: Phased Resolution (Base Case, Most Likely)
- U.S.-Iran deal reached by late Q2 or early Q3 2026
- Hormuz begins partial reopening from mid-July 2026
- Full throughput normalisation delayed until early 2027
- Brent remains in the $105–$115/bbl range through 2026
- Cumulative losses approach two billion barrels by year-end
Scenario 2: Prolonged Conflict (Tail Risk)
- No diplomatic resolution achieved in 2026
- Each additional month adds approximately 350 million barrels to cumulative losses
- Cumulative losses could approach or exceed two billion barrels by year-end regardless
- Brent pricing could test levels not seen since the post-COVID supply crunch
- Permanent loss component grows with each month of continued disruption
Scenario 3: Rapid Resolution (Low Probability)
- Comprehensive peace agreement reached; rapid Hormuz reopening
- Initial bearish price reaction as traders price in supply return
- Physical supply recovery still lags market pricing by 2–3 months
- Brent retreats toward $85–$90/bbl range by mid-2027 as inventories rebuild
- Structural damage to reservoir capacity limits full production restoration
The next major ASX story will hit our subscribers first
Spillover Effects: Beyond the Oil Price
The Petrochemical and Agricultural Transmission Chain
The current disruption is often framed primarily as an energy price story, but its second-order effects extend across multiple industrial and agricultural supply chains in ways that eventually reach consumers globally. Furthermore, OPEC market influence on production decisions adds another layer of complexity to how quickly the broader market can respond.
Key industrial inputs directly affected include:
- Fertilisers (ammonia and urea) — critical inputs for global agricultural production, primarily sourced from Gulf-based natural gas feedstocks
- Plastics and polymers — petrochemical feedstocks essential for packaging, automotive components, electronics manufacturing, and construction materials
- Aluminium smelting — energy-intensive processes heavily dependent on Gulf-sourced natural gas
- LNG exports — Qatar's position as the world's largest LNG exporter means significant volumes of natural gas supply are simultaneously disrupted
The macroeconomic transmission of these disruptions follows predictable but lagged timelines. Petrochemical input cost inflation flows through to consumer goods pricing with a 3–6 month lag, while agricultural input cost increases from fertiliser disruption translate into food price inflation with a 6–12 month lag. The EIA's energy market data illustrates how supply disruptions of this nature ripple through downstream sectors with compounding effects. Central banks in energy-importing economies face a particularly difficult policy environment as a result.
Regional Vulnerability Assessment
| Region/Country | Hormuz Dependency | Primary Risk Channel |
|---|---|---|
| Japan | High (~90% of oil imports via Gulf) | Energy costs, industrial input inflation |
| South Korea | High (~70% of oil imports via Gulf) | Refining margins, petrochemical costs |
| India | Moderate-High | Fuel subsidies, current account pressure |
| China | Moderate-High | Manufacturing input costs, energy security |
| Europe | Moderate | LNG pricing, industrial energy costs |
| United States | Lower (domestic production buffer) | Global price spillover, refined product costs |
Asian economies face the most acute exposure. Japan and South Korea in particular, with their high dependency on Gulf crude, are navigating a stagflationary policy dilemma: rising energy-driven inflation alongside growth headwinds from elevated input costs across manufacturing sectors.
Frequently Asked Questions: Strait of Hormuz Oil Supply Disruption
How much oil normally passes through the Strait of Hormuz?
Under pre-conflict conditions, approximately 20 million barrels per day transited the Strait of Hormuz, representing roughly 20% of global petroleum liquids consumption and making it the single most important oil transit chokepoint in the world.
How many barrels have been lost due to the disruption?
Cumulative supply losses have surpassed one billion barrels, equivalent to approximately 2.5 times the capacity of the entire U.S. Strategic Petroleum Reserve. Under the base-case scenario, losses are projected to approach two billion barrels by year-end 2026, according to Rystad Energy.
Can pipeline alternatives replace Hormuz oil flows?
No. Combined available pipeline bypass capacity amounts to approximately 2.6 million barrels per day, covering less than 13% of normal Hormuz throughput. There is no viable full-scale alternative to the strait in the near term.
How long will supply recovery take after Hormuz reopens?
Recovery is expected to follow an S-curve trajectory. Under the base case:
- 10–15% of shut-in volumes restored in the first month
- ~85% restored by October 2026
- Full normalisation not expected until early 2027
- Up to 10% of lost volumes may be permanently unrecoverable
What is the oil price outlook during the disruption?
Brent crude forecasts from major research institutions range from $105 to $115 per barrel through the second half of 2026, with 2027 averages projected around $105/bbl, reflecting a higher-for-longer price environment driven by depleted OECD inventories and gradual supply normalisation.
This article incorporates analysis from Rystad Energy, Enverus Intelligence Research, Standard Chartered Bank, the U.S. Energy Information Administration, and Zaye Capital Markets, as reported by Rigzone on June 10, 2026. All price forecasts, supply projections, and scenario analyses represent the views of the cited institutions and are subject to material revision as geopolitical conditions evolve. Nothing in this article constitutes financial or investment advice. Past price relationships and historical analogies may not reliably predict future outcomes in a disruption of this unprecedented scale.
For ongoing market coverage and analyst updates on global oil supply dynamics, Rigzone provides comprehensive industry reporting at Rigzone.com.
Want to Stay Ahead of Commodity Discoveries Driven by Energy Market Volatility?
As oil supply disruptions reshape global commodity markets, Discovery Alert's proprietary Discovery IQ model scans ASX announcements in real time, delivering instant alerts on significant mineral discoveries across more than 30 commodities — turning complex market signals into actionable investment opportunities. Explore how historic discoveries have generated substantial returns on Discovery Alert's dedicated discoveries page, and begin your 14-day free trial today to position yourself ahead of the broader market.