July 15, 2026
The Quiet Before the Storm: Understanding Oil Supply Shocks Before They Become Obvious
Throughout financial history, the most transformative commodity price movements have rarely announced themselves clearly. They begin with a structural shift that most market participants interpret as temporary, followed by a slow and painful repricing process as reality eventually overwhelms the consensus narrative. The 1973 OPEC embargo, the 1979 Iranian Revolution, the 2008 commodity supercycle peak all followed the same psychological arc: initial denial, gradual recognition, then violent repricing that rewarded only those who positioned early.
The Strait of Hormuz oil supply shock of 2026 is following that same arc. And by most structural indicators, markets are still somewhere between denial and reluctant recognition.
When big ASX news breaks, our subscribers know first
Why the Strait of Hormuz Is the World’s Most Critical Energy Chokepoint
The Architecture of a Global Supply Artery
To understand the severity of what is unfolding, it helps to first grasp just how irreplaceable the Strait of Hormuz is within the global energy system. This narrow passage between Iran and Oman functions as the single most concentrated energy logistics node on Earth, with no viable large-scale alternative for the majority of Gulf producer export volumes.
Under pre-conflict conditions, the strait handled approximately 20 million barrels per day (bpd), accounting for roughly 20% of all global oil flows. The commodities transiting this corridor extend well beyond crude oil, encompassing liquefied natural gas (LNG), refined petroleum products, and fertilizer precursors that underpin global agricultural production. Furthermore, understanding crude oil price trends helps contextualise just how dramatically this disruption diverges from the pre-conflict baseline.
The dependency profile of key consuming nations makes the strait’s vulnerability even more acute:
- China, India, Japan, and South Korea collectively absorbed between 69% and 84% of all Hormuz-transited volumes under normal operating conditions.
- Japan and South Korea carry particularly concentrated exposure given their minimal domestic production capacity and historically high refinery utilisation rates.
- India faces compounding vulnerability because of its acute sensitivity to fuel and fertilizer cost inflation, both of which feed directly into consumer living standards and political stability.
- No alternative routing solution exists that can replicate Hormuz-scale throughput for the Gulf’s major producers; existing pipeline alternatives serve only a fraction of total export volumes.
February 28, 2026: The Day the Flows Stopped
The current disruption traces directly to U.S. and Israeli military strikes against Iran that triggered a closure sequence beginning on February 28, 2026. Iranian retaliatory actions targeted energy infrastructure across the region with unusual precision, striking three of the most strategically significant export nodes in the Gulf:
- Qatar’s Ras Laffan LNG terminal, one of the largest single-site LNG export facilities in the world.
- Saudi Arabia’s Yanbu refining complex, a critical downstream processing and export hub on the Red Sea.
- The UAE’s Fujairah export hub, historically a key tanker transit and bunkering point outside the strait itself.
Tanker traffic through the strait collapsed to below 10% of normal operational capacity within weeks of the conflict’s escalation. As of early May 2026, the strait remains effectively closed, representing the longest sustained closure in its modern history and a disruption that has already exceeded the severity of both the 1973 OPEC embargo and the 1979 Iranian Revolution in terms of barrels removed from accessible global supply. The IEA’s framework on oil security provides essential context for understanding how emergency response mechanisms are being stress-tested by the current crisis.
Quantifying the Supply Shock: How 2026 Compares to Historical Oil Crises
The Scale of What Has Been Removed From Markets
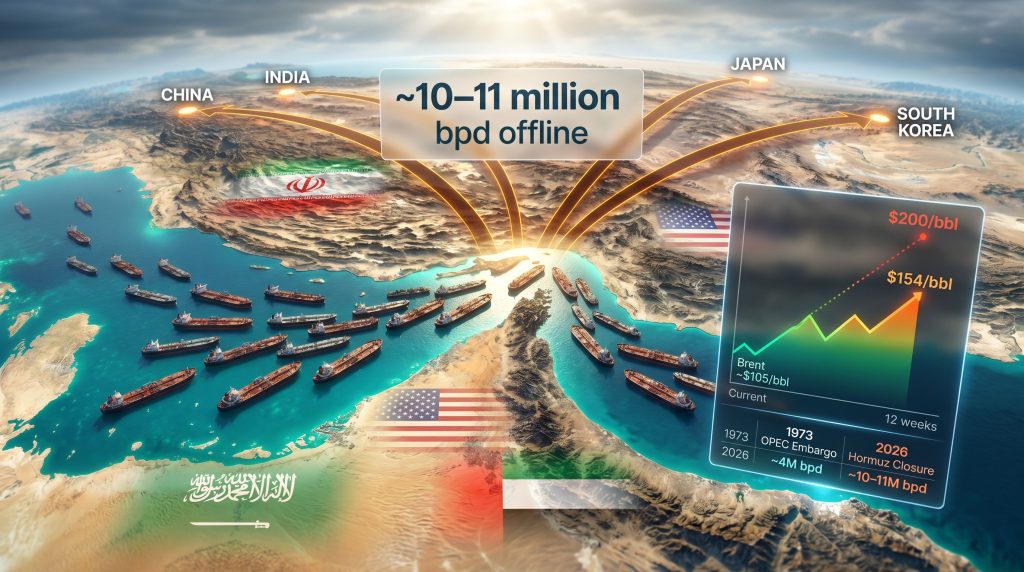
The Strait of Hormuz oil supply shock’s sheer magnitude separates it from every precedent in modern energy market history. Approximately 10 to 11 million bpd, representing roughly 11% of total global supply, is currently either offline or stranded without viable export pathways.
| Crisis Event | Estimated Supply Removed | Duration | Peak Price Impact |
|---|---|---|---|
| 1973 OPEC Embargo | ~4 million bpd | ~5 months | +300% |
| 1979 Iranian Revolution | ~5.6 million bpd | ~12 months | +150% |
| 1990 Gulf War | ~4.3 million bpd | ~6 months | +120% |
| 2026 Hormuz Closure | ~10–11 million bpd | 2+ months ongoing | Brent ~$105/bbl and rising |
The comparison is striking. Even the most severe historical precedents involved supply losses roughly half the size of what is currently absent from global markets.
The Trapped Capacity Problem
What makes this disruption structurally distinct from prior crises is the geographic trap it has created for the world’s two most important holders of spare production capacity. Saudi Arabia and the UAE together hold the overwhelming majority of global spare production capacity, but both nations’ primary export terminals sit behind the closed strait. Their ability to increase output to compensate for disruption elsewhere is consequently neutralised while those export pathways remain blocked.
The knock-on consequences extend further:
- Storage tanks across the Gulf region are approaching physical capacity as stranded tankers accumulate with no viable discharge destinations.
- Even in a scenario where a ceasefire is reached immediately, independent analysts estimate at least two months would be required before steady export flows resume.
- Damaged infrastructure at key terminals could push full recovery timelines toward six months or beyond before pre-conflict throughput levels are restored.
Oil Price Dynamics: Where Markets Stand and Where They Could Go
Brent crude closed at approximately $105 per barrel in the most recent trading session. That figure, while elevated, may still substantially underestimate the structural reality being built in physical supply markets.
If the Strait of Hormuz remains closed for 12 weeks, energy market analysts project Brent crude prices reaching approximately $154 per barrel based on current supply-demand modelling. In a severe escalation scenario, $200 per barrel can no longer be dismissed as an analytical outlier.
Global demand has slumped by an estimated 5.3 million bpd this quarter, the sharpest quarterly demand contraction in five years, driven by price-induced demand destruction rather than voluntary conservation. U.S. strategic petroleum reserve releases are being consumed at roughly double the rate originally modelled, raising legitimate questions about reserve adequacy if the closure extends through Q3 or Q4 of 2026.
Which Economies Face the Greatest Exposure to the Hormuz Supply Shock?
Asia’s Structural Vulnerability
No region faces more concentrated exposure to the Strait of Hormuz oil supply shock than the major Asian importing economies. China, India, Japan, and South Korea have built their industrial energy systems around dependable Gulf crude access, with import dependency on Hormuz-transited crude ranging from 60% to over 80% of total national oil imports.
Some Iranian crude continues reaching Asian buyers through alternative routing, however volumes remain wholly insufficient to offset the structural shortfall now embedded in regional supply balances. Japan and South Korea, with their combination of limited domestic production, high refinery utilisation rates, and relatively thin strategic reserve buffers, face the most acute near-term supply stress within the bloc.
India’s exposure operates through a different but equally serious transmission mechanism. Fuel costs and fertilizer prices feed directly into consumer living costs and farm economics with speed and political sensitivity that few other large economies match.
The Western Buffer and Its Limits
For Western economies, the immediate shock has been partially absorbed by coordinated International Energy Agency (IEA) strategic petroleum reserve releases. The United States and allied nations have deployed reserve drawdowns at an accelerating pace to cushion near-term price pressure.
However, two critical vulnerabilities are becoming apparent:
- SPR drawdown rates are now running at approximately double the pace originally modelled, creating meaningful questions about reserve adequacy in an extended closure scenario.
- Insurance markets have effectively withdrawn from Hormuz-adjacent shipping lanes without Iranian diplomatic clearance. War risk premiums have reached levels that make commercial navigation economically unviable for most operators, regardless of military escort availability. U.S. naval escorts are providing limited coverage for specific vessels, but this cannot substitute for normal commercial tanker throughput at scale.
Beyond Oil: The Fertilizer and Food Security Dimension
An Underappreciated Transmission Mechanism
The energy market narrative around the current crisis has dominated market commentary, but the agricultural supply chain dimension may ultimately prove equally consequential. A significant share of global fertilizer trade, including ammonia, urea, and potash shipments, has historically transited the strait. Prolonged closure directly threatens the agricultural input supply chain that underpins global food production.
The transmission from energy disruption to food inflation does not operate instantaneously. It moves through a sequence of lagged decisions that can create false comfort in the early stages of a disruption:
- Fertilizer supply tightens and freight costs escalate, pushing input costs higher for farmers globally.
- Farmers face compressed margins and respond by reducing planted area or input intensity, cutting back on the fertilizer, fuel, and crop protection products that drive yields.
- Crop yield projections fall as planting decisions reflect the new cost reality, tightening soft commodity inventory buffers.
- Wholesale food prices begin rising three to nine months after the initial energy shock, as the reduced input decisions of earlier planting seasons work through to harvest volumes.
- Consumer food inflation appears in official CPI data, typically after the optimal market positioning window has already closed for most investors.
Energy scarcity has historically become food scarcity faster than most market participants anticipate. The current configuration, with fertilizer logistics disrupted and climate stress elevated simultaneously, represents a particularly high-risk environment for global food supply adequacy.
The Climate Compounding Factor
The agricultural stress building from the Hormuz disruption does not exist in isolation. El Niño weather pattern uncertainty is amplifying climate-related production risk across key agricultural growing regions simultaneously, creating a compounding squeeze on global food supply adequacy that operates independently of energy markets but compounds their effect.
Institutional positioning across soft commodity markets reflects this growing awareness. Wheat, corn, soybeans, sugar, coffee, and cocoa are all attracting elevated institutional attention as the downstream pressure from energy and climate stress builds simultaneously across these markets.
How Oil Markets Are Pricing the Crisis: The Mispricing Thesis
Structural Supply Regime Change vs. Temporary Disruption
A significant body of market analysis suggests that oil markets are still partially pricing the Hormuz closure as a temporary disruption rather than as the structural supply regime change that physical market indicators increasingly suggest it represents. This creates a potential asymmetry: if consensus shifts toward accepting a prolonged closure as the base case, price repricing could be rapid and severe.
The phrase circulating across institutional trading desks captures this scepticism precisely. NACHO, meaning “Not A Chance Hormuz Opens,” has emerged as the shorthand for growing doubt that Washington can engineer a rapid diplomatic resolution with Iran and restore normal commercial flows before meaningful economic damage propagates through inventories, fuel markets, food prices, and global trade relationships. It stands in deliberate contrast to the earlier TACO framework (“Trump Always Chickens Out”) that defined market psychology during the tariff dispute period, suggesting that traders are drawing a distinction between negotiable trade disputes and the considerably more complex military confrontation now unfolding. In addition, the trade war’s impact on oil markets has already conditioned investor psychology in ways that make this new disruption harder to read clearly.
Scenario Pricing Framework
| Scenario | Duration | Brent Crude Projection | Global GDP Impact |
|---|---|---|---|
| Short disruption | Less than 6 weeks total | $105 to $120/bbl | Modest; SPR buffers hold |
| Medium disruption | 3 to 6 months | $130 to $154/bbl | Recession risk elevated |
| Extended closure | 6 to 12+ months | $154 to $200/bbl | Severe global contraction |
The Demand Destruction Paradox
At sufficiently high price levels, demand destruction becomes self-limiting for price escalation. However, the economic damage from rationing and forced consumption reduction along the path to that ceiling is severe and unevenly distributed. Developed economies with large strategic reserves can absorb disruption for longer; developing economies face immediate rationing scenarios that impose direct humanitarian as well as economic costs.
Physical markets are already sending signals that the consensus narrative of temporary disruption is misaligned with reality. Inventories are tightening. Freight routes are under pressure. Energy flows are being actively weaponised as a geopolitical instrument. The institutional buyers who understand this dynamic are already repositioning. The broader investment community remains, in many analyst assessments, dangerously behind the curve.
The next major ASX story will hit our subscribers first
What Historical Oil Shocks Teach Us About the 2026 Crisis
The Pattern of Market Regime Change
Commodity supercycles do not announce themselves with clarity. The consistent historical pattern involves a structural supply constraint that markets initially interpret as temporary, followed by a slow recognition phase, and then a rapid repricing event as the consensus view shifts. Each of the major energy crises of the past five decades followed this sequence:
- 1973 OPEC Embargo: Governments and investors who moved early on strategic stockpiling and alternative supply development captured significant long-term advantages. Those who waited for confirmation of the structural shift faced prolonged economic disruption without the buffer of early positioning.
- 1979 Iranian Revolution: The supply shock was initially underestimated by consensus market participants. The full price impact took twelve to eighteen months to fully materialise, rewarding those who recognised the structural nature of the shift early in the disruption rather than waiting for the price move to become obvious.
- 2008 Commodity Supercycle Peak: Crude oil reached $147 per barrel in July 2008 before the financial crisis triggered a severe demand collapse. The run-up phase rewarded early positioning across the entire commodity complex; those who waited for confirmation found themselves chasing an already-crowded trade.
The biggest danger in a supply shock environment is not volatility itself. It is waiting for confirmation that the structural shift has occurred. By the time the supply shock becomes universally obvious, the most profitable positioning opportunities have typically already closed.
Regime Change Signals Currently Observable
Several structural indicators suggest the 2026 Hormuz disruption is transitioning from a temporary geopolitical event into a more durable supply regime shift:
- Governments globally are accelerating strategic resource stockpiling at a pace not seen since the immediate post-2022 energy security recalibration.
- Export restrictions on energy and food commodities are increasing across multiple jurisdictions simultaneously.
- Energy security has been formally reclassified as a national security priority in the United States, European Union, Japan, South Korea, and India.
- The multipolar geopolitical environment means that traditional diplomatic resolution mechanisms operate more slowly and with less certainty than in previous decades when U.S. diplomatic leverage was more decisive.
The Full Commodity Complex Exposure Map
Primary Exposure: Energy Markets
The most direct and immediate exposure to this supply disruption sits within the energy complex:
- Crude oil (Brent and WTI): Direct supply loss with the highest immediate price sensitivity of any asset class.
- LNG and natural gas: The Ras Laffan disruption removes a significant share of global LNG export capacity. The LNG supply implications are particularly acute for European and Asian spot markets, which depend on flexible spot supply to supplement contracted volumes.
- Diesel and jet fuel: Downstream refinery disruption compounds crude supply tightness, with freight and aviation cost inflation accelerating rapidly through the logistics and transportation sectors.
- Petrochemicals: Manufacturing input cost inflation is building across plastics, synthetic materials, and industrial chemical supply chains, with consequences that extend well beyond the energy sector itself.
Secondary Exposure: Agricultural Markets
- Ammonia and urea fertilizers: Direct logistics disruption through the strait creates supply tightness for the most critical agricultural input commodities.
- Wheat, corn, and soybeans: Indirect exposure through fertilizer cost transmission and freight cost inflation, compounded by climate-driven yield uncertainty in key producing regions.
- Sugar, coffee, and cocoa: Climate and energy cost compounding is driving increasing institutional positioning across these markets as the downstream pressure from the energy disruption works through agricultural supply chains.
Tertiary Exposure: Industrial Metals
- Copper: Energy-intensive production processes mean smelting and refining costs rise materially with sustained fuel price elevation.
- Aluminium: Among the most energy-intensive metals to produce at scale, aluminium carries particularly high sensitivity to sustained energy price increases that compress smelter economics globally.
- Gold and silver: Traditional safe-haven demand dynamics accelerate in sustained geopolitical risk environments, with both metals historically benefiting from the combination of inflation risk and institutional uncertainty that characterises the current environment. Furthermore, commodities investment opportunities across this broader complex are attracting increasing institutional scrutiny as the disruption deepens.
The Long-Term Structural Consequences: Why Pre-2026 Norms May Not Return
Permanent Risk Premium Repricing
Even if the Strait of Hormuz were to reopen tomorrow, the broader structural consequences of the 2026 disruption are likely to persist in market pricing for years. The reliability premium historically assigned to Saudi Arabia and the UAE as stable swing producers and supply stabilisers has been materially eroded by events. Post-conflict, a permanent geopolitical risk premium is expected to be embedded in Gulf crude pricing regardless of whether physical flows fully normalise.
Oxford Energy analysis indicates that even after the strait reopens, full restoration of pre-disruption export flows could require six months or more, accounting for infrastructure repair requirements, tanker fleet repositioning, and insurance market normalisation across Hormuz-adjacent shipping lanes. The Oxford Energy analysis on this oil shock provides a detailed structural assessment of why recovery timelines remain deeply uncertain.
The Supply Chain Fragmentation Acceleration
The crisis is accelerating pre-existing trends toward supply chain regionalisation, strategic stockpiling, and resource nationalism that were already reshaping global trade patterns before 2026. Governments are increasingly treating energy, food, and critical minerals as strategic assets to be secured through policy rather than allocated through open markets.
This structural shift carries long-term implications for commodity price volatility, trade route economics, and industrial investment patterns that extend well beyond the immediate oil market impact. The psychological and strategic recalibration underway among major Asian importing nations, toward alternative suppliers, expanded strategic reserve buffers, and accelerated energy diversification, represents a demand structure shift that will persist regardless of when the physical disruption resolves. Consequently, the role of OPEC in global oil markets is itself being fundamentally reassessed as the organisation’s ability to stabilise supply is tested by geography as much as by policy.
Key Metrics at a Glance
| Metric | Data Point |
|---|---|
| Pre-conflict daily throughput | ~20 million bpd |
| Current estimated supply offline | ~10 to 11 million bpd |
| Closure duration (as of May 2026) | ~2 months |
| Current Brent crude price | ~$105/bbl |
| 12-week closure price projection | ~$154/bbl |
| Severe escalation scenario | Up to $200/bbl |
| Global demand contraction (Q1 2026) | ~5.3 million bpd |
| Primary affected import markets | China, India, Japan, South Korea |
| Estimated post-reopening recovery | 2 to 6+ months |
| Historical comparison | Exceeds 1973 and 1979 crises in volume removed |
Frequently Asked Questions: Strait of Hormuz Oil Supply Shock
How much oil flows through the Strait of Hormuz under normal conditions?
Approximately 20 million barrels per day transited the strait before the current conflict, representing roughly 20% of total global oil supply and making it the single most important energy logistics chokepoint in the world.
How long has the strait been effectively closed in 2026?
As of early May 2026, the closure has been in effect for approximately two months following the escalation sequence that began on February 28, 2026, making it the longest sustained closure in the strait’s modern history.
What is the current price impact and where could prices go?
Brent crude is trading at approximately $105 per barrel. Independent analysts project prices reaching approximately $154 per barrel if the closure extends to twelve weeks, with $200 per barrel scenarios considered plausible under severe escalation conditions.
Which countries are most exposed to the disruption?
China, India, Japan, and South Korea face the most acute supply shortages, having collectively absorbed between 69% and 84% of pre-conflict Hormuz oil volumes under normal trade conditions.
How does the Hormuz disruption affect food prices?
Disruption to fertilizer logistics through the strait, combined with rising fuel costs across the agricultural supply chain, creates a lagged but significant transmission mechanism into planting decisions, crop yields, and ultimately consumer food prices. The full impact typically appears in CPI data three to nine months after the initial energy shock.
How does the 2026 crisis compare to previous oil supply shocks?
At approximately 10 to 11 million bpd removed from accessible supply, the 2026 Hormuz closure exceeds the supply disruption scale of both the 1973 OPEC embargo and the 1979 Iranian Revolution, making it the largest single-event supply shock in modern oil market history by volume removed.
When could the strait realistically reopen?
No imminent reopening pathway is visible as of early May 2026. Even following a hypothetical ceasefire, analysts estimate a minimum of two months before steady export flows could resume, with full infrastructure recovery potentially requiring six months or beyond.
This article contains forward-looking analysis, market projections, and scenario-based modelling drawn from independent institutional sources including the U.S. Energy Information Administration and Oxford Energy. All price projections represent analytical scenarios rather than guaranteed outcomes. Commodity markets involve significant risk and past performance during historical supply shocks does not guarantee comparable outcomes in the current environment. Nothing in this article constitutes financial advice.
Want to Track the ASX Stocks Positioned for the Commodity Surge?
As energy, agricultural, and industrial metal markets reprice in response to the Strait of Hormuz disruption, Discovery Alert’s proprietary Discovery IQ model delivers real-time alerts on significant ASX mineral discoveries — instantly identifying actionable opportunities across the full commodity complex before the broader market catches up. Explore historic discoveries and their returns to understand the scale of what early positioning can achieve, then begin your 14-day free trial at Discovery Alert to secure your market-leading edge.