
May 20, 2026
When Every Barrel of Spare Capacity Sits Behind a Closed Gate
There is a long-standing assumption built into the architecture of global energy security: that in times of crisis, spare production capacity can be activated to buffer the market. For decades, that assumption held. Saudi Arabia and the UAE maintained millions of barrels per day of idle capacity precisely for moments when geopolitical disruption threatened supply stability. It was the system's safety valve.
The Strait of Hormuz oil supply shock of 2026 has exposed that safety valve as a design flaw. The spare capacity exists. It simply cannot reach the world because it sits on the wrong side of a blockaded chokepoint. Understanding oil price volatility trends in the lead-up to this crisis helps contextualise just how dramatically conditions have deteriorated.
When big ASX news breaks, our subscribers know first
The Chokepoint That Underpins One-Fifth of Global Oil Flows
A Single Passage, an Outsized Consequence
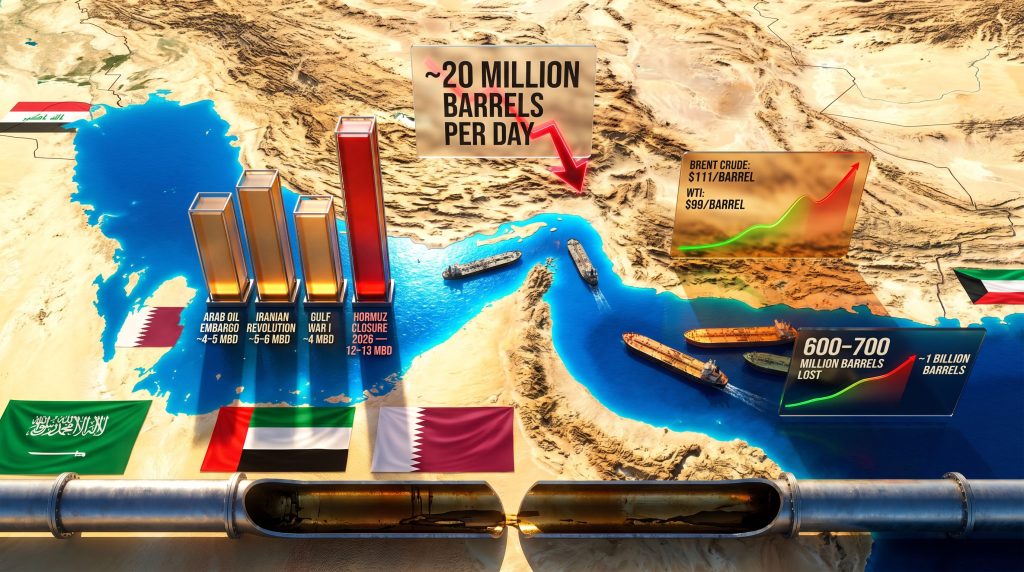
Before the conflict began, approximately 20 million barrels of crude oil and petroleum products transited the Strait of Hormuz every single day, according to reporting by Tsvetana Paraskova for OilPrice.com. That volume represents roughly one-fifth of total global oil supply flows and an even greater share of globally traded liquefied natural gas.
The nations whose export economics depend almost entirely on this single maritime corridor form a who's who of global energy production:
- Saudi Arabia
- The United Arab Emirates
- Iraq
- Kuwait
- Qatar
- Bahrain
- Iran
No alternative route capable of handling remotely comparable volumes exists. The Sumed pipeline and the East-West pipeline running across Saudi Arabia to Yanbu provide limited bypass capacity, but neither was designed nor scaled to substitute for the full throughput of the Strait. When Hormuz closes, the Gulf's oil is effectively landlocked. Furthermore, the LNG supply implications of this closure extend far beyond crude markets alone.
How 2026 Compares to Every Previous Oil Shock in History
The scale of the current Strait of Hormuz oil supply shock has no modern precedent. A comparative look at historical disruptions reveals just how structurally different this event is:
| Supply Shock Event | Year | Estimated Disruption | Duration |
|---|---|---|---|
| Arab Oil Embargo | 1973 | ~4-5 mbd | ~6 months |
| Iranian Revolution | 1979 | ~5-6 mbd | ~12 months |
| Gulf War I | 1990-91 | ~4 mbd | ~7 months |
| Hormuz Closure (2026) | 2026 | 10+ mbd (confirmed); 12-13 mbd modelled | 60+ days and ongoing |
The confirmed figure from OilPrice.com reporting places the forced shut-in at over 10 million barrels per day across Middle Eastern producers. Modelled estimates that incorporate upstream production losses, LNG disruptions, and associated infrastructure impacts push that figure toward the 12 to 13 million barrel range used in broader scenario analysis.
Even at the conservative confirmed threshold, the 2026 closure represents a supply withdrawal roughly two to three times larger than any previous oil shock on record. The historical models that policymakers, traders, and analysts have relied upon to forecast resolution timelines and recovery trajectories are only partially applicable here.
The cumulative barrels already lost cannot be recovered even under the most optimistic reopening scenario. By late April 2026, Vitol CEO Russell Hardy told the FT Commodities Global Summit in Lausanne that losses had already reached between 600 million and 700 million barrels, with total losses projected to approach 1 billion barrels once recovery ramp-up timelines are factored in. As Hardy noted, the pathway back to steady export flows takes time even after the Strait itself reopens, citing the irreversibility of losses already baked into the supply picture. (Source: Tsvetana Paraskova, OilPrice.com, April 28, 2026)
How the Crisis Escalated Into the Largest Oil Supply Disruption Ever Recorded
From Military Strike to Maritime Emergency
On February 28, 2026, U.S. and Israeli military operations targeting Iran triggered a cascade of retaliatory maritime disruptions that rapidly transformed a regional conflict into a global energy emergency. Two months later, the Strait of Hormuz remained closed to the vast majority of commercial tanker traffic.
Iran's asymmetric response exploited a fundamental vulnerability of maritime trade: the economics of ship insurance and trade financing respond to perceived threat as much as to physical blockade. A combination of vessel harassment using drone swarms and patrol boats, alongside strikes on critical regional infrastructure, was sufficient to halt commercial traffic without requiring a complete physical barrier across the Strait. According to analysis of the Strait of Hormuz crisis, the speed at which commercial insurers withdrew cover proved decisive in halting traffic.
The targeted infrastructure strikes extended the disruption well beyond the Strait itself:
- Qatar's Ras Laffan LNG terminal: One of the world's largest LNG export facilities, directly targeted, choking Qatari LNG exports
- Saudi Arabia's Yanbu export terminal: A key Red Sea crude export facility struck during the conflict
- UAE's Fujairah oil hub: A critical bunkering and storage node in the Gulf of Oman
The Mechanics of a Forced Shut-In
As the closure extended beyond initial expectations, onshore storage facilities across Gulf producers reached capacity limits. Producers faced a binary choice: continue producing with nowhere to send the crude, or execute production shut-ins. For most, the latter became unavoidable.
The crucial distinction that would define recovery timelines lay in how those shut-ins were executed. As SLB CEO Olivier Le Peuch explained on the company's Q1 2026 earnings call on April 24, 2026, producers that carried out orderly, controlled shutdowns created conditions for faster restarts, potentially within days or weeks. Those where production was halted abruptly, under pressure of conflict escalation, created a different set of complications entirely, requiring extended maintenance periods and additional waiting time before any ramp-up could begin. (Source: SLB Q1 2026 Earnings Call Transcript, The Motley Fool)
Halliburton CEO Jeff Miller, speaking on his company's Q1 2026 earnings call on April 21, 2026, reinforced a principle that oilfield services professionals understand well: the longer a well remains shut in, the more complex the restoration process becomes. Miller further described the Middle East situation as carrying meaningful and long-lasting implications for the global energy sector as a whole. (Source: Halliburton Q1 2026 Earnings Transcript, The Motley Fool)
What a 10 to 13 Million Barrel Disruption Does to Global Markets
Immediate Price and Inventory Consequences
The market response was swift and severe. Brent crude surpassed $111 per barrel as analysts raised forecasts in response to the Hormuz stalemate, while WTI crude traded above $99 per barrel, according to OilPrice.com market data. Goldman Sachs revised oil price projections upward multiple times within weeks, with JPMorgan subsequently stating that prices still had further room to rise.
Beneath the headline price movements, a quieter crisis was accelerating. Global crude stockpiles began drawing down toward historically depleted levels. The depletion dynamic carries a compounding effect that many market participants underestimate:
- Crude oil takes weeks to transit from production site to refinery
- Reopening the Strait does not immediately restore supply to end consumers
- Initial export volumes, even under an optimistic reopening scenario, would remain below pre-conflict levels during the ramp-up phase
- Regions unable to compete financially in a premium-bid market environment face physical fuel shortages
Asia bore the first and most severe impact on the demand side, with LNG imports falling to a 7-year March low as Qatari supply was choked by infrastructure disruptions and blockade conditions, according to OilPrice.com. Japan's top utility JERA moved defensively to secure LNG supply through July as a buffer against further deterioration.
The Spare Capacity Trap: A Structural Design Flaw Laid Bare
The deepest structural irony of this crisis is that the mechanism specifically designed to buffer supply shocks has been rendered inaccessible by the shock itself. OPEC's market influence, long considered a stabilising force, has consequently been neutralised at precisely the moment it was most needed.
Russell Hardy, CEO of Vitol, the world's largest independent oil trader, stated at the FT Commodities Global Summit in Lausanne that all of the world's spare production capacity sits behind the Strait of Hormuz today, making the impact of the closure direct and comprehensive. Saudi Arabia and the UAE collectively hold virtually all meaningful global spare capacity, and both nations are geographically dependent on Hormuz for crude export. (Source: Tsvetana Paraskova, OilPrice.com, April 28, 2026)
The alternative supply picture offers limited relief:
| Alternative Source | Realistic Capacity Addition | Key Constraints |
|---|---|---|
| U.S. Shale (Permian, Eagle Ford) | Limited incremental uplift | Lead times, rig count, infrastructure bottlenecks |
| Russia | Already near operational capacity | Sanctions exposure, Ukrainian drone strikes on facilities |
| Venezuela | Post-Maduro recovery underway (Eni, Repsol investments) | Infrastructure decay, political uncertainty |
| IEA-Coordinated SPR Releases | Short-term buffer only | Cannot substitute a sustained 10+ mbd shortfall |
| Canadian Oil Sands | Marginal incremental volumes | Pipeline capacity and processing constraints |
Recovery Scenarios: Three Pathways Forward
The Well Restart Problem Most Analysts Underestimate
Before examining the geopolitical scenarios, it is worth understanding a technical reality that shapes all recovery timelines regardless of diplomatic outcomes. Oil wells are not switches. Reservoir pressure management, formation integrity, and wellbore condition all deteriorate in ways that vary significantly depending on shut-in duration, pre-existing reservoir characteristics, and the method of closure.
The IEA's April 2026 monthly report identified four prerequisites for supply restoration: improved security and political stability, the resumption of Hormuz trade flows, the mobilisation of skilled labour and contractor resources, and the normalisation of supply chains, tanker insurance markets, and trade financing. Fields with low recovery rates and inherent flow management challenges may face delays exceeding six months even after the Strait reopens unconditionally, the agency noted. Under a full reopening scenario, the IEA estimated approximately two months would be required to re-establish steady export flows, with initial volumes remaining below pre-conflict levels throughout that period.
Fraser McKay, Head of Upstream Analysis at Wood Mackenzie, provided a country-specific illustration of the challenge. Even with unconstrained traffic through the Strait, Iraq faces a recovery timeline of up to nine months to restore prior production levels, due to a combination of reservoir management complexity and resource constraints. McKay further cautioned that operators pressured into premature restart attempts risk inflicting long-term damage on foundational production assets. (Source: Wood Mackenzie Press Release, early April 2026)
Scenario 1: Rapid Diplomatic Resolution (Low Probability)
A ceasefire converting into full, unconditional Hormuz reopening within 30 days would represent the most optimistic outcome. Even under this scenario:
- IEA estimates approximately two months to re-establish steady export flows
- Initial volumes would remain below pre-conflict levels throughout the ramp-up
- Producers with orderly shut-ins could resume within days to weeks
- Iraq and other complex cases face multi-month timelines regardless
- Tanker insurance normalisation and trade finance re-engagement add further delays
- Physical inspection and maintenance of potentially damaged infrastructure creates additional lag
Scenario 2: Protracted Stalemate with Partial Reopening (Moderate Probability)
Selective transit under negotiated conditions, without full reopening, creates a two-tier supply recovery. Damaged infrastructure at Ras Laffan, Yanbu, and Fujairah requires months of repair work independent of the political situation. The gap between Hormuz reopening and full production restoration remains substantial. This represents, in many respects, the most consequential form of oil market disruption because its resolution timelines are inherently ambiguous.
Scenario 3: Extended Closure Beyond Six Months (Elevated Probability Given Current Trajectory)
The longer the closure persists, the more the damage compounds. SLB's Le Peuch distinguished clearly between producers who managed orderly shutdowns and those where production was halted abruptly, noting that the latter category faces extended maintenance and waiting periods that lengthen with time. Permanent reservoir integrity impairment in some fields becomes a material risk at extended shut-in durations. The global oil price floor resets structurally higher. Long-term demand destruction begins to emerge as a counterforce.
Global Trade Flows Are Being Permanently Restructured
A Bifurcating Market
The Strait of Hormuz oil supply shock is not merely disrupting existing trade flows. It is redrawing them. Several structural shifts are already observable:
- Europe has emerged as a primary buyer of U.S. Strategic Petroleum Reserve releases as the IEA coordinates supply releases
- Germany has pivoted to Polish oil transit routes as Russian Druzhba pipeline flows simultaneously halted
- Pakistan has redirected procurement toward Russia and Venezuela as Middle Eastern supply contracts
- The EU has actively urged Southeast Asian nations to diversify away from Russian oil, accelerating geopolitical energy realignment
- Two Russian diesel cargoes originally bound for Brazil pivoted east toward Egypt, illustrating real-time trade route restructuring
Russia's Windfall and the Fertilizer Risk
Russia occupies a counterintuitively advantageous position within this crisis. Elevated oil prices have generated estimated monthly revenues of approximately $9 billion, with eased sanctions pressure during the conflict period providing additional margin. Russia's control of approximately 20% of global fertilizer trade represents an unchallenged supply chain leverage point that compounds food security risks across import-dependent economies.
LNG Infrastructure: A Secondary Crisis With Long-Term Consequences
The LNG market dislocation running parallel to the crude oil disruption is reshaping infrastructure investment priorities on a multi-decade horizon:
- Asia's LNG imports hit a 7-year March low as Qatari export capacity was constrained
- Shell committed $16.4 billion to Canadian LNG as a strategic hedge against Hormuz dependency
- Baker Hughes reported Q1 2026 revenue beating analyst estimates by $260 million, driven by surging LNG infrastructure orders
- LNG carrier deliveries are projected to reach 100 vessels in 2026, up 27% from 2025, reflecting structural demand for non-Hormuz-dependent supply routes
- Japan's JERA secured LNG supply through July in a defensive procurement posture
The UAE's decision to exit both OPEC and OPEC+ as the Hormuz crisis extended signals a fracture within the Gulf producer alliance that will have lasting implications for production coordination architecture. These geopolitical oil market dynamics suggest the post-crisis energy landscape will look fundamentally different from what preceded it.
The next major ASX story will hit our subscribers first
Long-Term Economic Consequences: Demand Destruction and the Scarring Effect
Permanent Demand Reduction as a Policy Consequence
IEA Director Fatih Birol has stated that the Iran war will permanently reduce future oil demand growth trajectories, according to OilPrice.com reporting. The mechanism is straightforward in economic terms but severe in practice: sustained high energy prices compress consumer spending power, industrial output margins, and trade volumes simultaneously. In price-sensitive economies, energy rationing begins not through administrative allocation but through cost.
Energy and fertiliser cost inflation compound into food security risks across import-dependent developing economies, particularly those in sub-Saharan Africa unable to compete in a premium-bid crude market. As researchers at Oxford Energy have detailed, the scarring effects of a prolonged closure extend well beyond the immediate supply disruption into structural shifts in trade, investment, and energy policy. BP's profit more than doubling as war-driven oil trading volumes surged illustrates that the crisis creates asymmetric winners, concentrated among those with existing market infrastructure and balance sheet depth to exploit volatility.
The Investor Landscape: Navigating Asymmetric Outcomes
Disclaimer: The following table represents a framework for understanding market dynamics and should not be construed as investment advice. All investment decisions should be made in consultation with qualified financial advisers.
| Category | Near-Term Impact | Structural Implication |
|---|---|---|
| Integrated Oil Majors (BP, Shell) | Profit surge from trading and elevated prices | Capital allocation shifting toward non-Gulf supply corridors |
| Oilfield Services (SLB, Halliburton, Baker Hughes) | Middle East revenue disruption | Elevated demand for well restart services during recovery phase |
| LNG Infrastructure Developers | Order surge and valuation uplift | Multi-year capex cycle underway |
| Asian Refiners | Margin compression, procurement disruption | Accelerated supply diversification strategies |
| Renewable Energy Developers | Structural demand pull strengthening | Policy tailwinds deepening across multiple jurisdictions |
| Russian Energy Exporters | Windfall revenue period | Long-term sanctions risk trajectory remains elevated |
The Scarring Effect Will Outlast the Conflict
Several damage categories persist independently of when or how the conflict resolves:
- Physical infrastructure damage at Gulf terminals requires months to years of repair regardless of political outcomes
- Reservoir integrity risks from mismanaged shut-ins may permanently impair production capacity at specific fields
- Supply chain normalisation, covering tanker insurance, trade financing, and contractor mobilisation, adds months to any recovery timeline even after security conditions improve
- China's cleantech manufacturing acceleration has gained structural momentum as oil market instability deepens the economic case for alternatives
- India's renewable energy expansion reduced fossil fuel power dependency in 2025, a structural shift that the price shock of 2026 has reinforced
UNCTAD's assessment of Hormuz disruption consequences for global trade and development further underscores that the economic damage will be felt most acutely by developing nations least equipped to absorb it.
Frequently Asked Questions: Strait of Hormuz Oil Supply Shock
How much oil passes through the Strait of Hormuz?
Prior to the 2026 conflict, approximately 20 million barrels per day transited the Strait of Hormuz, representing roughly 20% of total global oil supply flows and an even higher share of globally traded LNG.
How long will it take for Middle East oil production to recover after the Hormuz closure?
Recovery timelines vary significantly by country and shut-in conditions. Producers that executed orderly shutdowns may resume within days to weeks. Iraq faces a recovery window of up to nine months, according to Wood Mackenzie analysis. Fields with reservoir management complications or infrastructure damage could face delays exceeding six months even after the Strait reopens.
Can U.S. shale oil replace the lost Middle East supply?
No. U.S. shale production cannot substitute for the volume of supply disrupted by the Hormuz closure at the required scale or speed. Shale wells require lead time, infrastructure investment, and capital deployment that cannot be accelerated sufficiently to offset a disruption of this magnitude within relevant timeframes.
Why is the world's spare oil production capacity trapped behind the Strait of Hormuz?
Saudi Arabia and the UAE hold virtually all meaningful global spare production capacity. Both nations are geographically dependent on the Strait of Hormuz for crude export. This structural concentration means the primary buffer mechanism designed to absorb supply shocks is itself inaccessible during the very disruption it was intended to address.
How are global LNG markets being affected by the Hormuz crisis?
Qatar's Ras Laffan LNG terminal, one of the world's largest export facilities, was directly targeted, choking Qatari LNG exports. Asia's LNG imports fell to a 7-year March low as a result. This has triggered accelerated investment in Canadian LNG, expanded U.S. LNG export capacity, and a surge in LNG carrier construction that has increased projected 2026 deliveries by 27% compared to 2025.
What does the cumulative barrel loss mean for long-term prices?
With between 600 million and 700 million barrels already lost as of late April 2026, and total losses projected to approach 1 billion barrels once recovery timelines are incorporated, the scale of irretrievable supply represents a fundamental repricing event for global crude markets. Analysts at Goldman Sachs and JPMorgan have both raised price forecasts in response, with JPMorgan stating further upward price movement remains probable. A structural reset of the global oil price floor is the base case for a prolonged closure scenario.
The information contained in this article is for educational and informational purposes only and does not constitute investment advice. Readers should conduct their own research and consult qualified financial advisers before making any investment decisions. All price references and market data reflect conditions as reported during the period covered.
Want to Track the Next Major Resource Discovery Before the Market Reacts?
As energy supply chains fracture and commodity markets reprice structurally, the opportunity for investors lies in identifying the next significant mineral discovery ahead of the crowd. Discovery Alert's proprietary Discovery IQ model delivers real-time alerts on significant ASX mineral discoveries — converting complex resource data into actionable insights the moment they hit the exchange — and you can explore why major discoveries have historically generated exceptional returns before starting your 14-day free trial to position yourself ahead of the market.