June 19, 2026
The Geopolitics of Chokepoints: Why One Waterway Can Move Global Energy Markets
Few geographical features carry more economic weight than a narrow body of water. Throughout history, the world's critical maritime passages have repeatedly demonstrated their power to amplify geopolitical tensions into full-scale commodity shocks. The Strait of Hormuz sits at the apex of this dynamic, functioning less as a shipping lane and more as a pressure valve for global energy systems. When that valve tightens, crude benchmarks spike. When it reopens, the unwind is equally dramatic.
Understanding how the Strait of Hormuz reopening oil prices dynamic is reshaping global markets requires looking beyond the diplomatic announcements and into the structural mechanics of how energy markets actually absorb, price, and eventually normalise geopolitical risk. The crude oil market dynamics at play here are among the most complex in recent memory.
When big ASX news breaks, our subscribers know first
What Makes the Strait of Hormuz the World's Most Consequential Energy Chokepoint
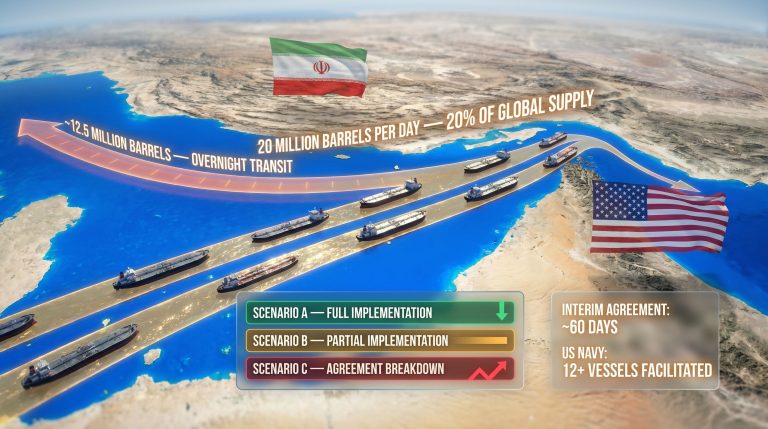
The Strait of Hormuz connects the Persian Gulf to the Gulf of Oman, forming the only maritime exit route for crude oil produced across Saudi Arabia, Iraq, Iran, Kuwait, Qatar, and the UAE. At its narrowest point, the strait spans roughly 33 kilometres, with navigable shipping lanes in each direction measuring only a few kilometres wide.
This geographic compression is precisely what gives the strait its extraordinary leverage over global supply chains. At normal operating capacity, the strait handles approximately 20% of the world's total traded oil, along with significant volumes of liquefied natural gas, refined petroleum products, and petrochemicals. No alternative overland route or pipeline network can fully substitute for this throughput at scale.
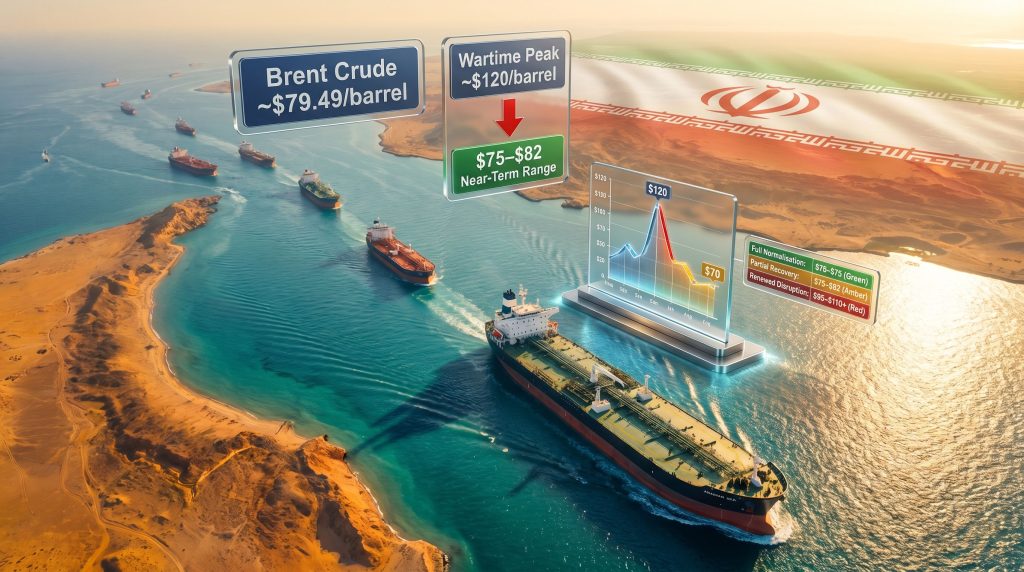
When conflict-era risk premiums were fully embedded in crude pricing, Brent crude reached approximately $120 per barrel, a level reflecting the market's attempt to price in worst-case closure scenarios. That premium was not about supply that had actually stopped flowing, but about the probability-weighted risk of it doing so — a distinction that matters enormously when understanding how prices subsequently behave as tensions ease.
How Brent Crude and WTI Are Responding to Reopening Signals
Following early signals of an interim U.S.-Iran agreement and initial evidence of tanker activity resuming, crude benchmarks moved sharply lower. The scale of the repricing reflects just how inflated the conflict-era risk premium had become. Oil market trade risks continue to keep many traders cautious, however, even as headline prices decline.
| Benchmark | Wartime Peak (Approx.) | Post-Reopening Level | Approximate Decline |
|---|---|---|---|
| Brent Crude | ~$120/barrel | ~$79.49/barrel | ~$40+ decline |
| WTI Crude | Elevated wartime levels | ~$76.36/barrel | Significant correction |
| Near-Term Analyst Range | N/A | $75–$82/barrel | Analyst consensus |
Brent crude for August delivery fell roughly 0.45% to $79.49 per barrel, while U.S. West Texas Intermediate for July declined approximately 0.31% to $76.36 per barrel during early post-reopening trading. Compared with wartime highs near $120 per barrel, Brent has declined roughly 36% from its conflict-era peak, according to market analysts cited by CNBC.
Why Prices Are Falling Without Collapsing
The relatively orderly nature of the crude sell-off reveals something important about how professional traders are approaching this situation. Rather than aggressively pricing out all geopolitical risk simultaneously, market participants are applying a layered discount as verification of normalisation accumulates.
Three factors are preventing a sharper collapse in crude prices:
- Incomplete shipping resumption: Major international shipping lines have not yet fully restored standard transit routes through the strait
- Persistent insurance premiums: Marine war-risk insurance rates remain elevated, signalling that commercial operators still attach meaningful probability to renewed disruption
- OPEC's structural price support: The cartel's rejection of demand-peak and supply-glut narratives creates a fundamental floor beneath crude prices
Markets are not simply reacting to diplomatic language. Physical proof of normalisation, measured through consistent vessel movements and declining insurance costs, carries far more pricing weight than political statements alone.
The Gap Between Diplomatic Announcements and Physical Reopening
One of the most underappreciated dynamics in commodity markets is the lag between political agreements and real-world operational changes. The Strait of Hormuz reopening illustrates this gap with striking clarity.
U.S. Vice President JD Vance confirmed that tankers carrying more than 12 million barrels of cargo transited the strait overnight following the interim agreement, and noted that Iranian forces had refrained from targeting vessels for consecutive nights. However, this early data point, while encouraging, represents only a fraction of the normalised daily flow that global energy markets require.
Why the Insurance Market Is the Most Reliable Real-Time Signal
Professional traders and supply chain managers increasingly treat marine war-risk insurance rates as a more reliable real-time indicator of strait normalisation than diplomatic communiques. This is because insurance underwriters assess risk based on actuarial probability, operational intelligence, and historical loss data rather than political incentives.
When war-risk premiums remain elevated despite political announcements, it signals that underwriters — with significant financial exposure to miscalculation — are not yet convinced that normalisation is durable. For crude oil markets, this creates a ceiling on how quickly the geopolitical risk premium can fully unwind.
Furthermore, the pattern is consistent: shipping line resumption decisions and insurance rate trajectories tend to lead physical volume recovery by days to weeks, making them the most actionable forward indicators available to market participants.
The 4 to 8 Week Price Transmission Window
Even after physical shipping fully normalises, the downstream pass-through of lower crude costs to wholesale and retail markets follows a predictable but time-delayed sequence. Analysts project this full transmission to take between four and eight weeks, driven by three compounding structural delays:
- Tanker repositioning: Vessels rerouted around the Cape of Good Hope or held in holding patterns during the conflict period must reposition before capacity is fully restored to pre-conflict levels
- Insurance cost normalisation: Elevated war-risk premiums add direct costs to cargo economics that persist until underwriters formally reduce rate schedules — a process driven by loss experience and risk reassessment, not news cycles
- Inventory rebuilding cycles: Downstream refineries, distribution networks, and national strategic reserves that drew down stocks during the disruption period must replenish before price relief flows through to end consumers
The Consumer Reality: Pump Prices Lag Crude by Weeks
For households and businesses monitoring retail fuel prices, the relationship between crude benchmarks and pump prices is indirect and time-delayed. Even in scenarios where Brent crude falls sharply over a matter of days, petrol and diesel prices at the forecourt typically lag by several weeks. This reflects pipeline inventory timing, refinery margin management, and regional distribution constraints that cannot adjust instantaneously to upstream price signals.
Retail fuel price relief following a crude oil shock reversal is rarely immediate. Consumers should anticipate a gradual reduction across a multi-week horizon rather than an overnight adjustment at the pump.
Consequently, those managing business fuel costs would benefit from exploring commodity volatility hedging strategies to help offset the unpredictability inherent in these transmission delays.
OPEC's Role in Setting the Post-Reopening Price Floor
The reopening of the Strait of Hormuz does not occur in a vacuum. OPEC's market influence introduces a significant counterweight to the bearish pressure created by geopolitical de-escalation, and understanding this interplay is essential for projecting medium-term price trajectories.
OPEC Secretary General Haitham Al Ghais, in an exclusive interview with CNBC, communicated that the organisation does not anticipate global oil demand reaching a near-term peak, while also pushing back against International Energy Agency projections pointing toward an emerging supply surplus. The divergence between these two institutions carries meaningful implications for the medium-term price trajectory.
| Institution | Demand Outlook | Supply Forecast | Price Implication |
|---|---|---|---|
| OPEC | No near-term demand peak | Rejects glut scenario | Supportive of higher prices |
| IEA | Demand growth moderating | Supply surplus emerging | Bearish longer-term pressure |
In addition, OPEC demand forecasts consistently emphasise anchoring projections to current observable fundamentals rather than conditional assumptions — a deliberate strategy to support price expectations. This approach carries substantial market weight given the cartel's collective production capacity and its demonstrated willingness to adjust output discipline in response to price pressure.
The next major ASX story will hit our subscribers first
Scenario Analysis: Three Price Pathways for Brent Crude Over the Next 90 Days
Given the complexity of variables at play — ranging from ceasefire durability to shipping resumption rates and OPEC production decisions — a scenario-based framework is the most analytically useful way to assess the near-term crude price landscape.
| Scenario | Conditions | Brent Price Range | Probability Assessment |
|---|---|---|---|
| Full Normalisation | Ceasefire holds, shipping resumes, insurance falls | $70–$75/barrel | Moderate |
| Partial Recovery | Intermittent transit, elevated insurance | $75–$82/barrel | Most likely near-term |
| Renewed Disruption | Agreement collapses, strait closes again | $95–$110+/barrel | Lower but non-trivial |
The partial recovery scenario aligns most closely with current market pricing and analyst consensus, reflecting the view that while the direction of travel is toward normalisation, the pace remains uncertain and the risk of reversal is not negligible.
Which Economies Face the Greatest Exposure to Strait Disruptions
While crude oil benchmarks are global, the economic consequences of strait disruptions are not evenly distributed. The most exposed economies share a common characteristic: heavy dependence on Persian Gulf crude imports with limited ability to rapidly substitute alternative supply sources.
- East Asian economies including China, Japan, South Korea, and India collectively account for the majority of strait-transiting crude volumes, with limited short-term pipeline alternatives
- European buyers face secondary exposure through LNG supply disruption, as Qatar routes significant liquefied natural gas volumes through the strait
- Petrochemical industries globally are exposed through naphtha and other feedstock flows that transit the strait alongside crude
Strategic Petroleum Reserve releases from the U.S. and coordinated IEA member drawdowns have historically served as the primary short-term buffer mechanism during chokepoint events, though their effectiveness diminishes in prolonged disruption scenarios. Reports suggest that gas prices remain elevated in certain regions even as the diplomatic situation evolves, underscoring how slowly physical markets can adjust.
Key Indicators to Monitor as Normalisation Progresses
For investors, analysts, and supply chain managers tracking the Strait of Hormuz reopening oil prices in real time, the following indicators provide the most reliable signal quality:
- Marine war-risk insurance rate trends: The clearest real-time proxy for commercial operator confidence in transit safety
- Major shipping line resumption announcements: Operational decisions by large carriers carry more market weight than political statements
- AIS tanker tracking data: Automatic Identification System vessel data provides near-real-time visibility into actual transit volumes
- OPEC production adherence: Any deviation from agreed output levels would introduce additional supply-side variables
- IEA inventory data releases: Weekly and monthly inventory reports will reveal whether downstream restocking is accelerating or lagging
Frequently Asked Questions: Strait of Hormuz Reopening and Oil Prices
How much have oil prices fallen since the reopening was signalled?
Brent crude has declined from a conflict-era peak of approximately $120 per barrel to levels near $79 to $84 per barrel, representing a fall of roughly 36% from wartime highs, according to market analysts cited by CNBC.
What is the near-term trading range for Brent crude?
Market analysts currently project Brent to trade within a $75 to $82 per barrel range in the near term, assuming the ceasefire holds and shipping normalisation continues without major incident.
When will retail fuel prices reflect lower crude costs?
Retail pump prices typically lag crude benchmark movements by several weeks due to inventory pipeline timing, refinery processing cycles, and regional distribution constraints. Consumers should, therefore, expect gradual rather than immediate relief.
What happens to oil prices if the interim agreement breaks down?
A collapse of the U.S.-Iran agreement could rapidly restore the full geopolitical risk premium to crude pricing, with Brent potentially returning toward the $95 to $110+ per barrel range depending on the severity and duration of renewed disruption.
How long before oil markets fully normalise?
Analysts estimate a four to eight week window before Strait of Hormuz reopening oil prices fully reflect normalised supply flows, accounting for tanker repositioning, insurance cost adjustments, and downstream inventory rebuilding across global supply chains.
This article contains forward-looking analysis and scenario projections based on publicly available market data and analyst commentary. Commodity prices are inherently volatile and subject to rapid change based on geopolitical developments, OPEC decisions, and macroeconomic conditions. Nothing in this article constitutes financial or investment advice. Readers should conduct their own research and consult qualified financial professionals before making investment decisions.
Want to Stay Ahead of the Next Major Commodity Shift?
When geopolitical events like the Strait of Hormuz reopening send shockwaves through energy markets, identifying the downstream opportunities in ASX-listed resource and exploration stocks requires real-time intelligence — Discovery Alert's proprietary Discovery IQ model instantly scans ASX announcements across 30+ commodities, delivering actionable insights to subscribers before the broader market reacts, with historic discoveries demonstrating the scale of returns these moments can generate. Begin your 14-day free trial at Discovery Alert today and position yourself ahead of the next major market move.