June 15, 2026
When Politics Moves Faster Than Pipelines
Energy markets have a long memory for the gap between diplomatic promise and physical delivery. History shows, repeatedly, that the announcement of a peace agreement or the lifting of a blockade triggers immediate price repricing, while the actual restoration of supply follows a far more gradual, friction-laden path. The world is witnessing precisely this dynamic unfold in real time following the U.S.-Iran deal to reopen the Strait of Hormuz, signed in Switzerland on June 19, 2026.
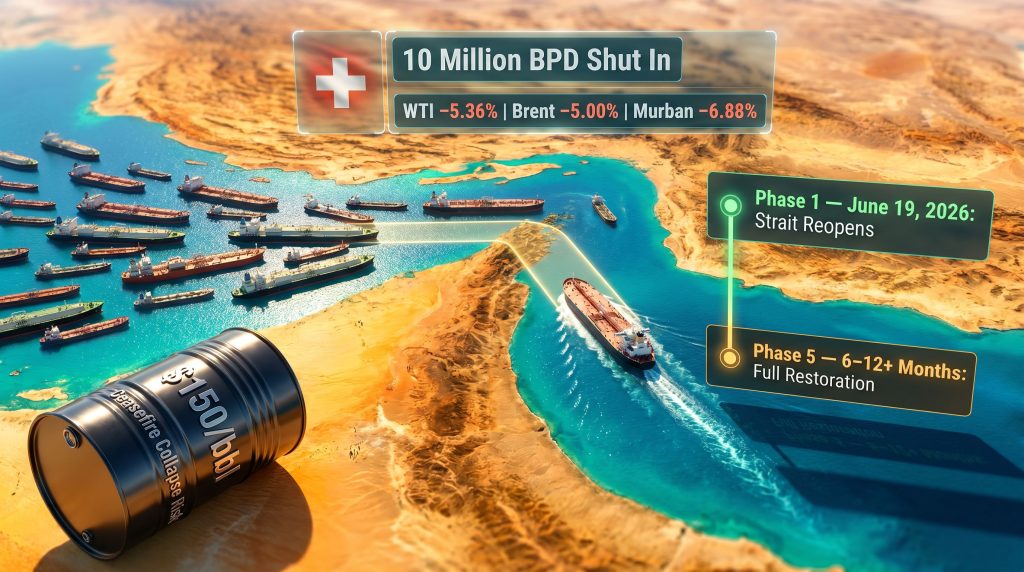
Markets moved fast. Crude benchmarks fell sharply the moment the agreement was announced, with WTI dropping approximately 5.36%, Brent declining around 5.00%, and Murban crude falling as much as 6.88%. Equity markets rallied broadly, and the U.S. dollar softened. The risk premium that had been baked into oil prices during three and a half months of Strait closure was unwound in hours.
However, pricing out a geopolitical risk premium is not the same as restoring 10 million barrels per day of shut-in production. Those are two entirely different timelines, and understanding the distance between them is critical for anyone tracking where oil markets go from here. For broader context on how trade and geopolitics shape crude pricing, the forces at play here are consistent with patterns seen in prior supply disruption cycles.
When big ASX news breaks, our subscribers know first
What the U.S.-Iran Agreement Actually Contains
The Core Terms of the June 2026 MOU
The agreement, brokered by Pakistani Prime Minister Shehbaz Sharif and formalised in Switzerland, covers several immediate measures alongside a deferred framework for deeper negotiations.
| Deal Component | Detail |
|---|---|
| Formal Signing Date | June 19, 2026 |
| Brokering Party | Pakistan (PM Shehbaz Sharif) |
| Iranian Assets Released | $12 billion in frozen funds |
| Naval Blockade Status | Lifted immediately upon signing |
| Ceasefire Coverage | All fronts, including Lebanon |
| Nuclear Enrichment Status | Deferred to subsequent negotiations |
| European Sanctions | UK, France, Germany, Italy signalling willingness to lift |
| Legal Status | Memorandum of understanding, not a binding treaty |
What Remains Unresolved
Several structural gaps exist within the agreement that create meaningful uncertainty for the recovery timeline:
- Israel is not a signatory to the deal. Ongoing Israeli military activity in Beirut remains an active ceasefire destabilisation risk.
- Iran's nuclear enrichment programme remains unaddressed. The U.S. maintains a firm position against Iranian nuclear weapons capability, and this flashpoint is being deferred into what is expected to be at least a 60-day comprehensive negotiation window.
- The MOU carries no defined enforcement mechanism, meaning compliance by all parties, including Iran's Revolutionary Guard, cannot be guaranteed from day one.
- A final, comprehensive peace framework is not anticipated for at least two months post-signing.
According to reporting from NBC News, both sides confirmed the deal was expected to be signed within days, though the structural gaps noted above remained a point of concern for analysts monitoring the situation closely.
The Scale of Disruption: Three and a Half Months of Shut-In Production
To appreciate why the recovery will be slow, it helps to quantify the damage. The Strait of Hormuz closure lasted approximately 3.5 months before the June 2026 agreement. Furthermore, the scale of this oil market disruption is difficult to overstate when viewed against the broader patterns of disruption that have periodically threatened global supply chains. During that period:
- More than 10 million barrels per day of Middle Eastern oil output was effectively shut in
- This represents roughly 10% of total global oil consumption, based on a global demand baseline of approximately 100 to 103 million bpd
- The U.S. military was reportedly facilitating the movement of approximately 7 million bpd out of the Persian Gulf during the blockade period
- OPEC's collective production fell to its lowest level since 2000, underscoring the severity of the disruption
The Strait of Hormuz is the world's most critical oil chokepoint. Before the closure, it facilitated the transit of roughly 20 to 21 million barrels per day, equivalent to approximately one-fifth of total global oil demand.
These figures frame the challenge ahead. Restoring flows of this magnitude is not a logistical exercise measured in days. It involves the sequential restart of wells, pipelines, export terminals, and tanker routes across multiple sovereign nations, each facing different infrastructure constraints.
Why Full Production Recovery Will Take Months, Not Days
The Technical Reality of Restarting Shut-In Oil Fields
One dimension that is frequently underappreciated in mainstream coverage is the technical complexity of restarting oil wells after an extended shut-in period. This is not a process that can be reversed with a switch. Field reservoir pressure must be carefully managed during restart to avoid permanent damage to formation productivity.
Surface equipment, including separators, compressors, and pipeline systems, requires inspection and recommissioning. Production rates are typically restored in a graduated sequence to protect both the reservoir and the infrastructure.
According to Wood Mackenzie's analysis, assuming operators pursue a measured and controlled ramp-up, the affected Gulf fields could recover along the following trajectory:
| Recovery Milestone | Estimated Timeframe Post-Reopening |
|---|---|
| 70% of prior production restored | Within 3 months |
| 90% of prior production restored | Within 6 months |
| Remaining ~1 million bpd recovered | Considerably longer than 6 months |
This phased recovery model reflects the engineering constraints inherent to large-scale field restarts, not a lack of motivation among producers. The final increment of production, often the hardest to restore, typically involves the most technically challenging wells and the highest operational friction.
Country-Level Recovery Is Deeply Asymmetric
Not all Gulf producers face the same restart challenge. The structural configuration of each country's export infrastructure determines how quickly it can bring volumes back to market.
| Producer | Recovery Speed | Primary Constraint |
|---|---|---|
| Saudi Arabia | Relatively faster | Diversified export infrastructure; strong operational capacity |
| United Arab Emirates | Relatively faster | Fujairah terminal provides partial Hormuz bypass; Murban crude infrastructure robust |
| Iraq | Significantly slower | Southern Basrah fields export almost entirely through Hormuz; highest proportional shut-in |
Iraq's position deserves particular attention. Its southern export fields have almost no alternative routing. Every barrel that left Basrah before the closure passed through the Strait. Alan Gelder, Senior Vice President of Refining, Chemicals, and Oil Markets at Wood Mackenzie, noted that Iraq faces a uniquely difficult recovery path given the scale of its shut-in and the structural dependency of its southern export infrastructure. A full Iraqi recovery could take approximately one year, according to Wood Mackenzie. (Source: AP, June 2026)
Shipping, Insurance, and Logistics: A Secondary Supply Bottleneck
Even before a single barrel of newly restarted production reaches a tanker, commercial shipping faces its own layer of friction that will constrain throughput recovery:
- Risk reassessment delays: Major shipping operators are waiting for formal ratification on June 19 before committing vessels to Hormuz transits
- War risk insurance normalisation: Marine war risk premiums spiked dramatically during the closure period. Underwriters will require time to reassess the threat environment before pricing returns to pre-crisis levels
- Japanese shipping companies have publicly stated they will hold back from Hormuz crossings until the deal is formally signed, confirming that commercial caution extends beyond just the political announcement
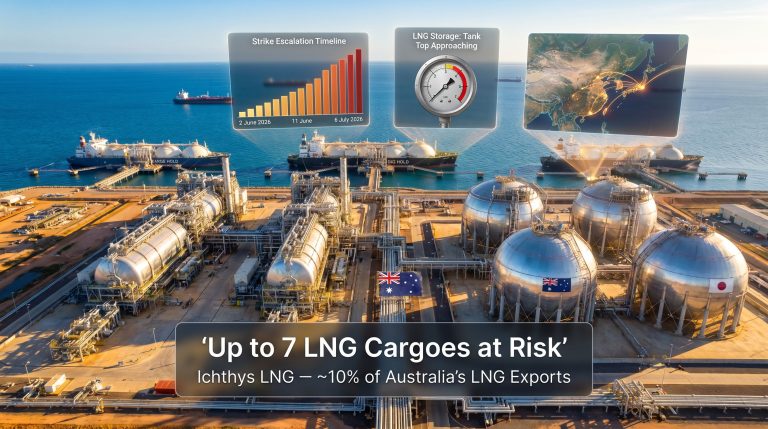
- LNG tanker operators face additional complexity. Specialised cargo, long-term contract structures, and the regulatory requirements for liquefied natural gas transport all introduce delays beyond what standard crude tanker operators face
A key insight noted by Ole Hansen, Head of Commodity Strategy at Saxo Bank, is that the rate at which supply chains normalise and export flows resume will be a primary determinant of how much residual geopolitical risk premium remains embedded in oil prices. (Source: Saxo Bank, X/Twitter, June 2026) In other words, even if the political situation stabilises, a slow logistical recovery could keep a portion of the crisis premium alive in benchmark prices for weeks or months.
Market Reactions and the Risk of Mispricing the Timeline
The immediate market response to the U.S.-Iran deal to reopen the Strait of Hormuz was significant and directionally logical. Removing a geopolitical risk premium from crude benchmarks when the trigger event for that premium appears resolved is standard market behaviour. The WTI decline of approximately 5.36% and Brent's fall of approximately 5.00% reflect exactly this mechanism.
However, there is a meaningful risk that the scale and speed of the price correction has run ahead of the physical supply rebalancing that markets appear to be anticipating. For instance, consider the following:
- OPEC's market influence remains substantial, and OPEC has separately projected that global oil demand growth will outpace supply through 2027, a forward outlook that suggests the market may tighten again once the post-closure supply disruption normalises
- Goldman Sachs has cut its 2027 oil price forecast, citing demand-side uncertainty, introducing a countervailing bearish scenario driven by structural consumption shifts rather than supply constraints
- Analysts have flagged that oil prices could return to $150 per barrel if the ceasefire collapses, a scenario that would fully reverse the post-announcement decline and likely exceed the pre-deal geopolitical premium
Disclaimer: Oil price forecasts and geopolitical scenario analyses involve significant uncertainty. Past price movements and analyst projections should not be interpreted as predictions of future performance.
The Geopolitical Overhangs That Markets Cannot Yet Price
Three Scenarios That Could Disrupt the Recovery Trajectory
Scenario 1: Israeli Military Action Destabilises the Ceasefire
Israel remains outside the agreement. Continued strike operations against Hezbollah targets in Beirut represent the most immediate near-term risk. A significant escalation could prompt Iran to reassert Hormuz control before the 60-day comprehensive negotiation window closes.
Scenario 2: Nuclear Disagreement Resurfaces
The deliberate deferral of Iran's nuclear status is a structural vulnerability in the MOU. If hardline factions within Iran's political establishment push for resumed enrichment during the negotiation window, U.S. domestic political pressure could force a policy reversal that unravels the agreement before it achieves binding status.
Scenario 3: Commercial Shipping Remains Economically Unviable
If war risk insurance premiums fail to normalise quickly, Hormuz transits may remain commercially unattractive even with the political agreement in place. This scenario would suppress the physical return of tanker traffic and delay the supply rebalancing that markets have already begun pricing in. A current crude market overview illustrates how sensitive benchmark prices remain to precisely these kinds of logistical and political uncertainties.
The next major ASX story will hit our subscribers first
Which Importers Were Most Exposed During the Closure?
The geographic and economic vulnerability created by the closure was not evenly distributed. Several major importing nations were forced to implement emergency supply measures:
- Japan tapped strategic petroleum reserves and rapidly diversified its supplier base
- India secured crude supply through August by escalating UAE import volumes, capped domestic fuel sales to prevent shortages, and flagged multiple tanker incidents off Oman within a 24-hour window
- China began drawing down oil stockpiles as the Middle East crisis extended beyond initial expectations
- Malaysia was forced to overhaul its crude supply chain as Hormuz access was disrupted
- Kazakhstan faced buyer demands for increased alternative supply as the closure tightened regional markets
Alternative supply responses activated globally during the closure included:
- The Trans Mountain Pipeline in Canada hitting full operational capacity as Asian demand for non-Middle Eastern crude surged
- Norway publicly promoting Arctic energy resources as a strategic supply option for European buyers
- Alberta commencing feasibility work on new Pacific pipeline corridors to capture rising Asian demand
A Phased Recovery Timeline for Global Oil Supply
| Phase | Timeframe | Expected Development |
|---|---|---|
| Phase 1: Formal Opening | June 19, 2026 | MOU signed; Strait officially reopens; initial tanker transits begin |
| Phase 2: Logistics Normalisation | Weeks 1 to 4 | Insurance markets recalibrate; backlogged vessels clear; LNG routes resume |
| Phase 3: Production Ramp-Up | Months 1 to 3 | Saudi Arabia and UAE restore approximately 70% of shut-in output |
| Phase 4: Intermediate Recovery | Months 3 to 6 | Regional production approaches 90% of pre-closure levels |
| Phase 5: Full Restoration | 6 to 12+ months | Iraq and structurally challenged producers approach full capacity |
FAQ: U.S.-Iran Deal and Strait of Hormuz Reopening
When does the Strait of Hormuz officially reopen?
The Strait is scheduled to reopen for all maritime traffic on Friday, June 19, 2026, following the formal signing of the U.S.-Iran MOU in Switzerland.
Why did oil prices fall immediately after the deal was announced?
Markets removed the geopolitical risk premium embedded in crude benchmarks during the closure. WTI fell approximately 5.36% and Brent approximately 5.00% on the announcement, reflecting sentiment repricing rather than physical supply change.
Which oil producer faces the longest recovery timeline?
Iraq faces the most structurally complex recovery path given its near-total dependence on southern Basrah export routes through the Strait. A full Iraqi production recovery could take approximately one year, according to Wood Mackenzie analysts. Furthermore, OPEC demand forecasts suggest that any prolonged supply shortfall from Iraq could meaningfully affect the broader balance of global oil markets through 2027.
What is the biggest single risk to the recovery timeline?
The most significant near-term risk is Israeli military activity in Lebanon, which could destabilise the ceasefire. The medium-term risk is the unresolved nuclear negotiation track, which remains a potential flashpoint throughout the 60-day comprehensive negotiation window. Bloomberg's coverage of the lead-up to the agreement highlighted these unresolved elements as the central uncertainty facing markets.
Could oil prices rise sharply again after the deal?
Analysts have flagged scenarios where oil could reach $150 per barrel if the ceasefire collapses. This remains a tail risk scenario, not a base case, but the lack of enforcement mechanisms in the MOU means the probability cannot be dismissed entirely.
The Deal Is the Starting Line, Not the Finish Line
The U.S.-Iran deal to reopen the Strait of Hormuz is a landmark diplomatic development, but the energy market implications extend well beyond the initial price reaction. The physical restoration of more than 10 million barrels per day of shut-in production, the normalisation of commercial shipping economics, the resolution of country-level infrastructure bottlenecks, and the management of ongoing geopolitical overhang all operate on timelines that are measured in months to years, not hours to days.
Key takeaways for energy market participants:
- The diplomatic milestone and the physical supply restoration are separated by a recovery timeline of six to twelve months or more
- Iraq's structurally constrained recovery could keep a residual supply gap open for up to a year
- Insurance and shipping market normalisation will act as an independent brake on throughput recovery
- The deferred nuclear negotiation track and Israel's non-participation in the agreement both represent live risk factors
- Markets may have partially run ahead of the physical rebalancing implied by the price moves seen at announcement
The opening of the Strait marks the conclusion of one crisis chapter and the beginning of a prolonged, asymmetric, and risk-laden recovery process for the global oil and gas industry. The pace of that recovery, not the diplomatic announcement itself, will ultimately determine where oil prices settle.
Want to Stay Ahead of the Next Major Resource Discovery Before the Market Catches On?
While geopolitical disruptions like the Strait of Hormuz closure reshape global energy markets, savvy investors know that significant mineral discoveries on the ASX can offer compelling opportunities regardless of the macro environment. Discovery Alert's proprietary Discovery IQ model delivers real-time alerts on significant ASX mineral discoveries — turning complex data across 30+ commodities into clear, actionable insights — so subscribers can act decisively ahead of the broader market. Explore historic examples of what major discoveries can return and begin your 14-day free trial today to secure a genuine market-leading edge.