July 7, 2026
The Hidden Architecture of Global Oil Logistics and Why One Narrow Passage Controls Everything
Most investors focus on OPEC+ meeting communiqués, US Federal Reserve policy, and demand forecasts when trying to anticipate crude price movements. Yet the variable with the most immediate influence on physical oil availability in 2026 is not a production quota or a monetary policy decision. It is a 33-kilometre-wide waterway connecting the Persian Gulf to the Gulf of Oman, through which roughly one-fifth of all oil consumed globally must pass. Understanding how Strait of Hormuz shipping constraints and oil prices interact requires examining not just geopolitics, but the mechanical reality of maritime logistics and the inventory arithmetic that determines whether markets can absorb disruptions without repricing.
When big ASX news breaks, our subscribers know first
Why the Strait of Hormuz Remains the World's Most Consequential Oil Chokepoint
The Geographic and Economic Weight of a Single Waterway
The Strait of Hormuz is not one of several options for Persian Gulf oil exports. It is the only viable exit. Every barrel exported by the UAE, Kuwait, Iraq, Qatar, Bahrain, and Iran must pass through this passage under normal operating conditions. There is no pipeline network operating at sufficient scale to serve as a meaningful alternative if Hormuz transit is disrupted.
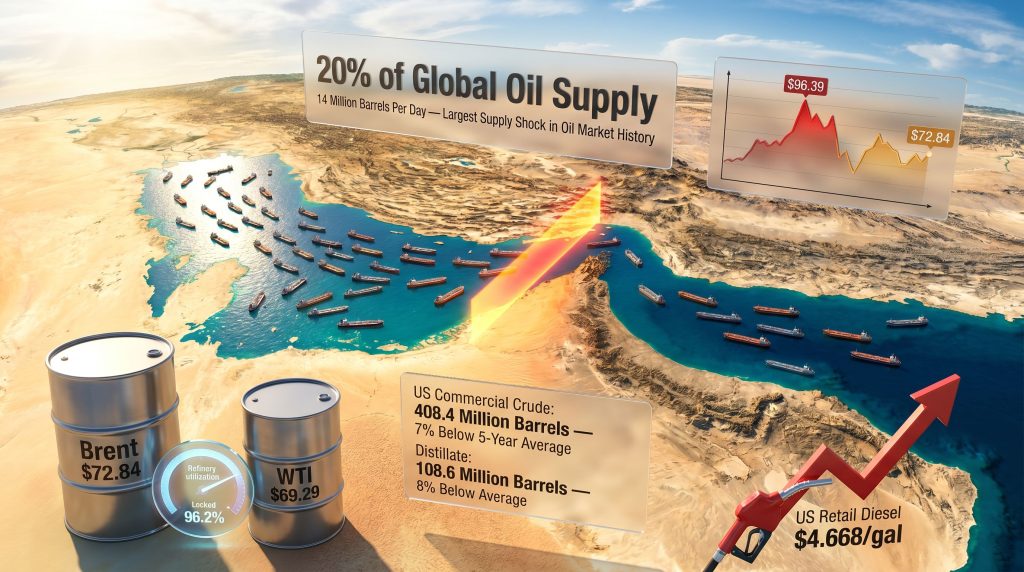
Under pre-conflict conditions, approximately 20% of total global oil supply transited the strait daily. Crude oil accounted for more than 70% of all maritime throughput through the waterway, making it structurally irreplaceable for global energy logistics in a way that no other shipping lane can claim.
What makes Hormuz uniquely dangerous as a single point of failure is its multiplier effect. Unlike a supply disruption that affects a single producer or a single region, any constraint on Hormuz simultaneously cuts off multiple sovereign exporters. The International Energy Agency has characterised the current disruption as the largest supply shock in the recorded history of the global oil market, with estimated losses exceeding 14 million barrels per day (mbd). That figure dwarfs any previous supply interruption, including the 1973 Arab oil embargo or the 1990 Gulf War production cutoff.
As the Brookings Institution has analysed, the strait functions less like a trade route and more like a structural dependency embedded into the global energy system — one that has no credible near-term alternative.
A Hormuz closure is not a regional supply event. It is a structural repricing event for every crude benchmark, every refined product market, and every energy-intensive industry operating anywhere in the global economy.
Furthermore, more than 600 ships, including approximately 325 tankers, remain anchored in the Gulf awaiting safe passage, according to Lloyd's List Intelligence. The scale of the vessel backlog alone illustrates why a ceasefire announcement and a diplomatic memorandum of understanding have not been sufficient to restore normal trade flows.
What Is Actually Happening at the Strait of Hormuz Right Now?
Vessel Traffic: The Data Behind the Disruption
The gap between diplomatic progress and physical reality at the Strait of Hormuz is the central tension driving current oil market pricing. Despite a ceasefire and a US-Iran Memorandum of Understanding providing 60 days of free navigation provisions, daily vessel crossings remain in single digits. Recorded transits of five vessels on one day and seven on the next stand in stark contrast to the pre-conflict throughput levels that supported 20% of global supply.
Trade risk analysts cap maximum sustainable transit capacity at 10 to 15 passages daily even under ceasefire conditions, citing residual threats from rogue militia activity, reports of undetected mines in shipping lanes, and the operational complexity of processing the backlog of vessels waiting to move. Crude oil flows have limitedly restarted but remain near zero relative to 2025 baseline levels. LNG and fertilizer shipments are at a near-complete standstill.
Iran's Persian Gulf Strait Authority: A New Layer of Transit Control
One of the less widely understood developments to emerge from the conflict is the establishment of the Persian Gulf Strait Authority (PGSA) by Iran's Revolutionary Guards. This entity now requires vessels to obtain passage permits before transiting the strait. Ships must carry Iranian-approved insurance to qualify for clearance, and reports indicate some vessels have paid direct tolls to Iranian forces in exchange for safe passage.
This mechanism introduces a formalised control layer over Hormuz that did not exist before the conflict. The MoU signed in June provides 60 days of free navigation provisions, but Iran and Oman have not yet agreed on long-term administrative arrangements, including any formalised fee structure. The absence of that agreement creates ongoing uncertainty about what transit conditions will apply once the 60-day window closes.
Why the MoU Has Not Restored Normal Flows
KCM Trade's chief market analyst Tim Waterer has noted that oil prices had already incorporated expectations of higher supply following the MoU announcement. The problem is that physical recovery in Hormuz flows has not materialised to validate those expectations. Infrastructure damage, halted upstream production restart timelines, and the need to replenish severely depleted commercial inventories mean that analysts expect months of normalisation even after the strait fully reopens to normal traffic volumes.
Physical supply recovery and diplomatic progress are operating on entirely different timelines. Markets priced in the MoU almost immediately. The tankers have not moved at the same speed.
How Are Oil Prices Responding to the Hormuz Supply Crisis?
Brent and WTI Price Dynamics Under Constrained Transit
The price behaviour of crude benchmarks during the Hormuz disruption reveals something important about how markets process geopolitical information versus physical supply data. Crude oil price trends show that prices initially dipped below $95 per barrel on ceasefire announcements, as investors interpreted the diplomatic development as a supply normalisation signal. The market then rebounded sharply to $96.39 per barrel as participants recognised that maritime supply remained effectively suspended despite the ceasefire.
The subsequent moderation toward current levels reflects the partial offset of rising OPEC+ output against still-constrained physical exports:
| Benchmark | Current Price | Movement | Context |
|---|---|---|---|
| Brent Crude | $72.84/barrel | +1.2% | Near pre-conflict levels despite single-digit Hormuz crossings |
| WTI Crude | $69.29/barrel | +1.1% | Recovering alongside Brent amid tight US inventories |
| Brent (Post-Ceasefire Peak) | ~$96.39/barrel | Sharp rebound | Markets recognised disruption was not resolved |
The Inventory Deficit Amplifying Price Sensitivity
The inventory position of the US market is providing a structural price floor that limits how far Brent and WTI can fall even as OPEC+ raises output targets. US commercial crude inventories fell 3.8 million barrels to stand at 408.4 million barrels, sitting 7% below the five-year seasonal average. Distillate inventories are even tighter in relative terms, at 108.6 million barrels, which is 8% below their five-year average.
| Inventory Category | Current Level | Five-Year Average Variance |
|---|---|---|
| US Commercial Crude | 408.4 million barrels | 7% below average |
| Distillate (Diesel Proxy) | 108.6 million barrels | 8% below average |
US net crude imports averaged just 1.0 million bpd, down sharply from 2.6 million bpd a year earlier, leaving the system with significantly less buffer against further supply shocks. US refinery utilisation reached 96.2%, which leaves virtually no spare processing capacity to compensate for any additional crude import disruption. The combination of tight inventories, low import volumes, and maximum refinery utilisation creates a market that is structurally sensitive to any incremental supply deterioration at Hormuz.
Saudi Arabia's Pricing Strategy in a Constrained Export Environment
The Largest Official Selling Price Cut in Over Two Decades
Saudi Arabia's response to the Hormuz disruption reveals a pricing strategy designed to protect long-term market share in Asia during a period when physical delivery reliability from the entire Gulf region is uncertain. The kingdom reduced its August Arab Light Official Selling Price (OSP) for Asia by $11 per barrel, the steepest single-month reduction in more than 20 years. The revised price sits at $1.50 per barrel below the Oman/Dubai average.
This aggressive pricing move serves two purposes simultaneously. It keeps Saudi crude competitive against alternative suppliers that Asian refiners may have secured during the period of Gulf export disruption. It also signals a willingness to absorb margin compression in the short term to prevent Asian customers from permanently diversifying their supply chains away from Gulf crude.
OPEC+ Output Expansion Versus Export Reality
OPEC+ raised August production targets by 188,000 barrels per day, following equivalent increases in both June and July. The UAE lifted output above 3.8 million bpd, its highest production level since April 2020, after departing from OPEC+ quota constraints. However, OPEC's market influence is increasingly constrained by the physical reality of export logistics rather than production ambitions alone.
The critical analytical distinction that markets have been slow to absorb fully is that production quota increases and actual export increases are entirely different things while Hormuz vessel crossings remain in single digits. Higher quoted output without corresponding physical delivery creates a divergence between paper supply and actual market availability. This paper-versus-physical disconnect explains why benchmark prices have not fallen proportionately to the scale of announced OPEC+ production increases.
The Strait of Malacca: Is a Second Chokepoint Risk Emerging?
Why Malacca Matters to the Hormuz Story
The Strait of Malacca handled 29% of global maritime oil flows in the first half of 2025, making it the second most critical energy shipping corridor globally. Crude oil accounts for more than 70% of total throughput through Malacca, a structural profile nearly identical to Hormuz. Any disruption applied at Malacca would compound the existing Hormuz supply shock, creating simultaneous pressure on two irreplaceable corridors.
Janiv Shah, VP of commodity markets at Rystad Energy, has warned that any Hormuz-style tolling model applied to the Strait of Malacca could severely disrupt a route already handling an elevated share of global oil flows as shippers seek alternatives to Gulf routing. Bunker fuel supplies in Asian hubs, particularly Singapore, are already tightening as Hormuz constraints redirect vessel routing patterns. Prolonged fuel shortages in Asian bunkering hubs could force carriers to reduce speeds or cancel sailings, further compressing effective maritime capacity.
The Tolling Risk Scenario
Hunter Marston of the Lowy Institute has assessed that a Malacca tolling system would likely violate international maritime law. However, he has cautioned that legal prohibition alone does not prevent operational disruption in the absence of coordinated multilateral security patrols. This is a critical distinction that investors often overlook: legal frameworks governing free passage through international straits have moral and diplomatic weight, but their enforcement depends on active security commitments from major naval powers.
A dual-chokepoint scenario combining simultaneous constraints at both Hormuz and Malacca would represent an unprecedented stress test for global oil logistics, potentially affecting nearly half of all seaborne crude flows at the same time.
The next major ASX story will hit our subscribers first
What Does the Hormuz Crisis Mean for Mining Company Operating Costs?
Diesel as the Direct Transmission Channel
The connection between Strait of Hormuz shipping constraints and oil prices flows directly into mining sector operating costs through diesel fuel. Mining operations are among the most diesel-intensive industrial activities in any economy. Open-pit mining operations use diesel for drilling, blasting support equipment, haul trucks, processing plant power generation, and site logistics. For large-scale operations, fuel can represent 20% to 30% of total cash operating costs.
Current conditions present a particularly challenging cost environment:
- Retail diesel in the US remained at $4.668 per gallon, sitting $0.941 above year-ago levels
- Distillate inventories at 108.6 million barrels are tighter than crude inventories on a relative basis, providing less of a price buffer for diesel specifically
- US refinery utilisation at 96.2% leaves minimal surge capacity to respond to any tightening of crude supply
- The sustained elevation in diesel prices persists even as Brent crude has moderated from its post-ceasefire peak
In addition, the oil market disruption flowing from constrained Hormuz transit has compounded existing cost pressures that were already weighing on mining operators heading into 2026.
Scenario Analysis: Fuel Cost Trajectories for Mining Operations
| Scenario | Hormuz Status | Malacca Status | Brent Range | Diesel Implication |
|---|---|---|---|---|
| Base Case | Gradual recovery | No disruption | $70-$75/barrel | Elevated but stable fuel costs |
| Downside Case | Single digits through August | Tolling concerns escalate | Above $75/barrel | Fuel costs rise further; hedging critical |
| Upside Case | Normalise to pre-conflict levels | No disruption | Below $70/barrel | Diesel relief; spot buyers benefit from Saudi OSP cut |
Companies purchasing diesel at spot prices could potentially benefit from Saudi Arabia's $11 per barrel OSP reduction if the price cut flows through to refined product markets. However, continued single-digit Hormuz crossings or emerging Malacca toll risks could negate those savings and push Q3 2026 operating costs above current projections.
Operational Risk Management Considerations
The current environment creates a clear priority hierarchy for fuel cost risk management:
- Diesel hedging through Q3 2026 provides cost certainty against further shipping disruption scenarios and should be the first priority for operations with significant diesel exposure. Exploring commodity hedging strategies is increasingly important for any mining operator with material fuel cost exposure
- Long-term fuel supply contracts insulate operations from spot price volatility more effectively than any hedging instrument in high-disruption environments
- Alternative energy sourcing including renewable energy in mining operations, or LNG where available, reduces structural exposure to Hormuz-driven diesel price volatility over the medium term
- Spot purchasing strategies remain viable only for operations confident in a Hormuz normalisation trajectory, given the downside scenario risk
What Are the Key Indicators That Will Determine Oil's Next Move?
The Three Signals Markets Are Watching
1. Strait of Hormuz Daily Vessel Crossing Count
A sustained recovery toward pre-conflict transit volumes is the single most important physical confirmation signal that Gulf crude exports are normalising. ANZ analysts confirmed that no such recovery had occurred as of the most recent reporting period. Single-digit crossings persisting through August would be the clearest confirmation that physical supply remains constrained regardless of what OPEC+ production quotas say on paper.
2. US Crude and Distillate Inventory Draws
The EIA's latest energy data recorded a crude draw of 3.8 million barrels, already exceeding the 3.0 million barrel threshold that analysts identify as a confirmation signal of genuine physical supply tightness. If draws of this magnitude continue alongside single-digit Hormuz crossings, the market will face accelerating pressure on the inventory buffer that has helped moderate benchmark prices.
3. Malacca Tolling Developments
Any formal announcement or credible threat of transit fees at the Strait of Malacca would introduce a second-order supply risk that current prices have not fully incorporated. Conversely, a multilateral security commitment to free passage through Malacca would meaningfully reduce tail risk and support price moderation toward the lower end of the base case range.
The Outlook: Price Range and Supply Normalisation Timeline
Base Case: $70 to $75 per Barrel Through Q3 2026
The base case assumes that higher OPEC+ output gradually offsets constrained Hormuz exports as vessel crossings slowly recover from single digits toward more functional levels. Saudi Arabia's $11 per barrel OSP cut keeps Gulf crude competitive in Asian markets during the transition period, while US inventory draws moderate as imports gradually recover from their current depressed level of 1.0 million bpd.
Downside Case: Brent Breaks Above $75 per Barrel
The downside scenario requires only two conditions to materialise simultaneously: Hormuz crossings remaining in single digits through August with no clear normalisation timeline, and Malacca tolling concerns escalating to the point of introducing a second chokepoint risk premium into crude pricing. In this scenario, the 3.0 million barrel weekly inventory draw threshold becomes a floor rather than a ceiling, confirming physical tightness at a scale that OPEC+ production quotas cannot offset through paper supply increases alone.
Long-Term Normalisation: A Multi-Month Process
Even under an optimistic reopening scenario, analysts expect months of market normalisation. The reasons are structural rather than political:
- Infrastructure damage at upstream production facilities requires physical repair time that cannot be accelerated by diplomatic agreements
- Halted upstream production cannot be restarted immediately without pressure management, equipment certification, and workforce mobilisation
- Depleted commercial inventories across the entire supply chain must be rebuilt barrel by barrel before the market returns to its pre-conflict buffer position
- Operator confidence in Hormuz safety requires a sustained period of incident-free transits before shipping companies voluntarily resume normal scheduling
The Hormuz crisis has exposed the structural fragility of a global oil logistics system routing 20% of supply through a single 33-kilometre passage. Whether prices stabilise or spike further in Q3 2026 will be determined not by production quotas, but by the daily vessel crossing count at Hormuz and the integrity of the Malacca corridor.
Frequently Asked Questions: Strait of Hormuz Shipping Constraints and Oil Prices
How much oil passes through the Strait of Hormuz?
Under normal operating conditions, the Strait of Hormuz handles approximately 20% of total global oil supply. Crude oil accounts for more than 70% of all maritime throughput through the strait, making it the single most critical energy shipping corridor in the world.
Why haven't oil prices fallen more despite OPEC+ production increases?
OPEC+ has raised output targets by 188,000 bpd for August, following similar increases in June and July. However, production quota increases do not translate into actual export increases while Hormuz vessel crossings remain in single digits. US crude inventories sit 7% below their five-year average and distillate inventories are 8% below average, providing a structural price floor that limits the downward impact of higher quoted supply.
What is the Persian Gulf Strait Authority?
The Persian Gulf Strait Authority is an entity established by Iran's Revolutionary Guards requiring vessels to obtain passage permits and carry Iranian-approved insurance before transiting the Strait of Hormuz. Some vessels have reportedly paid direct tolls to Iranian forces in exchange for safe passage, creating a formalised control mechanism over one of the world's most critical shipping lanes.
How does the Hormuz disruption affect mining companies?
Mining operations are among the most diesel-intensive industries globally. With distillate inventories 8% below their five-year average and US retail diesel at $4.668 per gallon, nearly $0.94 above year-ago levels, fuel costs remain structurally elevated. Any further tightening of Hormuz transit or emerging disruption at the Strait of Malacca would push diesel prices higher, directly increasing operating costs for mining companies that have not hedged their fuel exposure.
What would signal that the Hormuz crisis is resolving?
The clearest resolution signal would be a sustained return of vessel crossings to pre-conflict daily averages, accompanied by a rebuild in US crude and distillate inventories toward their five-year seasonal norms. Until both conditions are met simultaneously, the physical oil market will remain structurally tighter than headline OPEC+ production figures suggest.
Could the Strait of Malacca face similar disruption?
Analysts including Janiv Shah at Rystad Energy have flagged the risk that a Hormuz-style tolling model could be applied to the Strait of Malacca, which handled 29% of global shipping flows in H1 2025. While Hunter Marston of the Lowy Institute has assessed that such a system would likely violate international maritime law, he has cautioned that legal prohibition alone does not guarantee operational continuity without active multilateral security enforcement.
This article contains forward-looking statements, scenario projections, and price range estimates that are inherently speculative. All figures are sourced from publicly available data including EIA reports, Lloyd's List Intelligence, and analyst commentary as cited. Readers should conduct their own research and consult qualified financial or commodity advisors before making investment decisions based on the analysis presented here.
Want to Stay Ahead of Commodity Discoveries Driven by Energy Market Shifts?
When oil price volatility and supply chain disruptions reshape mining operating costs, identifying the right mineral discoveries at the right time becomes critical. Discovery Alert's proprietary Discovery IQ model instantly notifies subscribers of significant ASX mineral discoveries — turning complex market data into actionable opportunities — so explore the historic returns major discoveries have delivered and begin your 14-day free trial at Discovery Alert to position yourself ahead of the market.