July 10, 2026
The Geography of Vulnerability: Why One Narrow Passage Holds the Global Economy Hostage
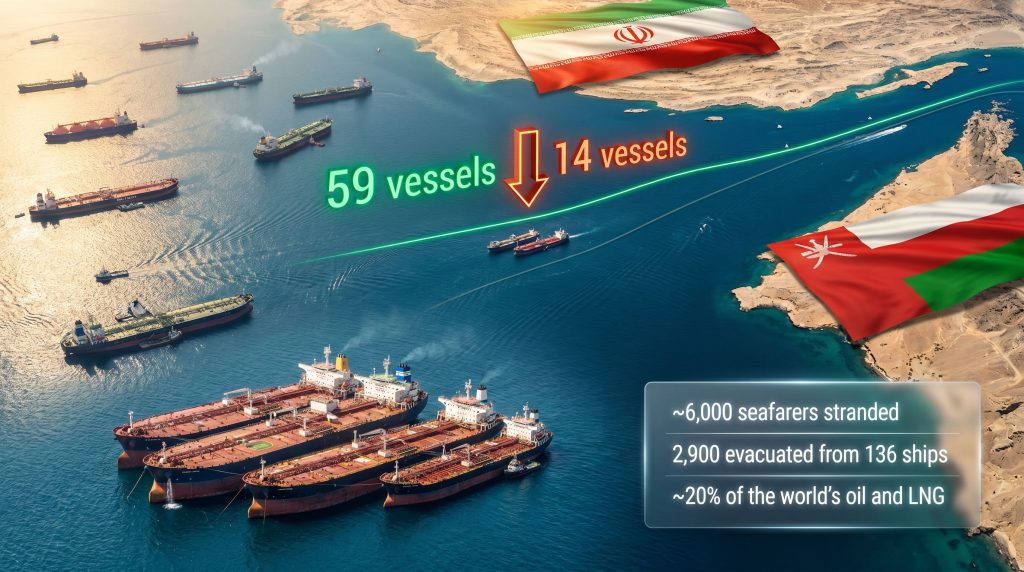
Every major energy market on Earth carries a hidden structural fragility, one that rarely surfaces in day-to-day trading but becomes impossible to ignore the moment geopolitical conditions deteriorate. That fragility has a name and a precise location: a 33-kilometre-wide corridor of water separating the Iranian coastline from the Omani shore, through which roughly one-fifth of all oil and liquefied natural gas consumed globally must pass.
The Strait of Hormuz shipping crisis that has unfolded across July 2026 represents one of the most severe disruptions to this corridor in modern history. With Strait of Hormuz shipping grinding to a near standstill after US strikes on Iran, the world's most critical energy chokepoint is now operating at a fraction of its normal capacity. Furthermore, this is forcing energy importers, freight operators, insurers, and policymakers to confront scenarios that were previously treated as low-probability tail risks.
When big ASX news breaks, our subscribers know first
The Mechanics of a Chokepoint: Understanding What Makes Hormuz Irreplaceable
Unlike other strategic waterways such as the Suez Canal or the Malacca Strait, Hormuz cannot be bypassed through a simple alternative routing decision. The Persian Gulf is effectively a geographic cul-de-sac: landlocked on three sides and open only through this single maritime exit. The countries that export oil through it, including Saudi Arabia, the UAE, Kuwait, Iraq, and Iran itself, collectively account for a significant share of global proven reserves. These oil price geopolitics have long shaped energy security strategies across importing nations.
The transit volumes under normal conditions are staggering. On its peak post-ceasefire day of June 24, 2026, ship-tracking data recorded 59 commodity vessel transits in both directions through the strait. That figure collapsed to just 14 transits on July 9, according to data from Kpler, representing a 76% decline from peak activity within a matter of weeks. For context, even during the wartime-restricted period preceding the mid-June interim deal, daily transit counts were running at fewer than 20 vessels, meaning the current situation has dipped below what had previously been considered the conflict-period baseline.
What makes Hormuz particularly difficult to replace is the LNG dimension. Crude oil, while deeply problematic to reroute, can theoretically access alternative pipeline infrastructure in limited volumes. However, the LNG supply outlook presents a different challenge entirely. Liquefied natural gas requires specialised cryogenic carrier vessels, dedicated receiving terminals, and regasification infrastructure at the destination end. It cannot be moved through pipelines across oceans. For Japan, South Korea, and India, which collectively import enormous volumes of LNG from Gulf producers, a prolonged Hormuz closure creates an acute supply vulnerability with no rapid fix available.
From Ceasefire to Collapse: The Escalation Sequence Explained
To understand the current standstill, it is necessary to trace the precise chain of events that dismantled a fragile diplomatic arrangement in a matter of days. These oil market disruptions did not emerge in isolation but rather as the culmination of compounding geopolitical pressures.
The key escalation sequence unfolded as follows:
-
A ceasefire agreement was reached on June 17, 2026, reopening the strait to commercial traffic under mutually accepted terms.
-
In the weeks that followed, transit volumes recovered significantly, averaging 34 commodity vessel crossings per day across the three-week interim deal period, according to Kpler data.
-
Iranian naval forces then attacked three commercial merchant vessels while they were transiting the strait, constituting a direct breach of the ceasefire framework.
-
The United States military launched consecutive days of strikes targeting more than 80 Iranian military installations, including air defence networks, command infrastructure, and over 60 IRGC fast-attack boats.
-
US President Donald Trump formally declared the ceasefire void, eliminating the diplomatic architecture that had enabled the brief traffic recovery.
-
Iran issued routing directives to commercial shipping operators, declaring the strait effectively closed to vessels not complying with Tehran-approved northern corridor routing.
-
Iranian forces conducted retaliatory strikes on US military facilities across Bahrain, Kuwait, and Qatar, expanding the geographic scope of hostilities beyond the strait itself.
This compressed escalation cycle is particularly significant from a market perspective because it demonstrates how rapidly a stabilised situation can deteriorate. The three-week post-deal window created a false sense of normalisation that is now unwinding at speed.
The Dual-Corridor Problem: A Geographic Split With Strategic Implications
One of the least-discussed but most consequential aspects of the current crisis is the functional division of the strait into two operationally distinct corridors with entirely different political and legal statuses.
| Corridor | Status | Controlling Authority | Current Traffic |
|---|---|---|---|
| Northern (Iran-approved) | Operational at minimal capacity | Iranian naval authority | Minimal observable movement |
| Southern (Omani corridor) | Effectively closed | US-supported Omani routing | No significant commercial traffic |
This split creates an impossible commercial position for most vessel operators. Using the Iranian-approved northern route requires implicit compliance with Tehran's routing directives and raises serious questions around sanctions exposure. Consequently, operators carrying cargoes destined for Western buyers or using vessels flagged in US-allied nations face particularly difficult decisions.
The Omani southern corridor, which has historically been the preferred passage for large tankers due to its depth and navigational characteristics, is currently too dangerous to operate under active hostilities. A further complication arises from transponder-off navigation, the practice of vessels disabling their Automatic Identification System (AIS) to avoid detection. While this means observable traffic data may undercount actual crossings, the practice itself signals elevated risk. Operators who disable AIS face immediate escalation in war risk insurance pricing and may violate flag state reporting obligations under international maritime law.
6,000 Seafarers: The Human Cost Behind the Shipping Data
Transit volume statistics and commodity pricing models can obscure the human dimension of a crisis at sea. Approximately 6,000 seafarers are currently stranded aboard vessels anchored or drifting across the Persian Gulf, unable to safely transit the strait or access evacuation options. According to Bloomberg reporting, shipping traffic through the strait has come to a near standstill, underlining the severity of this humanitarian situation.
Before the security environment deteriorated to its current state, coordinated maritime evacuation operations had extracted 2,900 crew members from 136 vessels, a partial response that now appears to have stalled indefinitely. The suspension of further evacuation efforts reflects the elevated threat environment, but it also places vessel operators in a legally and ethically precarious position.
The Maritime Labour Convention (MLC 2006), administered through the International Maritime Organization, establishes clear obligations around seafarer welfare, repatriation rights, and maximum service periods aboard vessels. Extended standoffs of the type currently unfolding in the Persian Gulf have historically triggered formal flag state complaints and, in severe cases, international arbitration proceedings against shipowners.
P&I (Protection and Indemnity) insurance clubs, which provide liability coverage to vessel operators, are now facing a growing queue of crew welfare claims that will take months to fully process. The financial and reputational exposure for operators with large fleets anchored in the Gulf is compounding by the day.
The Financial Architecture of a Maritime Crisis: Insurance, Freight, and Supply Chain Exposure
Beyond the immediate humanitarian situation, the Hormuz standstill is generating cascading financial consequences across the global shipping industry.
War risk insurance dynamics during Hormuz disruptions:
-
War risk premiums for Gulf-transiting vessels have historically risen by 300 to 500% during periods of active military conflict in the region
-
The Joint War Committee (JWC), which maintains listed area designations that directly trigger mandatory premium increases, is expected to revise Gulf coverage terms based on the current threat environment
-
Voyage-specific additional war risk premiums, which are charged on top of annual policy costs, become commercially prohibitive during active hostilities, effectively pricing smaller operators out of the market entirely
-
Hull and machinery underwriters are also reassessing coverage terms for vessels that have been at anchor in the Gulf for extended periods, as prolonged static positioning creates its own insured risk profile
The freight rate implications follow a similar pattern. When vessel supply is constrained by risk avoidance, the vessels willing to attempt transit or operate alternative routes command significant rate premiums. The Cape of Good Hope diversion, which adds approximately 15 to 20 additional sailing days per voyage, forces charterers to pay for extended vessel utilisation while simultaneously tightening the effective supply of available tonnage globally.
The next major ASX story will hit our subscribers first
Multi-Domain Pressure: The US Sanctions Dimension
The military strikes represent only one layer of the pressure being applied to Iran. The US Treasury Department's revocation of a sanctions waiver that had previously permitted Iranian oil exports adds a significant economic dimension to the crisis architecture. In addition, broader geopolitical trade tensions are reshaping the strategic calculations of every major energy importing nation.
This matters for energy market analysis because Iranian oil export revenue has historically been a primary funding mechanism for IRGC operational capacity. Disrupting that revenue stream while simultaneously degrading IRGC naval infrastructure creates a compounding pressure that is qualitatively different from purely military action. The doctrine being applied reflects a multi-domain coercion strategy: simultaneously targeting Iran's military capability, its revenue base, and its freedom of maritime action.
For global oil markets, the sanctions escalation adds a supply-side overlay to the transit disruption. Iranian crude that might otherwise flow through alternative mechanisms is now subject to tightened enforcement, removing what had been a partial pressure valve for tight global supply conditions. Furthermore, OPEC market influence will play a critical role in determining how quickly any supply shortfall can be offset by member state production increases.
Strategic Scenario Analysis: Three Pathways Forward
Energy markets, freight operators, and policymakers are currently pricing across three distinct resolution scenarios, each with materially different implications for oil prices, freight rates, and supply chain stability.
Scenario 1: Rapid Diplomatic Re-engagement (Low Probability)
Oman has historically served as a back-channel mediator between Washington and Tehran, and any confirmed Omani diplomatic engagement would represent a leading indicator of ceasefire talks resuming. Under this scenario, transit volumes could recover toward the post-deal average of 34 vessels per day within one to two weeks, containing oil price pressure and allowing insurance premiums to begin normalising within 30 days.
Scenario 2: Prolonged Standoff With Partial Traffic (Base Case)
The Iran-approved northern corridor continues to operate at reduced capacity while the Omani southern passage remains closed. Daily transits stabilise in the 10 to 20 vessel range for several weeks. IEA member nations coordinate strategic petroleum reserve (SPR) releases to buffer supply shortfalls. The seafarer crisis deepens sufficiently to prompt formal UN and IMO intervention. Global oil markets absorb a moderate supply shock without a full price dislocation.
Scenario 3: Full Strait Closure and Escalation (Tail Risk, High Impact)
Iran enforces a complete transit ban backed by active naval interdiction, removing approximately 20% of seaborne oil volume from global supply chains simultaneously. Emergency IEA SPR releases, OPEC+ production increases, and intensive diplomatic crisis management are all activated in parallel. Freight and insurance markets effectively suspend commercial coverage for the region, and energy prices across all benchmarks face extreme upward pressure.
Key Indicators to Monitor for Signs of Resolution
For market participants tracking the evolution of this crisis, the following data points represent the most reliable leading indicators of directional change:
-
Daily AIS transit counts through the strait: recovery above 30 vessels per day would indicate meaningful de-escalation
-
War risk insurance premium movements: declining premiums signal improved market confidence in security conditions
-
Omani diplomatic activity: any confirmed engagement between Muscat and either Washington or Tehran historically precedes ceasefire framework discussions
-
IEA strategic petroleum reserve announcements: coordinated SPR releases indicate member governments are preparing for a prolonged disruption scenario
-
US Treasury sanctions posture: any reinstatement of the Iranian oil export waiver would represent a significant de-escalation signal from Washington
-
IRGC naval posture in the strait: satellite imagery and AIS data showing reduced fast-boat activity near established shipping lanes would indicate lower interdiction risk for commercial operators
Crisis in Numbers: The Hormuz Standstill at a Glance
| Metric | Figure |
|---|---|
| Share of global oil and gas transiting Hormuz | ~20% |
| Strait width at narrowest point | ~33 kilometres |
| Peak daily transits post-ceasefire (June 24, 2026) | 59 vessels |
| Post-deal average daily transits | 34 vessels |
| Daily transits on July 9, 2026 | 14 vessels |
| Decline from peak to near-standstill | 76% |
| Seafarers stranded in the Persian Gulf | ~6,000 |
| Seafarers evacuated before suspension | 2,900 (from 136 ships) |
| Iranian military installations struck | 80+ |
| IRGC fast-attack boats destroyed | 60+ |
| Ceasefire agreement date | June 17, 2026 |
| Cape of Good Hope diversion time penalty | 15 to 20 additional sailing days |
| Historical war risk premium spike during Gulf conflict | 300 to 500% |
The scale of disruption reflected in these figures underscores why energy security analysts treat Hormuz as categorically different from other geopolitical risk factors. Its combination of geographic irreplaceability, volume concentration, and the absence of adequate alternative infrastructure means that even partial, temporary disruptions generate disproportionate consequences across global commodity, freight, and insurance markets. NDTV Profit has reported extensively on how global shipping remains at risk as the Strait of Hormuz situation continues to evolve.
Readers seeking ongoing coverage of oil and gas developments across the Middle East and Asia can follow reporting from ET EnergyWorld at energy.economictimes.indiatimes.com.
This article contains forward-looking scenario analysis and market projections that are inherently speculative. Readers should not treat scenario descriptions as financial advice. Energy market conditions, geopolitical developments, and shipping data referenced reflect information available as of the publication date and are subject to rapid change.
Want to Track the ASX Commodity Stocks Most Exposed to Global Energy Disruptions?
When geopolitical shocks like the Hormuz standstill ripple through global energy markets, the consequences for ASX-listed oil, gas, and LNG-exposed companies can be swift and significant — Discovery Alert's proprietary Discovery IQ model scans ASX announcements in real time, delivering instant alerts on material mineral and energy discoveries so investors can act before the broader market catches on. Explore Discovery Alert's dedicated discoveries page to understand how major commodity discoveries have historically generated exceptional returns, and begin a 14-day free trial to position yourself ahead of the next market-moving event.