July 10, 2026
The Chokepoint That Holds the World's Energy System Hostage
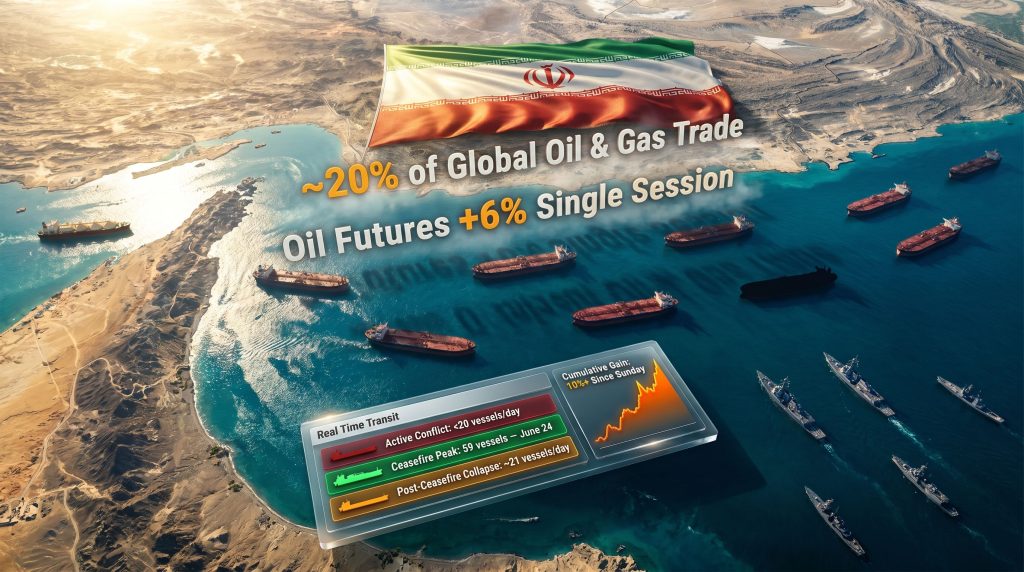
Every few decades, a single geographic feature reminds the world how fragile its energy architecture truly is. The Strait of Hormuz, a narrow passage measuring roughly 21 nautical miles at its tightest point, is that feature. It is not merely a shipping lane. It is the arterial passage through which approximately 20% of the world's total oil and gas trade flows annually, connecting the Persian Gulf's vast hydrocarbon reserves to consuming economies across Asia, Europe, and beyond.
When this corridor functions normally, it is invisible to most market participants. When it does not, the consequences radiate outward with remarkable speed, translating into fuel price surges, insurance market disruptions, and strategic anxiety across every oil-importing nation on the planet. The Strait of Hormuz shipping near halt after U.S. strikes on Iran has now triggered precisely that chain reaction, and the full economic implications are still unfolding.
When big ASX news breaks, our subscribers know first
Why Hormuz Is Structurally Irreplaceable
Understanding the severity of the current disruption requires appreciating why this particular waterway cannot simply be substituted by an alternative route. The strait runs along Iran's southern coastline, placing Tehran in a position of asymmetric geographic leverage that no diplomatic arrangement has ever fully neutralised. Furthermore, the oil price movements we are witnessing are a direct reflection of just how exposed global supply chains remain to this single corridor.
The commodity categories that depend on unimpeded Hormuz access include:
- Crude oil from Saudi Arabia, Iraq, Kuwait, the UAE, and Iran itself
- Liquefied natural gas (LNG), with Qatar being almost entirely Hormuz-dependent for its export infrastructure
- Refined petroleum products serving Asian refinery supply chains
- Bulk energy carriers serving industrial consumers across South and East Asia
No fully operational bypass exists that can absorb equivalent volumes. The UAE's Habshan-to-Fujairah pipeline provides a partial land bridge to the Indian Ocean, but its throughput capacity sits at approximately 1.5 million barrels per day, a fraction of the tens of millions of barrels that transit Hormuz under normal conditions. Saudi Arabia's East-West Pipeline offers another partial outlet, but it too falls well short of full substitution capacity.
The Iran Revolutionary Guard Corps (IRGC) maintains a persistent naval and drone presence throughout the strait, giving Tehran both the capability and the demonstrated willingness to interdict commercial traffic when political conditions deteriorate. This asymmetry of geography and military posture is what makes Hormuz uniquely dangerous among the world's maritime chokepoints.
The Military Escalation Sequence That Triggered the Current Crisis
The breakdown of Hormuz traffic did not occur in isolation. It followed a compressed sequence of military actions that dismantled a fragile interim arrangement with unusual speed. Understanding OPEC's influence on oil markets is also essential context here, as cartel cohesion becomes increasingly strained when member states face direct threats to their export infrastructure.
Iranian forces attacked three commercial vessels operating in or near the strait, prompting a direct response from U.S. Central Command (CENTCOM). American strikes targeted more than 60 IRGC boats and dozens of other Iranian military assets. Joint U.S. and Israeli operations followed, after which Iranian authorities issued a formal declaration that the waterway was closed, an act with no precise historical precedent. President Trump subsequently declared the existing ceasefire with Iran to be void.
How the Ceasefire Data Reveals the Scale of Loss
This sequence matters because the ceasefire that was destroyed had, for a brief period, produced measurable results. In the three weeks following a U.S.-Iran interim deal in mid-June, average daily commodity vessel transits through the strait reached 34 per day, peaking at 59 transits on June 24, according to vessel-tracking data compiled by Kpler. That represented a substantial recovery from the wartime baseline of fewer than 20 transits per day on most active conflict days.
The collapse of that arrangement has pushed daily transit figures back toward wartime-era levels. On the most recent recorded day, only 21 commodity carriers crossed the strait in either direction, one of the thinnest traffic flows since the interim deal was established.
| Traffic Period | Average Daily Transits | Peak Daily Transits |
|---|---|---|
| Active conflict (wartime baseline) | Less than 20 | Not recorded |
| Interim ceasefire period (mid-June onward) | 34 | 59 (June 24) |
| Post-ceasefire collapse (most recent data) | Approximately 21 | Not recorded |
Dark Shipping: The Hidden Layer of Hormuz Traffic
One of the least-discussed but most consequential dynamics now shaping the crisis is the widespread adoption of what maritime professionals call dark shipping, the deliberate disabling or manipulation of a vessel's Automatic Identification System (AIS) transponder to conceal its location and movement.
AIS is the international standard tracking system that allows vessels to broadcast their identity, position, speed, and course to other ships and port authorities. Under normal conditions, disabling AIS in high-traffic waters is both legally restricted and operationally hazardous. In the current environment, however, tanker operators are calculating that the targeting risk from Iranian military forces outweighs the navigational risks of running dark.
Evidence of this practice is already surfacing in tracking data. An Indian-flagged supertanker and a UAE-based bulk carrier were confirmed to have re-emerged in the Gulf of Oman after transiting the Persian Gulf without broadcasting location signals. An LNG carrier entered the Persian Gulf without activating its tracking signal until it was already inside the waterway. As shipping through Hormuz drops to a near standstill, the scale of dark shipping activity is becoming impossible to ignore.
The critical intelligence gap here is significant: information about dark transits typically takes several days to surface through secondary detection methods, meaning official transit counts almost certainly understate the true volume of covert movement currently underway.
This has a direct bearing on how markets should interpret the published traffic figures. A count of 21 commodity carriers transiting on a given day may reflect not the true total of movements, but rather the fraction willing to operate with their transponders active.
Electronic Warfare: The Navigation Threat Markets Are Not Pricing
Compounding the AIS blackout problem is a separate but related phenomenon that has received far less coverage than it deserves: GPS spoofing and electronic interference in the Gulf of Oman.
Vessel tracking data identified ships southeast of Limah, Oman, appearing to travel at implausible speeds of at least 30 knots, a signature indicator of GPS spoofing or electronic interference from military-grade systems. For context, a laden VLCC (Very Large Crude Carrier) supertanker has a typical operational speed of roughly 14 to 16 knots. A reported speed of 30 knots is physically impossible for such a vessel and indicates that the GPS position data being broadcast is being manipulated.
This type of electronic disruption is consistent with air-defence systems designed to neutralise hostile drone threats, which generate collateral interference with civilian navigation signals. The implications for commercial shipping are substantial:
- Spoofed GPS signals can cause vessels to misreport their position, creating collision risk in a congested, narrow waterway
- Insurance underwriters cannot accurately price risk for voyages where vessel positions cannot be verified
- The combination of dark shipping and GPS spoofing creates a dual information blackout, where neither positions nor cargo movements can be confirmed in real time
- Ship clusters forming near the strait are themselves a visual indicator of navigation interference affecting AIS positioning, as vessels lose confidence in their relative positioning and slow or cluster defensively
This electronic dimension represents a risk layer that energy markets have historically been slow to price, yet it directly affects the physical feasibility of transits even for operators willing to accept the military threat environment.
Market Consequences: Prices, Insurance, and the Shadow Fleet
The financial reverberations of the Strait of Hormuz shipping near halt after U.S. strikes on Iran are already being measured across multiple asset classes. Indeed, the trade war impact on oil prices that analysts had been modelling in abstract terms has now merged with a genuine physical supply disruption of the first order.
Oil futures surged nearly 6% in a single trading session following the escalation, with cumulative gains exceeding 10% since Sunday night as hostilities intensified. LNG tanker exits through the strait have come to a complete standstill, with only one empty vessel confirmed entering the Persian Gulf. The global LNG supply outlook has consequently darkened considerably, with Qatar's Hormuz-dependent export infrastructure at the centre of that concern.
London-based marine insurers reported a sharp decline in transit inquiries for Hormuz-bound voyages, with war risk premium rates rising materially. Elevated insurance costs function as a de facto surcharge on any cargo that attempts the crossing, further suppressing commercial incentive to transit even when military conditions might technically permit it.
| Vessel Type | Current Status | Risk Exposure Level |
|---|---|---|
| Crude oil supertankers (VLCC) | Severely reduced transits; dark shipping observed | Extreme |
| LNG carriers | Exits at standstill; one empty vessel entering | Critical |
| Bulk commodity carriers | Sporadic movement; transponder blackouts reported | High |
| Sanctioned tankers (shadow fleet) | Anchored off Pakistan; effectively immobilised | Systemic |
The Pakistan Anchorage: A Shadow Fleet Frozen in Place
Away from the strait itself, a particularly telling signal of structural market stress has emerged off Pakistan's coastline. At least nine empty supertankers with a combined carrying capacity exceeding 18 million barrels have been identified anchored there, according to vessel-tracking data. All nine were previously involved in ship-to-ship transfer operations linked to Russian, Iranian, or Venezuelan crude flows, and at least six of the nine carry active U.S. sanctions designations.
This concentration of idle sanctioned tonnage is not a coincidence of geography. It represents the shadow fleet, the network of vessels that has historically facilitated sanctioned crude flows outside the Western financial system, being effectively locked out of any productive deployment. These vessels ordinarily serve as a buffer layer in global oil logistics, absorbing displaced cargoes and providing flexibility during supply disruptions. Their immobilisation removes that buffer precisely when global traders need it most.
The U.S.-supported transit corridor through Omani-administered waters, established during the ceasefire period as a safer passage alternative, has registered zero observable traffic in post-ceasefire tracking data, indicating that shipowners no longer consider even an escorted route to carry acceptable risk at the current intensity of hostilities.
The next major ASX story will hit our subscribers first
Scenario Analysis: Three Pathways Forward
The trajectory from here is genuinely uncertain, and the range of outcomes carries materially different implications for global energy pricing and supply security.
Scenario 1: Rapid De-escalation
Diplomatic re-engagement through Omani or Qatari intermediaries produces a revised ceasefire within days. Commercial traffic recovers toward the 34-vessel daily average observed during the June interim deal. Oil prices retrace a portion of recent gains as supply anxiety eases. The probability driver here is mutual economic pain recognition: Iran's own oil export revenues are substantially impaired by the closure it declared.
Scenario 2: Prolonged Partial Blockade
Hostilities persist for weeks, with dark shipping and Cape of Good Hope rerouting absorbing a portion of displaced volume. The Cape route adds approximately 10 to 15 additional voyage days between the Persian Gulf and Asian or European destinations, effectively reducing the productive capacity of the global tanker fleet by keeping vessels at sea longer. Freight rates on alternative routes surge. Asian refiners face extended delivery timelines and input cost inflation.
Scenario 3: Full Closure with International Intervention
Iranian authorities enforce the declared closure through active interdiction. International naval coalitions escalate beyond escort operations. Global oil prices breach levels not seen since the post-COVID supply shock. Investment in permanent rerouting infrastructure, including expanded use of the UAE's Habshan-Fujairah pipeline and accelerated pipeline development across the Arabian Peninsula, becomes an urgent strategic priority.
Each scenario carries asymmetric implications for Asia-Pacific energy importers. China, India, Japan, and South Korea collectively represent the dominant destination market for Persian Gulf crude. Japan and South Korea have no cost-effective alternative supply routes capable of substituting Persian Gulf volumes at scale, making their diplomatic and commercial responses in the coming days as consequential as any military development.
Who Bears the Greatest Economic Exposure
The distribution of vulnerability across the Hormuz disruption is uneven and worth mapping explicitly. Consequently, the resulting commodity market volatility is being felt unevenly across regions, industries, and balance sheets.
Asia-Pacific importers face the most acute near-term exposure. Japan and South Korea are structurally dependent on Persian Gulf crude with minimal substitution capacity. India faces a compounding risk: its existing relationships with Russian and Iranian crude suppliers, facilitated partly through the now-frozen shadow fleet, are simultaneously under strain from both the conflict and the sanctions environment.
Middle East exporters face collateral self-harm. Saudi Arabia, the UAE, Kuwait, and Iraq all rely on Hormuz as their primary crude export corridor. Qatar's LNG export infrastructure is almost entirely Hormuz-dependent. These nations collectively have strong economic incentives for rapid resolution, but limited direct leverage over the military escalation dynamics.
European markets face an indirect but real exposure. While Europe has diversified its energy supply base significantly since 2022, Middle Eastern LNG imports remain an important component of the supply mix heading into seasonal demand periods. Any sustained disruption to LNG flows through Hormuz will be felt in European spot gas pricing.
The United States, now a net energy exporter, is partially insulated from direct supply disruption but remains exposed through global benchmark pricing. Brent crude serves as the reference price for the majority of internationally traded oil, and a Hormuz-driven Brent spike transmits directly into U.S. domestic fuel costs regardless of origin. For a broader visual overview of how the strait closure is unfolding, this BBC live coverage of the Hormuz crisis provides continuously updated reporting on developments as they emerge.
Key Metrics Snapshot
| Metric | Data Point |
|---|---|
| Share of global oil and gas trade at risk | Approximately 20% |
| IRGC vessels targeted by U.S. strikes | More than 60 |
| Commercial vessels attacked by Iran | 3 |
| Oil futures surge (single trading session) | Approximately 6% |
| Cumulative oil price gain since Sunday | More than 10% |
| Average daily transits during ceasefire | 34 vessels |
| Peak daily transits during ceasefire | 59 vessels (June 24) |
| Daily transits post-ceasefire collapse | Approximately 21 vessels |
| Idle supertanker capacity off Pakistan | Exceeds 18 million barrels |
| Sanctioned tankers anchored off Pakistan | At least 6 of 9 vessels |
| Reported vessel speeds indicating GPS spoofing | 30-plus knots |
| UAE Habshan-Fujairah bypass pipeline capacity | Approximately 1.5 million barrels per day |
Disclaimer: This article contains forward-looking analysis including scenario projections and market forecasts. These represent analytical assessments based on available information and should not be construed as investment advice. Energy market conditions in active conflict environments are subject to rapid and unpredictable change. Readers should consult qualified financial and geopolitical risk advisers before making investment or commercial decisions based on the dynamics described here.
Want to Stay Ahead of Commodity Market Disruptions Like the Hormuz Crisis?
Discovery Alert's proprietary Discovery IQ model delivers real-time alerts on significant ASX mineral discoveries, instantly translating complex market shifts and commodity volatility into actionable investment insights for traders and long-term investors alike — explore how historic mineral discoveries have generated substantial returns or start your 14-day free trial today to position yourself ahead of the market.