August 24, 2026
The Hidden Architecture of Global Energy Vulnerability
Every barrel of crude oil that leaves the Persian Gulf carries with it an invisible dependency — a geographic constraint so absolute that no engineering solution, no diplomatic framework, and no alternative infrastructure has ever meaningfully resolved it. The world's most consequential energy corridor is not a pipeline, not a refinery, and not a trading hub. It is a 33-kilometre-wide channel of water separating the Omani coastline from Iranian territory, through which the global economy breathes.
Understanding the Strait of Hormuz shipping traffic collapse that has unfolded across 2026 requires more than tracking vessel counts. It demands an appreciation of how maritime chokepoint dynamics interact with geopolitical posturing, insurance market mechanics, and the cascading vulnerabilities of energy-dependent economies operating thousands of kilometres from the source of disruption.
When big ASX news breaks, our subscribers know first
Why the Strait of Hormuz Is Structurally Irreplaceable
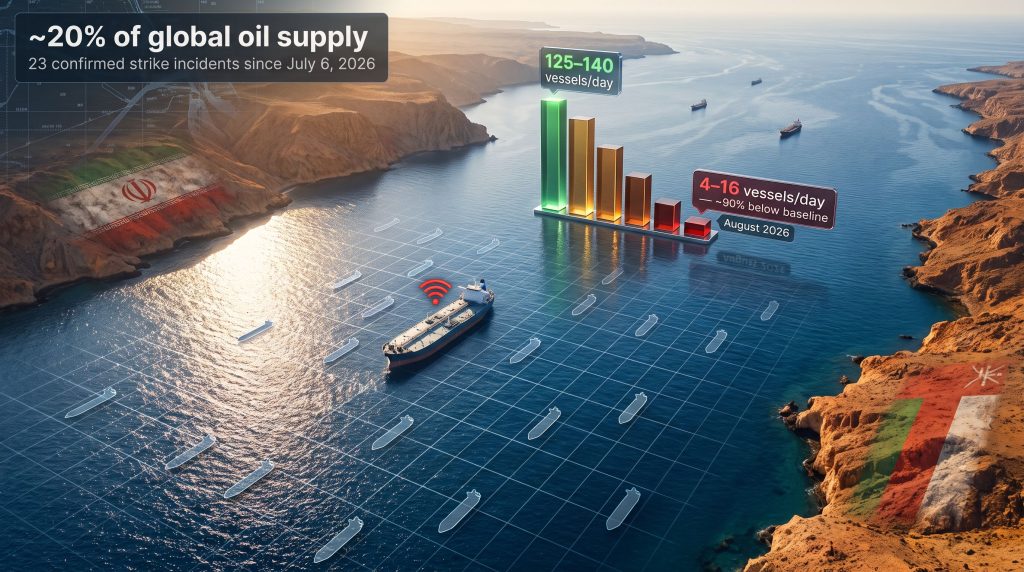
The navigable channel through the Strait of Hormuz is deceptively narrow. At its usable width for large commercial vessels, the shipping lane compresses into two corridors of roughly 3 kilometres each — one inbound, one outbound — separated by a buffer zone. Yet through this constriction, under normal operating conditions, approximately 125 to 140 vessels transit every single day.
The cargo composition of that traffic is what makes the strait irreplaceable. Roughly 20% of the world's combined oil and liquefied natural gas supply exits through this single passage. Saudi Arabia, the UAE, Iraq, Kuwait, Qatar, and Iran all depend on the strait as their primary export gateway. Furthermore, there is no comparable alternative that can absorb those volumes at equivalent cost or speed. These US-China oil tensions have only compounded the structural fragility of this critical passage.
The Baseline Traffic Profile: What Normal Looks Like
| Traffic Category | Normal Daily Volume | Cargo Composition |
|---|---|---|
| Total vessel transits | ~125–140 vessels/day | Mixed commodity |
| Tanker share of total traffic | ~45% | Crude, products, chemicals, LPG |
| Crude and product tankers | ~56% of tanker volume | Persian Gulf exports |
| LPG carriers | ~24% of tanker volume | Regional gas exports |
This baseline matters because it provides the reference point against which the current Strait of Hormuz shipping traffic collapse can be accurately measured. A figure of 13 vessels crossing on a Saturday is not simply low — it represents approximately 90% below pre-conflict norms, a suppression level with no modern equivalent in duration or severity.
Why No Bypass Exists at Scale
Saudi Arabia operates the East-West Pipeline, which connects Eastern Province oil fields to the Red Sea port of Yanbu. The UAE's Abu Dhabi Crude Oil Pipeline (ADCOP) links onshore production to the Fujairah terminal on the Gulf of Oman, bypassing the strait entirely. Both are real assets with meaningful capacity.
However, neither comes close to matching normal Hormuz throughput. ADCOP has a design capacity of approximately 1.5 million barrels per day. Saudi Arabia's East-West Pipeline can carry roughly 5 million barrels per day under optimal conditions, though sustained utilisation at that level has never been demonstrated under conflict conditions. Normal Hormuz oil flows have historically exceeded 17 million barrels per day. The arithmetic of the bypass gap is stark.
Qatar's LNG export infrastructure presents an even more absolute constraint. Qatar's massive LNG terminals at Ras Laffan have no viable overland or alternative maritime bypass. Consequently, if the strait remains closed, Qatari LNG simply cannot reach its customers — a reality that directly affects global LNG supply chains and pricing across Asian and European markets.
The Escalation Timeline: How the Collapse Unfolded
The Strait of Hormuz shipping traffic collapse did not occur gradually. It accelerated in a compressed window following a sequence of escalatory events that progressively destroyed commercial operator confidence.
- Late February / Early March 2026: Initial confirmed strikes on Iranian territory trigger immediate market shock. Tanker transits collapse from approximately 37 per day to near-zero within days as operators halt voyages pending risk assessment.
- April 2026: Reuters-reported data shows as few as 3 to 7 vessels crossing in a 24-hour period, against a baseline of roughly 140. Some individual days recorded near-zero crossings.
- Mid-to-Late April 2026: Multiple reporting sources characterise the strait as effectively at a standstill, with some periods recording zero commercial crossings.
- July 2026: Traffic remains at near-standstill levels, with as few as 2 to 3 commodity vessels recorded on individual days.
- Week to August 21, 2026: United Kingdom Maritime Trade Operations (UKMTO) agency data shows AIS-detected transits approximately 90% below pre-conflict baselines. Over the full seven-day period, 89 vessels exited and 103 entered the strait. According to UKMTO reporting, traffic remains well below normal levels and has been declining since the June 24 to June 26 period, which represented the most recent relative peak.
Weekend of August 23 to 24: A Snapshot of Near-Standstill Conditions
Shiptracker data from Kpler recorded only 4 vessels crossing on Sunday, August 24 — down from 13 on Saturday and 16 on the preceding Friday. These figures represent some of the lowest single-day readings of the entire conflict period. Notably, vessel traffic through Hormuz had already been under sustained pressure for months before these weekend readings were recorded.
| Time Period | Reported Daily Transits | % of Normal Volume |
|---|---|---|
| Pre-conflict baseline | ~125–140 vessels/day | 100% |
| Late Feb / Early March 2026 | ~0 (from ~37 tankers) | Less than 5% |
| April 2026 (peak suppression) | 3–7 vessels/day | Less than 10% |
| July 2026 | 2–3 vessels/day | ~2% |
| Friday, August 22, 2026 | 16 vessels | ~12% |
| Saturday, August 23, 2026 | 13 vessels | ~9% |
| Sunday, August 24, 2026 | 4 vessels | ~3% |
| Week to August 21, 2026 (7-day) | 89 exits / 103 entries | ~10% of normal weekly |
What Is Driving Vessels Away from the Strait
The Strait of Hormuz shipping traffic collapse cannot be explained by a single deterrent. It is the product of compounding risk factors that interact to suppress commercial transit far beyond what any individual threat would achieve in isolation.
The Strike Risk Reality
Since July 6, 2026, UKMTO has logged at least 23 confirmed incidents of projectile strikes on vessels in and around the strait. The damage patterns documented include impacts to bridge structures, engine rooms, and hull integrity. For commercial operators managing vessels valued at hundreds of millions of dollars — and carrying cargo worth tens of millions more — each additional reported incident recalibrates the risk calculus upward.
The AIS Transponder Blackout Problem
One of the less-discussed but analytically critical dimensions of the current crisis is the proliferation of transponder deactivation by vessels attempting to transit. On Friday, August 22, two empty Very Large Crude Carriers (VLCCs) entered the Persian Gulf with their Automatic Identification System (AIS) tracking devices switched off — one bound for Iraq, the other for Bahrain.
This practice, known in maritime circles as dark shipping, creates a compounding analytical problem:
- AIS-based vessel counts understate actual traffic, since vessels operating without transponders are invisible to tracking systems
- Insurance underwriters cannot accurately price risk for vessels whose movements cannot be verified
- Port state control authorities face compliance and sanctions-monitoring gaps when transponders are deactivated
- UKMTO explicitly flags transponder-off transits as a growing data integrity concern in its operational reporting
The implication is that official traffic figures, already alarming at 90% below baseline, may actually overstate the suppression effect in one direction while obscuring continued activity in another. The true picture of what is transiting the strait is, by design, partially concealed.
War-Risk Insurance as an Economic Barrier
For vessels whose operators are willing to accept the physical risk, war-risk insurance premiums represent a separate and often decisive economic barrier. The Lloyd's of London Joint War Committee designates high-risk zones, and elevated classifications in the Persian Gulf region translate directly into premium surcharges. In addition, these surcharges can render individual voyages commercially unviable regardless of the underlying freight rate.
When strike risk, transponder complications, and insurance cost surcharges combine, the deterrent effect multiplies. This is why the traffic suppression has proven so durable rather than recovering as individual operators adapt. The broader trade war oil impact has further compressed the margins within which operators are willing to absorb additional risk costs.
VLCC and VLGC Movement: Reading the Data Within the Data
Despite the near-standstill conditions, a limited volume of Very Large Crude Carrier (VLCC) and Very Large Gas Carrier (VLGC) traffic has continued. This selective persistence is analytically significant.
Key movements recorded around the August 22 to 24 weekend:
- One VLCC carrying approximately 2 million barrels of Emirati crude successfully exited the strait on Thursday, August 21
- Two empty VLCCs entered the Gulf on Friday with transponders deactivated, one bound for Iraq, one for Bahrain
- Eight VLGCs transited the strait across a three-day window: six entering empty, two exiting loaded with Iranian-sourced LPG
The continued movement of loaded VLCCs and LPG carriers, even at dramatically reduced volumes, indicates that some operators are accepting elevated risk premiums to fulfil obligations on the highest-value cargo movements. Empty repositioning voyages, by contrast, are being deferred or cancelled at higher rates because the economic justification is weaker.
This cargo-prioritisation dynamic is a distinctive feature of high-risk maritime environments that does not appear in standard traffic statistics. The vessels still transiting are not representative of normal traffic — they are a self-selected subset of the highest-value, most time-sensitive movements.
The Bab el-Mandeb: A Secondary Chokepoint Under Simultaneous Pressure
The Strait of Hormuz is not the only critical maritime corridor experiencing stress. The Bab el-Mandeb strait, which connects the Red Sea to the Gulf of Aden and serves as the gateway to the Suez Canal route, is also operating under elevated suppression — though at less extreme levels than Hormuz.
| Metric | Strait of Hormuz | Bab el-Mandeb |
|---|---|---|
| Normal daily transits | ~125–140 vessels | ~50–60 vessels |
| Current daily transits (late Aug 2026) | 4–16 vessels | 22–32 vessels |
| Primary cargo | Crude oil, LPG, products | Mixed, including Asian-bound crude |
| Conflict driver | US-Iran hostilities | Regional escalation dynamics |
| Approximate % below normal | ~90% | ~40–50% |
Kpler data for Sunday, August 24 recorded 24 commodity vessels transiting Bab el-Mandeb, down from 32 on Saturday and 22 on Friday. Two VLCCs entered the Red Sea on Saturday — one carrying Iraqi Basrah crude, one empty — confirming continued but cautious commercial engagement through this secondary corridor.
The simultaneous suppression of both chokepoints represents a dual constraint on global energy logistics that has no clear modern precedent in terms of combined duration and severity. Furthermore, these shipping traffic declines are reshaping how energy traders and importers approach supply chain resilience planning.
The next major ASX story will hit our subscribers first
The Supply Disruption Arithmetic: What 90% Below Normal Actually Means
Early-phase conflict reporting attributed approximately 20% of global oil supply losses to the Strait of Hormuz traffic disruption. The countries most exposed to this disruption include:
- Saudi Arabia, whose primary crude export pathway runs through the strait despite partial ADCOP bypass capacity
- Iraq, which has extremely limited overland export alternatives for its southern Basrah crude
- Kuwait and Qatar, which have essentially no viable bypass route for their primary export volumes
- Iran, whose own export capacity — already constrained by pre-existing sanctions — is further suppressed by the conflict environment
Asian importers face the most acute structural exposure:
- India, China, Japan, and South Korea collectively account for the dominant share of Persian Gulf crude demand
- Each of these economies has developed supply chains, refinery configurations, and strategic reserve policies calibrated around Gulf crude access
- Extended disruption accelerates the economic case for supply diversification, but physical supply chain restructuring at scale takes years, not months
The crude oil price trends emerging from this sustained disruption reflect the compounding pressure of reduced throughput, elevated insurance costs, and rerouting inefficiencies across global energy markets.
Historical Comparison: Where the 2026 Crisis Sits in Context
| Crisis Period | Peak Disruption Level | Duration | Resolution Mechanism |
|---|---|---|---|
| Tanker War (1984–1988) | Moderate — selective attacks on tankers | ~4 years | Ceasefire and US naval convoy escort |
| 2019 Tanker Seizures | Low — isolated incidents, limited escalation | Weeks | Diplomatic de-escalation |
| 2026 US-Iran Conflict | Severe — ~90% below baseline across all vessel types | Ongoing (6+ months as of Aug 2026) | Unresolved |
The 2026 disruption is structurally distinct from prior crises in both the breadth of its impact and its duration. The Tanker War of the 1980s involved selective targeting of specific vessels aligned with particular nations. The current environment, however, reflects systemic suppression of commercial transit across all vessel categories and flags, creating a qualitatively different risk environment for operators, underwriters, and importers alike.
Long-Term Structural Consequences for Global Energy Trade
Beyond the immediate supply disruption, the Strait of Hormuz shipping traffic collapse is generating structural adjustments that will outlast any eventual diplomatic resolution.
Infrastructure investment acceleration:
- The economic case for expanding ADCOP capacity and the Saudi East-West Pipeline has never been stronger
- Arabian Peninsula overland pipeline infrastructure that was previously viewed as strategic redundancy is now being evaluated as critical primary infrastructure
Supply diversification by Asian importers:
- Atlantic Basin crudes from West Africa, the United States, and Brazil are gaining commercial attention as Gulf supply uncertainty extends
- Australian LNG exporters, along with US Gulf Coast LNG terminals, are positioned to absorb displaced demand if Qatari LNG supply remains constrained
Renewable energy transition indirect acceleration:
- Supply security shocks of this magnitude historically strengthen the investment case for domestic renewable energy capacity in import-dependent economies
- Japan and South Korea, both heavily dependent on Gulf LNG, face renewed pressure to accelerate hydrogen, nuclear, and renewable capacity build-out
The oil price rally dynamics that emerged earlier in 2025 now appear as a precursor to a far more structurally entrenched period of price volatility driven by physical supply constraints rather than sentiment alone.
Scenario Risk Framework for Investors
The following represents analytical scenario modelling and does not constitute financial advice. All projections involve significant uncertainty.
| Scenario | Probability Assessment | Oil Price Implication | Estimated Duration |
|---|---|---|---|
| Gradual diplomatic de-escalation | Moderate | Gradual price normalisation | 3–6 months |
| Sustained low-level conflict (current trajectory) | High | Elevated volatility, $10–25/bbl premium | 6–18 months |
| Full strait closure or naval confrontation | Low to moderate | Severe spike, potential $50+/bbl shock | Weeks to months |
| Negotiated ceasefire with verification mechanism | Low to moderate | Sharp price correction on announcement | Immediate effect |
Frequently Asked Questions: Strait of Hormuz Shipping Traffic Collapse
How much of the world's oil passes through the Strait of Hormuz?
Under normal conditions, approximately 20% of global oil and liquefied natural gas supply transits the Strait of Hormuz daily. This single passage handles more combined energy volume than any other maritime chokepoint on Earth.
How many ships are currently crossing the Strait of Hormuz per day?
As of late August 2026, daily transits range from approximately 4 to 16 vessels, compared to a pre-conflict baseline of 125 to 140 vessels per day. AIS-detected transits are approximately 90% below pre-conflict levels, according to UKMTO reporting.
Why are ships turning off their tracking devices in the Strait of Hormuz?
Vessel operators are deactivating AIS transponders to reduce targeting exposure following a sustained pattern of projectile strikes. Since July 6, 2026, UKMTO has recorded at least 23 confirmed strike incidents in and around the strait, creating strong incentives for dark-ship operations despite the regulatory and insurance complications this generates.
What alternative routes exist if the strait remains disrupted?
Saudi Arabia's East-West Pipeline and the UAE's ADCOP pipeline offer partial bypass capacity, but neither can handle normal Hormuz volumes. Cape of Good Hope routing via the southern tip of Africa adds approximately 10 to 15 days of transit time and significant additional fuel cost, but remains viable for non-time-sensitive cargoes.
Is the Bab el-Mandeb strait also affected?
Yes. As of late August 2026, daily transits through Bab el-Mandeb are running approximately 40 to 50% below normal levels, representing a significant secondary constraint on energy trade flows to European and Asian markets via the Suez Canal route.
Readers seeking additional context on global energy chokepoints and maritime trade disruption may find value in related reporting from ET EnergyWorld, available at energy.economictimes.indiatimes.com.
Want to Know Which ASX Resource Companies Stand to Benefit From Global Energy Disruption?
Discovery Alert's proprietary Discovery IQ model scans ASX announcements in real time, instantly identifying significant mineral and energy discoveries that could represent actionable opportunities — particularly as supply chain disruptions reshape global commodity markets and redirect capital toward alternative energy sources and resource producers. Explore how major discoveries have historically delivered extraordinary returns on Discovery Alert's dedicated discoveries page, and begin your 14-day free trial today to position yourself ahead of the broader market.