August 24, 2026
How Oil Markets Actually Price Geopolitical Risk: The Iran Sanctions Transmission Mechanism
Commodity markets have a complicated relationship with political announcements. Prices do not simply rise when threats are issued or fall when diplomacy resumes. Instead, crude oil markets operate through a layered system of expectations, probabilities, and positioning that often causes prices to move in the opposite direction of what headline logic would suggest. Understanding how US sanctions on Iran and oil prices interact requires stepping beyond the news cycle and into the architecture of how futures markets anticipate, absorb, and recalibrate geopolitical shocks.
This analysis focuses on Brent and WTI futures, Strait of Hormuz transit risk, sanctions enforcement mechanics, and the demand-side variables that can limit price spikes. It is a policy-to-market framework, not investment advice.
When big ASX news breaks, our subscribers know first
Why Prices Move Before Barrels Disappear
Expectations Drive Crude Volatility, Not Just Exports
One of the most misunderstood dynamics in oil market analysis is the timing gap between a policy announcement and an actual physical supply loss. Futures markets price expectations, not outcomes. When credible sanctions language emerges from Washington, traders begin repositioning within hours, often before a single tanker changes course.
This front-running behaviour creates a paradox: by the time an official announcement arrives, a significant portion of the risk premium may already be embedded in prices. Traders who bought the geopolitical fear on the way up then lock in gains by selling into the announcement itself. This is precisely what unfolded on August 24, 2026, when both major crude benchmarks declined sharply despite the release of some of the most aggressive sanctions language in recent memory.
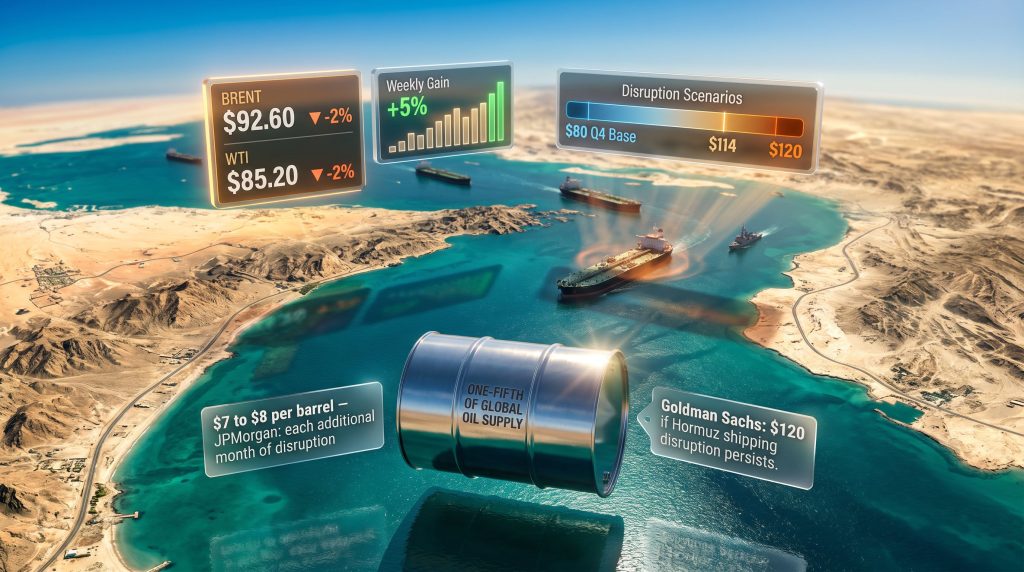
Brent crude futures fell $1.90, or 2%, to $92.60 a barrel, while WTI declined $1.76, or 2%, to $85.20 a barrel, even as the US Treasury Secretary prepared to announce what was described as the toughest sanctions package ever imposed on Iran. Both benchmarks had already logged a second consecutive weekly gain of more than 5% in the prior sessions, meaning the sell-off reflected profit-taking rather than a reassessment of geopolitical risk.
Enforcement Credibility Determines Market Depth
Not all sanctions are created equal in the eyes of crude markets. Traders make rapid distinctions between symbolic measures with narrow enforcement pathways and genuinely disruptive restrictions that target shipping networks, insurance underwriters, and payment settlement infrastructure.
The language used in the August 2026 announcements, which included threats against third-country buyers trading with Iran, signalled a move toward secondary sanctions. This category is analytically distinct from direct Iran-facing measures because it creates compliance pressure on neutral parties, particularly major importers in Asia, without those countries being direct targets of US foreign policy.
Secondary sanctions have historically proven more disruptive to physical supply flows than direct measures, because they force purchasing decisions at the corporate governance level inside foreign firms that depend on access to US financial systems. For a broader understanding of how these pressures shape oil market trade risks, the enforcement architecture matters as much as the policy itself.
Market Reaction vs Structural Supply Risk
| Indicator | Latest Figure | What It Signals | Short-Term Price Effect | Longer-Term Implication |
|---|---|---|---|---|
| Brent Crude | $92.60/bbl | Post-rally profit-taking | Immediate dip | Upside if enforcement holds |
| WTI Crude | $85.20/bbl | Correlated sell-off | Downward pressure | Anchored to Hormuz risk |
| Weekly benchmark gain | +5% (both) | Pre-announcement pricing | Elevated baseline | Compression possible on diplomacy |
| Hormuz transit share | ~20% global supply | Critical chokepoint exposure | Insurance premium spike | Structural repricing risk |
| JPMorgan 3-month scenario | ~$114/bbl Brent | Prolonged disruption | Gradual build | Supply tightness embedded |
| Goldman Sachs stress case | ~$120/bbl Brent | Hormuz shipping disruption | Sharp spike | Demand destruction possible |
How Much Iranian Supply Risk Is the Market Pricing?
The Partial Evasion Problem
A common analytical error is treating sanctioned oil supply as a binary: either the barrels flow or they do not. In practice, sanctioned producers retain significant capacity to sustain partial export volumes through what the industry loosely calls shadow logistics. These include flag-of-convenience tankers, ship-to-ship transfers in international waters, intermediary trading entities in third countries, and heavily discounted pricing to buyers willing to absorb compliance risk.
Reports from trade sources confirmed that Iranian crude offers to Chinese buyers tightened during the August 2026 period, with both availability and pricing shifting as the US blockade constrained Tehran's shipment options. This matters analytically because it signals that enforcement was beginning to bite at the margins of the shadow supply chain, not just at the official level.
The oil market rarely prices Iranian sanctions as a binary on/off shock. It prices a spectrum: partial compliance, partial evasion, transport disruption, and retaliation risk.
China, Shipping Networks, and Payment Friction
The enforceability of sanctions against Iranian oil ultimately depends on three structural chokepoints that have nothing to do with Iranian policy itself:
- Buyer willingness: Chinese state and independent refiners must weigh discounted Iranian crude against the risk of losing access to US dollar clearing systems
- Tanker availability: The pool of vessels willing to carry sanctioned crude is finite and shrinks as insurance restrictions tighten
- Reinsurance constraints: London and European reinsurance markets set the ceiling for what marine insurers will cover, creating cascading withdrawal from sanctioned trade lanes
- Payment settlement friction: Transactions in non-dollar currencies through third-country intermediaries add cost and delay, which gets priced into the discount offered on Iranian barrels
Each of these channels creates a partial, not complete, supply reduction. The market's task is estimating the probability-weighted volume loss across all channels simultaneously.
Why the Strait of Hormuz Matters More Than the Sanctions Headline
The Geography of Irreplaceability
Roughly one-fifth of global oil supply transits the Strait of Hormuz, a navigable channel between the Persian Gulf and the Gulf of Oman that narrows to approximately 33 kilometres at its tightest point. No pipeline infrastructure exists at sufficient scale to bypass this route for Gulf producers. This makes the Strait categorically different from other geopolitical flashpoints: supply disruption here is not a regional problem but a systemic one.
Critically, the price impact of Hormuz disruption is not proportional to the volume of Iranian exports at risk. It scales with the probability that the entire transit corridor becomes operationally unreliable. Even a temporary closure or sustained inspection regime targeting non-Iranian vessels would force rerouting around the Cape of Good Hope, adding weeks of transit time and dramatically increasing freight costs across the full range of Gulf exporters.
What Markets Monitor During a Chokepoint Stress Event
Analysts and physical traders track a distinct set of indicators when Hormuz tension rises:
- Vessel passage frequency and AIS (Automatic Identification System) tracking gaps
- Temporary closures, detention events, or inspection regimes imposed on third-party vessels
- Baltic Exchange freight rate movements for Very Large Crude Carriers (VLCCs)
- Lloyd's and specialist marine war-risk insurance pricing in the Gulf corridor
- Official naval escort deployments or maritime security advisories from Western governments
- Red Sea spillover risk, where a simultaneous disruption compounds the supply chain impact
Sanctions-Only Shock vs Chokepoint Disruption
| Dimension | Sanctions-Only Shock | Chokepoint Disruption Shock |
|---|---|---|
| Likely duration | Months to years | Days to months |
| Price sensitivity | Moderate, gradual | High, immediate |
| Physical supply loss | Partial (evasion buffers) | Near-total for transit route |
| Insurance cost impact | Moderate | Severe, systemwide |
| Global refinery exposure | Selective (Iran buyers) | Universal (all Gulf exporters) |
What Bank Scenarios Imply for Brent Prices
Scenario Modelling From Major Institutions
The divergence between base-case and stress-case pricing in current bank research is unusually wide, which itself signals elevated uncertainty. Reviewing the current crude oil prices alongside these scenarios helps contextualise just how significant the potential swing in pricing could be.
JPMorgan has estimated that each additional month of Hormuz-related disruption could add approximately $7 to $8 per barrel to Brent prices. Under a scenario where disruption persists for three months, the bank's modelling points to average monthly Brent prices of around $114 per barrel.
Goldman Sachs has gone further in its stress case, warning that Brent could reach $120 per barrel if shipping disruptions through the Strait persist beyond the initial shock period. However, Goldman's base case assumes eventual de-escalation, with Brent projected to average $80 per barrel in Q4 and $75 per barrel in the following year. The bank explicitly noted that risks remain tilted to the upside, particularly if disruptions extend through both Hormuz and the Red Sea simultaneously.
A useful way to read bank oil scenarios is by asking two questions: how long does the disruption last, and how fully does it interrupt transit rather than just Iranian exports?
Reading These Numbers Correctly
Bank price scenarios are not probability-weighted forecasts with equal likelihood. They represent structured pathways under defined assumptions. The correct analytical frame separates them into three tiers:
- Base case: Assumes partial enforcement, eventual diplomatic engagement, and no sustained transit disruption. Brent normalises toward $75-$80.
- Upside risk case: Assumes full enforcement, Chinese buyer pullback, and prolonged Hormuz tension without physical closure. Brent reaches $100-$114.
- Tail-risk spike: Assumes retaliatory Iranian action targeting transit infrastructure, triggering war-risk insurance withdrawal and vessel avoidance. Brent approaches $120+.
Political Signals From Washington and Tehran
Secondary Pressure and Compliance Cascades
The August 2026 US posture extended beyond direct Iran-facing restrictions. Presidential-level threats against countries trading with Iran represent a qualitative escalation in sanctions architecture. When secondary sanctions are credibly threatened, compliance decisions shift from Iranian entities to the legal and risk departments of third-country importers, banks, and shipping firms. This creates a self-reinforcing compliance cascade that can reduce Iranian export volumes faster than bilateral enforcement alone. The US Treasury's OFAC sanctions programmes provide the formal legal framework underpinning these measures.
Internal Iranian Dynamics and Escalation Risk
Iran's response posture is not monolithic. Analysis from IG Markets noted that pragmatic elements within the Iranian leadership have shown preference for de-escalation, while hardline factions appear willing to absorb economic pressure rather than make concessions. Commonwealth Bank of Australia's commodities research highlighted that if maximum-pressure measures prove effective in economically isolating Iran, the country's incentive to respond through destabilising action in regional energy corridors could increase rather than decrease.
This creates a counterintuitive risk: successful sanctions enforcement may increase, not reduce, the probability of a kinetic escalation that triggers the very Hormuz disruption that markets fear most.
Two Pathways Markets Must Price Simultaneously
De-escalation path:
- Softer enforcement or carve-outs for key buyers
- Diplomatic back-channel engagement resumes
- Freight and war-risk premiums compress
- Brent drifts toward Goldman's base-case range
Escalation path:
- Secondary sanctions force Chinese buyer pullback
- Iran retaliates through maritime disruption
- War-risk insurance withdrawal reduces transit volumes
- Brent reprices sharply toward triple-digit territory
The next major ASX story will hit our subscribers first
Are Price Moves Driven by Fundamentals or Trader Psychology?
The Buy-the-Rumour, Sell-the-News Dynamic
The August 24 price action illustrates a recurring behavioural pattern in geopolitical commodity markets. Prices had already incorporated a substantial risk premium during the prior two weeks, rising more than 5% on both major benchmarks. When the announcement arrived, the enforcement specifics failed to materially exceed what traders had already priced, triggering a classic buy-the-rumour, sell-the-news reversal.
This pattern is particularly pronounced in crude oil because the market attracts both physical participants, who care about actual supply, and macro funds, whose positions are driven by scenario probabilities and portfolio risk management. When these two groups have different conviction levels, price action can diverge sharply from apparent fundamental logic.
Investor Psychology Framework for Geopolitical Commodities
- Fear premium: Initial spike driven by worst-case scenario pricing
- Event fatigue: Premium fades as disruption persists without escalation
- Conviction gap: Physical traders and macro funds price different time horizons
- Positioning reset: Profit-taking creates entry opportunities for conviction longs
Indicators to Monitor Going Forward
Policy Indicators
- US Treasury Office of Foreign Assets Control (OFAC) designations and enforcement guidance
- Secondary sanctions wording targeting specific countries or financial institutions
- Maritime security advisories from US, UK, and EU naval commands
- Exemption waivers for humanitarian categories
Physical Market Indicators
- Iranian export volume estimates from tanker-tracking services
- Chinese crude intake data from customs and port statistics
- Hormuz vessel passage frequency and transit delays
- VLCC freight rates and war-risk insurance premiums
- OPEC spare capacity deployment signals
Futures Market Indicators
- Brent-WTI spread widening (signals regional supply stress)
- Front-month backwardation steepening (signals physical tightness)
- Options skew toward upside calls (signals tail-risk hedging demand)
- Open interest shifts in speculative positioning
Could Other Producers Fill the Gap?
Spare Capacity Is Not Instant Supply
Headline spare capacity figures from OPEC members frequently overstate the speed at which replacement barrels can reach global refineries. Crude quality mismatches mean that a refinery configured for light sweet Iranian grades cannot simply switch to heavy sour Arabian barrels without significant processing adjustments. Shipping route reconfigurations add transit time. Political coordination among OPEC members to release capacity requires consensus that is not always available under geopolitical pressure.
Forces That Could Cap a Price Spike
- Weaker-than-expected global demand growth, particularly from Chinese industrial consumption
- Coordinated strategic petroleum reserve releases from IEA member countries
- OPEC voluntary production increases to stabilise markets
- Diplomatic de-escalation reducing the Hormuz risk premium
- Restored shipping confidence following naval escort arrangements
Disruption Duration Framework
| Disruption Length | Market Outcome |
|---|---|
| Short (under 2 weeks) | Market absorbs shock via inventory drawdown |
| Medium (1-3 months) | Inventories tighten, freight premiums spike |
| Prolonged (3+ months) | Structural repricing, triple-digit Brent risk |
Practical Implications for Businesses and Policymakers
For Refiners, Importers, and Airlines
- Review crude hedging books for Middle East exposure concentration
- Assess feedstock flexibility and ability to substitute non-Gulf crude grades
- Model shipping route contingency costs if Hormuz rerouting becomes necessary
- Diversify procurement relationships away from single-corridor dependencies
For Governments and Policymakers
- Assess strategic petroleum reserve drawdown triggers and release capacity
- Monitor inflation pass-through from energy input costs to consumer prices
- Coordinate with maritime security partners on shipping lane protection
- Ensure sanctions compliance communication is clear for domestic importers
Methodology note: Price scenarios referenced in this article are illustrative projections drawn from publicly available bank research. Actual outcomes depend on disruption duration, enforcement intensity, buyer compliance rates, and geopolitical developments that cannot be predicted with certainty. Nothing in this article constitutes financial or investment advice.
FAQ: US Sanctions on Iran and Oil Prices
Do US Sanctions on Iran Always Raise Oil Prices?
Not necessarily. Prices can rise, fall, or whipsaw depending on prior market positioning, the credibility of enforcement mechanisms, and whether the actual supply disruption exceeds or disappoints what traders had already priced in.
Why Can Oil Fall on the Day of a Major Sanctions Announcement?
If markets have already priced in a substantial risk premium during the weeks preceding an announcement, traders will often reduce positions and lock in gains when the official policy is released, particularly if enforcement details are seen as less severe than feared. The Hill's reporting on the immediate market response illustrates precisely how sharply prices can move on such announcements.
How Important Is the Strait of Hormuz to Global Oil Supply?
The Strait carries approximately 20% of global oil supply, making it the single most critical maritime chokepoint for energy markets. Any sustained disruption to transit through this corridor affects all Gulf exporters, not just Iran.
What Brent Price Levels Are Being Discussed in Disruption Scenarios?
Current bank research scenarios range from approximately $114 per barrel under a three-month disruption case (JPMorgan) to $120 per barrel in a more severe shipping disruption scenario (Goldman Sachs).
What Is the Base-Case Outlook if Tensions Ease?
Goldman Sachs projects Brent averaging approximately $80 per barrel in Q4 and $75 per barrel in the following year under its base case, with risks described as tilted to the upside given ongoing Hormuz and Red Sea uncertainty.
The Bottom Line on US Sanctions on Iran and Oil Prices
Oil Is Pricing Enforcement, Duration, and Transit Risk Simultaneously
The relationship between US sanctions on Iran and oil prices cannot be reduced to a simple cause-and-effect formula. What crude markets are actually pricing is a layered probability distribution: the likelihood that sanctions meaningfully reduce Iranian exports, the probability that secondary pressure forces Asian buyers to reduce purchases, and the tail risk that Iran responds in ways that destabilise the Strait of Hormuz for the broader global supply chain.
Duration is the central variable. A brief disruption, measured in days or a few weeks, can be absorbed by existing inventories with minimal long-term repricing. A sustained three-month or longer scenario that combines enforcement pressure with transit uncertainty represents an entirely different category of market shock, one that carries genuine triple-digit Brent risk according to multiple major bank research teams. Furthermore, keeping a close watch on crude oil price trends and oil geopolitics analysis remains essential for understanding how these dynamics evolve over the coming months.
The August 2026 price action, where both benchmarks fell on the day of a historic sanctions announcement after surging 5% in the prior week, encapsulates the complexity perfectly. Markets were not dismissing the severity of the measures. They were simply correcting for the fact that the risk had already been purchased, and the next move would depend not on the announcement itself but on what enforcement actually delivers in the weeks that follow.
Want to Know When Major Mineral Discoveries Hit the ASX Before the Broader Market Does?
While geopolitical forces shape commodity prices globally, the real edge for Australian investors often lies closer to home — in identifying significant ASX mineral discoveries the moment they are announced. Discovery Alert's proprietary Discovery IQ model scans ASX announcements in real time, delivering instant, actionable alerts across more than 30 commodities, and you can explore why historic discoveries generate exceptional returns before starting your 14-day free trial at Discovery Alert.