June 15, 2026
The Strait of Hormuz as a Global Pressure Point: Mapping the Scenarios After the US-Iran Ceasefire
Every major disruption to global energy supply over the past five decades has exposed a single, uncomfortable truth: the architecture of modern commodity markets rests on a handful of physical chokepoints that no diplomatic framework has ever fully secured. The Strait of Hormuz sits at the apex of that vulnerability. Roughly 21 kilometres wide at its narrowest navigable point, it functions as the circulatory system for a significant portion of the world's crude oil, liquefied natural gas, fertilisers, and petrochemicals. When that system is interrupted, the consequences radiate outward across energy markets, industrial supply chains, and financial assets in ways that are rarely fully anticipated.
The announcement in June 2026 that the United States and Iran had reached a US-Iran agreement to end hostilities generated immediate and sharp market reactions. However, the more strategically important question is not what was announced, but what remains unresolved and how the gap between a ceasefire declaration and durable operational normalcy should be priced by commodity market participants.
When big ASX news breaks, our subscribers know first
What the US-Iran Agreement Actually Commits Both Sides To
The framework announced by US President Donald Trump on 14 June 2026 declared an immediate cessation of military operations across all active fronts, the lifting of the US naval blockade, and the authorisation of commercial shipping through the Strait of Hormuz. The formal signing was scheduled for 19 June 2026 in Switzerland, with Pakistan's Prime Minister Shehbaz Sharif identified as the primary mediating party who facilitated the negotiations between Washington and Tehran.
A critical distinction that markets have been slow to internalise is the legal character of the framework itself. What exists at this stage is best classified as a memorandum of understanding rather than a binding treaty. A ceasefire declaration and a comprehensive settlement are fundamentally different instruments, and conflating them creates material risk of mispricing across energy and commodity markets.
The agreement initiated a 60-day period for further technical negotiations. Iran's deputy foreign minister identified the following as the primary negotiating agenda for that window:
- Full removal of all sanctions against Iran
- Resolution of the nuclear enrichment programme parameters
- Economic reconstruction mechanisms
- Release of frozen Iranian assets
- Implementation and verification frameworks
The table below maps the current status of the most consequential unresolved issues against their resolution timelines:
| Unresolved Issue | Current Status | Timeline for Resolution |
|---|---|---|
| Sanctions relief scope | Under active negotiation | Within 60-day window |
| Frozen Iranian assets | Terms entirely undefined | Subject to further talks |
| Nuclear enrichment limits | Framework language only | Technical talks pending |
| Strait of Hormuz mine clearance | Partial — mines still present | Operationally uncertain |
| Hezbollah-Israel hostilities | Active flare-up on signing day | Requires separate diplomatic track |
Critical Framing: The 60-day negotiation window is an ambitious construct. The 2015 Joint Comprehensive Plan of Action, which addressed a narrower set of issues with multilateral participation from the P5+1 group, required nearly two years of intensive negotiations to produce. Market participants treating the current framework as a resolved situation rather than a ceasefire with significant optionality are assuming away the most consequential risks.
How the 2026 Framework Compares to the JCPOA
The structural differences between the 2015 JCPOA and the 2026 framework reveal both what has been accomplished and what has not:
| Dimension | JCPOA (2015) | 2026 Framework |
|---|---|---|
| Negotiating format | Multilateral (P5+1) | Bilateral with Pakistan mediation |
| Nuclear scope | Detailed enrichment limits | Framework language only |
| Sanctions relief | Phased and conditional | Terms undefined |
| Military component | None | Ceasefire plus Hormuz reopening |
| Verification mechanism | IAEA-led with inspections | Not yet established |
| US domestic political support | Contested; withdrawn in 2018 | Framed as strength-based |
| Durability outcome | Collapsed under US maximum pressure | Unknown |
US Defense Secretary Pete Hegseth characterised the agreement as having been achieved through military leverage rather than multilateral diplomacy, emphasising the US capacity to reimpose the blockade at any point. While this framing reinforces credibility with domestic audiences, it simultaneously signals reversibility to Iranian hardliners and regional actors, which is historically correlated with lower deal durability in security agreements of this type.
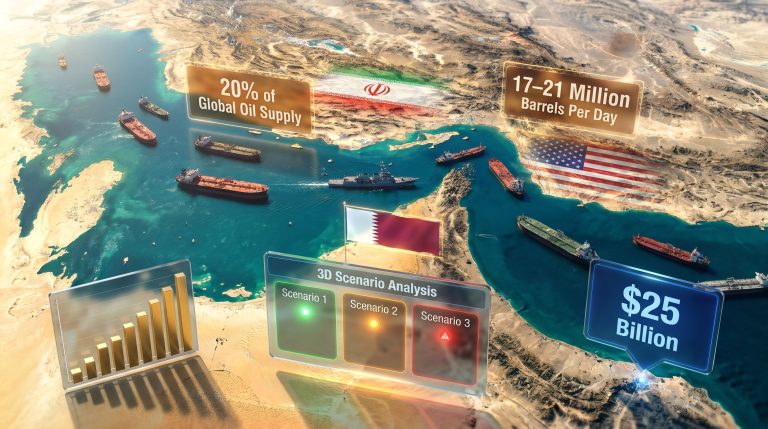
The Strait of Hormuz: Why the Numbers Tell a Sobering Story
Before the conflict began, the Strait of Hormuz was the transit route for approximately one-fifth of global oil supply, with historical baseline flows of 14 to 15 million barrels per day and an average of 130 vessels passing through daily. The conflict's impact on these flows has been severe, and the data emerging from vessel tracking analytics tells a more alarming story than official estimates suggest.
US Energy Secretary Chris Wright, speaking at the Bloomberg Energy Security Executive Briefing in Houston on 12 June 2026, estimated that approximately 7 million barrels per day were moving through the strait at that point, characterising the figure as a rough average that was trending higher. However, oil industry executives including Chevron's chief executive publicly questioned whether the actual throughput was meaningfully lower than the official estimate, noting that a significant portion of transiting vessels were operating with their Automatic Identification System (AIS) transponders disabled, transiting at night, and moving with US military assistance.
Vessel tracking data from specialist analytics providers painted an even starker picture:
- Mideast Gulf crude exports through the strait in June 2026 averaged just 226,000 to 330,000 barrels per day based on AIS-visible vessel data
- This represents a fraction of the pre-war baseline of 14 to 15 million b/d
- So-called "dark transit" behaviour, where vessels disable transponders to avoid targeting, was averaging approximately 4 vessels per day across all segments
- Since the conflict began, the International Maritime Organisation recorded 46 vessel attacks and 14 seafarer deaths
- The US Energy Information Administration projected in its latest Short-Term Energy Outlook that Hormuz traffic was unlikely to recover to pre-war levels before early 2027
The US Navy's operational response has involved guiding vessels through a corridor south of the standard traffic separation scheme, routing ships through Omani territorial waters to reduce exposure to Iranian naval activity in the strait's northern approaches. This "coach corridor" mechanism, as described by marine insurer Skuld, is not formal naval escorting but rather coordinated guidance, an important distinction for insurance underwriters assessing hull risk.
Key Insight: Even a fully ratified agreement cannot immediately restore Hormuz to operational normalcy. Physical mine clearance, insurance recalibration, and demonstrated political stability over multiple weeks must all converge before commercial shipping volumes show meaningful recovery. The US EIA's early 2027 baseline for normalisation should be treated as an optimistic scenario, not a floor.
How Energy Markets Reacted, and Whether the Pricing Was Justified
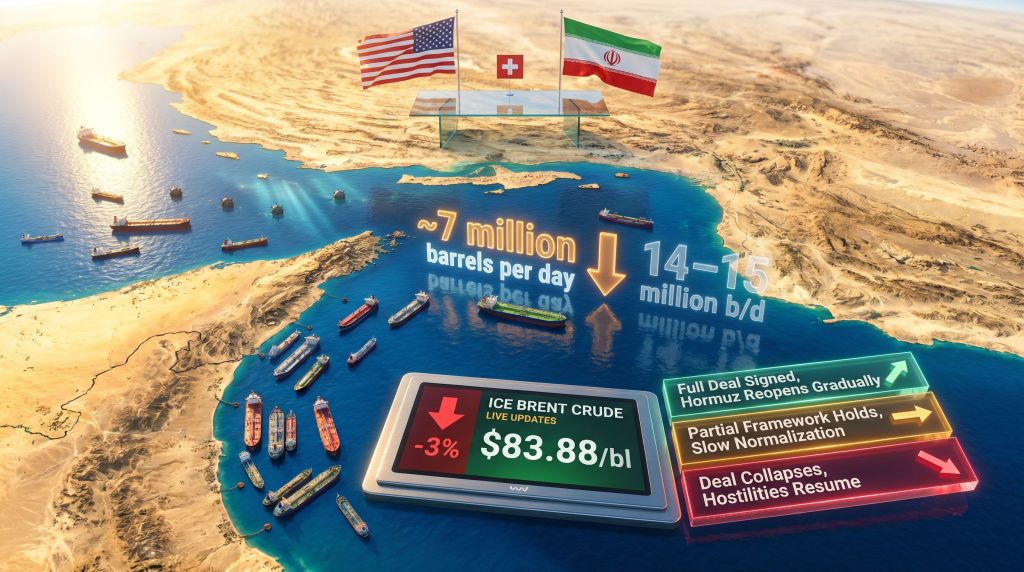
ICE Brent crude futures declined by more than 3% in early Asian trading following Trump's 14 June announcement, with the front-month contract trading at $83.88 per barrel as of 21:34 GMT that evening. The speed of the sell-off reflected markets front-running a deal before its terms were legally binding or operationally verified. Furthermore, crude oil price trends in the months preceding the announcement had already incorporated elevated geopolitical risk premiums, meaning the ceasefire news triggered an outsized repricing event.
This pattern is not without historical precedent. In April 2026, Trump had publicly claimed the Strait of Hormuz was fully open, a characterisation that vessel tracking data subsequently showed to be premature. The gap between political declarations and physical reality has become a recurring dynamic in how this conflict has been covered and traded.
The scenario matrix below maps three plausible outcomes against their probability assessments and market implications:
| Scenario | Near-Term Probability | Brent Crude Impact | Key Trigger |
|---|---|---|---|
| Full deal signed, Hormuz reopens gradually | Moderate | Sustained downward pressure over 12-18 months | Successful June 19 signing plus mine clearance |
| Deal collapses, hostilities resume | Moderate to High | Sharp upward spike; risk premium re-expansion | Hezbollah-Israel escalation or sanctions disagreement |
| Partial framework holds, slow normalisation | Highest near-term | Volatile sideways movement; uncertainty premium persists | 60-day talks stall on nuclear or sanctions terms |
The asymmetric leverage structure of the deal introduces a specific risk dynamic. The US retains the option to reimpose the blockade; Iran retains the physical capacity to re-mine portions of the strait. Security agreements that rely on reversible coercive instruments rather than mutually beneficial compliance incentives tend to generate oil market disruption that does not disappear with the signing ceremony.
The Hidden Commodity Exposures: Steel, Fertilisers, and Industrial Supply Chains
Crude oil dominates the market narrative around Hormuz, but the strait's disruption has cascaded across a much broader range of commodity markets that have received comparatively little analytical attention. In addition, geopolitical mining risks have amplified supply-chain stress in minerals and metals that feed directly into industrial production across Europe and Asia.
Mideast Gulf exports of fertilisers, petrochemicals, and industrial commodities have been severely constrained since the conflict began. The impact on European steel markets provides one of the most quantitatively detailed illustrations of how a geopolitical chokepoint translates into industrial price distortion thousands of kilometres away.
According to Argus Media's price assessments, following the outbreak of the war in late February 2026:
- Italian rebar prices rose by €167.50 per tonne between the conflict's start and the end of May 2026
- German and Spanish rebar prices rose by €100 per tonne over the same period
- Argus' monthly German rebar assessment fell by €15 per tonne on 10 June to €695 per tonne delivered
- Italian domestic rebar assessments declined by €25 per tonne within June alone, standing at €705 per tonne ex-works as of 10 June
The supply-driven rally in European long steel is now giving way to demand-side weakness. The European Central Bank's interest rate trajectory, which represents a headwind for construction activity, the primary end-market for rebar, is compounding the softening. Traders who had restocked ahead of both the conflict and the EU Carbon Border Adjustment Mechanism implementation are now sitting on inventory that faces a weaker forward price environment.
What makes this particularly significant from a macro perspective is the medium-term deflationary scenario now being priced by European steel market participants: if Hormuz reopens fully and crude oversupply materialises, the energy cost component that drove electric arc furnace mill margins higher during the conflict period will reverse, compressing margins in a demand environment already weakened by higher borrowing costs.
The Hezbollah Variable and the Nuclear Dimension
The day the ceasefire was announced, Israeli forces conducted a military strike against what Israel's Defence Forces characterised as a Hezbollah command position in Lebanon. The timing was not coincidental to analysts monitoring the deal's durability. A US-Iran bilateral framework cannot independently govern Israeli military operations, and the Hezbollah-Israel track represents a structurally separate conflict dynamic that intersects with, but is not resolved by, the Washington-Tehran agreement.
Iran's parliamentary speaker publicly questioned whether the US possessed either the political commitment or the practical capacity to honour its stated obligations, a signal that domestic Iranian politics remains an implementation risk independent of what negotiators agree at the diplomatic level.
On the nuclear dimension, Iran has reportedly committed to disposing of highly enriched uranium stockpiles and formally forswearing nuclear weapons development. These are among the most technically complex and politically sensitive elements of the 60-day agenda. The verification architecture required to give these commitments credibility, including international inspection regimes, timelines, and institutional oversight, remains entirely unbuilt.
The sanctions question carries its own structural complexity. Full removal of US sanctions against Iran is listed as a negotiating objective, but the scope, sequencing, conditionality, and potential congressional involvement are all undefined. The precedent of the JCPOA, where sanctions relief was painstakingly constructed and then reversed in its entirety in 2018, creates an institutional trust deficit that technical talks alone cannot quickly overcome.
The next major ASX story will hit our subscribers first
The Energy Transition Argument That the Conflict Has Accelerated
The COP 30 presidency, led by Brazil's Andre Correa do Lago, has explicitly cited the Iran conflict as evidence of the structural vulnerability created by global fossil fuel dependency. This framing, delivered during the Bonn climate talks in June 2026, positions recurring Hormuz-style disruptions as a systemic argument for accelerating electrification and diversifying away from hydrocarbon supply chains concentrated in geopolitically volatile regions. Consequently, energy transition pressures that were already reshaping long-term investment decisions have gained fresh political urgency in the wake of the conflict.
Turkey's proposed global electricity target of 35% of final energy consumption by 2035 is gaining traction within this context and is expected to take centre stage at COP 31. The four structural levers identified by the COP 30 presidency for accelerating the transition include:
- Reforming international financial architecture to link debt relief to clean energy investment
- Strengthening technology sharing, particularly in transportation and hard-to-abate sectors
- Implementing regional and global cooperation mechanisms on trade and investment frameworks
- Prioritising just transition pathways for fossil fuel-dependent economies
Furthermore, critical minerals demand is emerging as a central constraint on how quickly these transition levers can be deployed at scale, as electrification requires substantial volumes of lithium, cobalt, and rare earths that carry their own supply concentration risks. The conflict has reinforced an already-building consensus that concentrating critical energy supply chains through a handful of physical chokepoints represents a systemic risk that market pricing has historically underweighted.
What Market Participants Should Monitor Over the Coming Weeks
The 60-day negotiation window and the June 19 signing ceremony represent a sequence of binary risk events that will define commodity market direction well into the second half of 2026. The following monitoring checklist identifies the variables that carry the greatest price-discovery significance:
- June 19, 2026: Watch for last-minute conditions, delays, or additional Iranian demands attached to the formal signing
- Mine clearance confirmation: Independent verification of physical hazard removal from the strait's traffic lanes, not merely political declarations
- Commercial AIS transit data: Recovery in visible shipping traffic and reduction in dark transit frequency as the most objective indicator of actual normalisation
- Iranian domestic politics: Statements from the Revolutionary Guard and hardline parliamentary factions as the primary signals of implementation risk
- Israeli-Hezbollah developments: Any escalation on the Lebanon front as a potential deal-disrupting event outside the bilateral framework
- Crude inventory builds: Physical supply increases as validation that the deal is operationally effective, not merely politically declared
- US sanctions actions: Concrete executive or legislative movement on Iran sanctions relief as the most credible proof of US commitment
Strategic Takeaway: The US-Iran agreement to end hostilities represents a significant diplomatic development with the potential to reshape global energy supply dynamics for years ahead. However, the operational gap between political announcement and physical normalisation — measured in mine clearance timelines, insurance recalibration, nuclear verification architecture, and 60-day negotiation outcomes — means commodity markets face an extended period of asymmetric uncertainty. Participants who price in full normalisation before the technical talks conclude are discounting the most consequential tail risks.
Frequently Asked Questions
What did the US-Iran agreement announced in June 2026 actually commit both sides to?
The announcement declared an immediate cessation of military operations across all fronts, the authorisation of toll-free passage through the Strait of Hormuz, and the lifting of the US naval blockade. It initiated a 60-day period for further technical negotiations covering sanctions removal, nuclear programme parameters, economic reconstruction, and implementation mechanisms, with a formal signing scheduled for 19 June 2026 in Switzerland.
Is the Strait of Hormuz immediately safe for commercial shipping?
Not immediately. Naval mines remain present in portions of the strait. Iranian officials had not confirmed unconditional passage rights for commercial vessels at the time of the announcement. Marine insurers and ship operators are expected to require a sustained period of demonstrated stability before resuming normal transit volumes, with the US EIA projecting no full normalisation before early 2027.
How much oil flows through the Strait of Hormuz under normal conditions?
Approximately one-fifth of global oil supply, historically around 14 to 15 million barrels per day, transits the strait. Since the conflict began, throughput has been severely curtailed, with vessel tracking data suggesting Mideast Gulf crude exports through the strait fell to between 226,000 and 330,000 barrels per day in June 2026.
What happens if the 60-day talks fail?
A breakdown would likely trigger a sharp reversal in crude prices, renewed risk premiums across energy and commodity markets, and a return to elevated maritime insurance costs. The US has indicated it retains the capability to reimpose the naval blockade, which functions as both a credibility asset and a destabilising signal depending on how Iranian domestic actors interpret it.
Disclaimer: This article contains forward-looking analysis, scenario projections, and probability assessments that are inherently speculative. Nothing in this article constitutes financial or investment advice. Commodity markets are subject to rapid and material change. Readers should conduct their own due diligence and consult qualified advisors before making any investment decisions.
Want to Position Yourself Ahead of Commodity Market Shifts Driven by Geopolitical Events?
Discovery Alert's proprietary Discovery IQ model scans ASX announcements in real time, instantly identifying significant mineral discoveries across the commodities most exposed to global supply chain disruptions — from energy transition metals to industrial minerals — ensuring subscribers receive actionable insights before the broader market reacts. Explore historic examples of how major discoveries have generated exceptional returns and begin your 14-day free trial at Discovery Alert to secure your market-leading advantage.