June 25, 2026
The Geopolitics of Choke: Why the Strait of Hormuz Holds the World's Energy System Hostage
Geography, unlike diplomacy, does not negotiate. For decades, the Strait of Hormuz has occupied a unique position in global energy architecture: a 33-kilometre-wide passage through which roughly 20% of all seaborne oil supply flows on any given day. No pipeline network, no alternative sea route, and no combination of overland infrastructure has ever been built at sufficient scale to replicate what this single corridor provides. That physical reality is the starting point for understanding why the US-Iran deal to reopen the Strait of Hormuz carries consequences that stretch far beyond the two nations that signed it.
The agreement, formalised on June 16, 2026, and signed by US President Trump, Vice President Vance, and Iran's parliamentary speaker Qalibaf, represents the most significant reconfiguration of Middle East energy geopolitics in years. However, calling it a resolution would be premature. It is, more precisely, a structured pause, with a hard 60-day deadline built into its core architecture.
When big ASX news breaks, our subscribers know first
What the 14-Point Memorandum Actually Contains
The interim agreement covers several distinct operational elements, each with its own downstream implications for energy markets:
- Iran consented to permit toll-free commercial vessel passage through the Strait for a 60-day interim window
- Iranian-placed mines are to be removed, and the US naval blockade on Iranian ports is to be lifted
- The deal is formally signed by the three named principals and is scheduled for ratification in Switzerland
- Iran has stated that the US agreed to unblock approximately $12 billion in frozen funds as part of the arrangement
- Future management of the strait, including potential transit fee structures, is subject to ongoing talks with regional partners, including Oman
What the memorandum does not resolve is equally important. Nuclear constraints, the broader sanctions architecture, and the full frozen-asset release framework remain subject to negotiation during the 60-day window. As NBC News reports, Iranian officials have already signalled that toll-free passage may not persist beyond the interim period, with transit fee structures under consideration once the agreement expires.
"The 60-day architecture transforms this agreement into a conditional reprieve rather than a permanent settlement. Markets that price in peace without hedging for re-escalation are operating on an incomplete information set."
Oil Price Mechanics: How Markets Repriced the Risk Premium
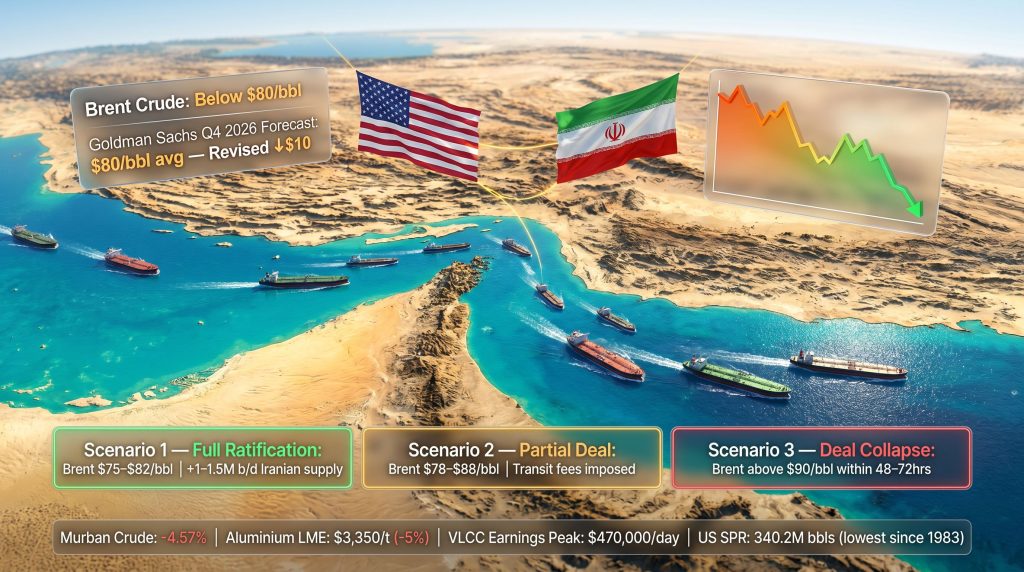
The immediate market reaction was sharp and structurally coherent. Brent crude broke below $80 per barrel for the first time in more than four months following deal confirmation. Goldman Sachs revised its Q4 2026 Brent forecast downward by $10 per barrel, landing at an $80/bbl average, a forecast position subsequently mirrored by Morgan Stanley, indicating broad institutional consensus around a lower price floor.
Furthermore, the broader repricing extended well beyond crude benchmarks. Monitoring crude oil price trends helps contextualise just how dramatic this shift has been:
| Benchmark | Pre-Deal Level (Approx.) | Post-Deal Movement | Change |
|---|---|---|---|
| Brent Crude | ~$90+ | Below $80/bbl | ~-10%+ |
| WTI Crude | Higher | $69.47 | Significant decline |
| Murban Crude | ~$69.63 | $66.45 | -4.57% |
| Indian Basket | ~$75.28 | $70.71 | -6.07% |
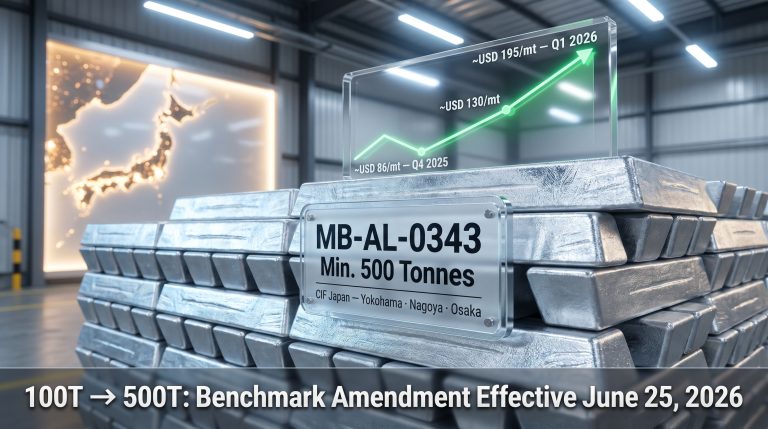
| LME Aluminium (3-month) | ~$3,526/t | $3,350/t | -5% |
| Basra Light | Higher | $71.69 | -4.78% |
The aluminium repricing is a particularly instructive data point. The 5% decline to $3,350 per metric tonne reflects the reopening of Bahraini and UAE smelter supply pathways to global markets, demonstrating that the Hormuz disruption had generated a risk premium across industrial metals, not just crude oil.
Equally telling is the tanker market. Very Large Crude Carriers (VLCCs) had been earning close to $470,000 per day at peak Hormuz disruption, a historically extreme figure reflecting the acute shortage of vessels willing to operate in the conflict zone. Tankers that had been running in "dark mode" with AIS transponders disabled during active hostilities are now re-emerging into normal commercial operations. The unwinding of that shipping premium compounds the downward pressure on crude benchmarks as supply chain normalisation accelerates.
Three Scenarios for the Next 60 Days
The interim structure of the agreement creates a discrete set of forward pathways. Each carries materially different implications for energy prices and geopolitical stability.
Scenario 1: Full Ratification Reached Within the Window (Base Case)
A comprehensive agreement covering nuclear constraints, sanctions relief, and the frozen asset release framework is concluded before the deadline. Under this pathway:
- Brent stabilises in the $75-$82/bbl range as supply normalises
- Iranian crude re-enters Asian spot markets at scale, adding an estimated 1.0-1.5 million barrels per day of incremental supply
- The $12 billion in frozen funds is formally unblocked, providing Iran with meaningful fiscal relief
- Sustained bearish pressure on crude benchmarks persists through H2 2026
Scenario 2: Partial Agreement or Extended Negotiations (Risk Case)
The 60-day window expires without a comprehensive final deal. Interim terms are extended under modified conditions, potentially including transit fees. Under this pathway:
- Oil prices oscillate between $78-$88/bbl as markets reprice partial but unresolved risk
- ADNOC's aggressive spot sales strategy, which saw at least 30 million barrels of UAE crude sold to Asian refiners and traders in June alone, moderates as the supply glut eases
- Tanker markets remain in a state of partial uncertainty, with operators reluctant to commit to long-term rate reductions
Scenario 3: Deal Collapse Triggered by Lebanese Escalation (Tail Risk)
An Israeli military operation in Lebanon disrupts the ceasefire architecture, prompting Iran to withdraw from the memorandum and reimpose restrictions on Strait access. Under this pathway:
- Brent surges back above $90/bbl within 48-72 hours of a credible re-escalation signal
- Qatar's LNG restart, targeting full capacity across 12 of 14 undamaged production trains within approximately one month, is placed on hold
- The tanker market re-enters crisis mode; VLCC daily earnings spike again toward peak-crisis levels
- European natural gas prices, which had been elevated by the combined effect of Hormuz disruption, a heatwave demand surge, and the Ras Laffan explosion, reverse their recent easing trend
"Lebanon represents the single most credible circuit-breaker for this agreement. The asymmetry is important: markets are currently pricing Scenario 1 while the cost of Scenario 3 would fall disproportionately on energy-importing economies with the least flexibility to absorb it."
China's Demand Destruction Compounds the Bearish Setup
The Hormuz reopening is not occurring in isolation. It is intersecting with an independent structural deterioration in the world's largest crude importing nation, creating a simultaneous supply expansion and demand contraction dynamic that few market participants appear to have fully priced. In addition, China oil demand pressures rooted in broader trade tensions have been compounding this structural weakness for months.
China's crude throughput contracted 9.1% year-over-year to 12.7 million barrels per day, according to the country's National Bureau of Statistics, representing one of the most significant demand destruction events in the post-pandemic period. Refinery run rates fell to their lowest level since April 2022, pressured by negative refining margins and a continuing product export ban.
The picture worsens at the import level. Seaborne crude inflows into Chinese ports fell a further 600,000 barrels per day month-over-month in June to 6 million b/d, suggesting the multi-year lows recorded in May were not a floor but part of a continuing trend. China's independent refining sector, commonly known as teapot refineries, cut operations to their lowest activity level since 2017, removing a significant source of marginal crude demand from the Asian spot market.
Perhaps most consequentially for medium-term supply dynamics, China has begun drawing down its strategic and commercial inventories. Kpler data indicates current crude stock levels are approximately 20 million barrels lower than two months prior. With an estimated 1.3 billion barrels held in strategic and commercial storage, this drawdown dynamic reduces China's urgency to re-enter spot markets at scale.
Compounding this energy-specific picture, China's retail sales contracted 0.6% year-over-year, the first consumer spending decline since the COVID-19 pandemic. This metric matters for energy markets because it signals that energy-driven price spikes are transmitting into broader consumption suppression across the Chinese economy.
Structural Risks That Could Prevent a Lasting Settlement
Several structural constraints create friction around the durability of the current diplomatic arrangement, and which energy market participants would be prudent to monitor closely.
The US Strategic Petroleum Reserve problem is perhaps the most underappreciated. SPR volumes have declined to 340.2 million barrels, the lowest level recorded since 1983. The White House faces a statutory obligation to sell a further 88 million barrels across fiscal years 2028-2031, which materially constrains Washington's ability to deploy the SPR as a market stabilisation tool in any future price spike scenario.
The Turkey-Iraq pipeline friction point introduces a separate supply-side risk. Turkey has signalled opposition to extending the Kirkuk-Ceyhan pipeline agreement under current conditions, with the existing contract expiring on July 27. This pipeline is a critical export route for Kurdish crude destined for Mediterranean markets, and its disruption would partially offset any supply gains from Hormuz normalisation.
Russia's export surge creates an additional bearish variable. The four-week average of Russia's seaborne crude export rate has reached 3.83 million barrels per day, the highest pace recorded in 2026. Ukrainian drone strikes on six Russian refineries in June redirected crude from domestic processing toward export terminals, adding incremental supply to an already-softening global market precisely when Hormuz barrels are also returning.
Iraq's OPEC calculus represents a longer-term but potentially significant structural shift. Reports indicate Iraq is actively weighing an exit from OPEC to pursue higher independent production volumes. OPEC market influence over global supply discipline would be materially eroded if confirmed, at precisely the moment markets are absorbing a Hormuz-related supply surge.
The next major ASX story will hit our subscribers first
How Major Producers Are Repositioning for the Post-Hormuz Landscape
Corporate strategy is already adapting to the new price environment, with major producers moving to either monetise windfall profits from the conflict period or reposition for a lower-price regime:
| Company | Strategic Action | Market Implication |
|---|---|---|
| Equinor (EQNR) | Doubled share buybacks from $1.5B to $3B for 2026 | Monetising conflict-era windfall before prices normalise |
| ADNOC (UAE) | Sold 30M+ barrels spot crude to Asian refiners in June | Aggressive market share capture during Gulf supply normalisation |
| QatarEnergy | Preparing full LNG restart at Ras Laffan (12 of 14 trains) | Reclaiming Asian LNG market position post-conflict |
| Venture Global (VG) | Filed FERC application for 11.7 mtpa CP2 LNG expansion | Long-term US LNG capacity expansion independent of deal outcome |
| Chevron (CVX) | Acquired 70% stake in Greece's Block 10 offshore | Geographic diversification away from Middle East concentration risk |
India's response to the shifting landscape is particularly nuanced. The Indian government raised export duties on diesel to $24 per barrel and jet fuel to $21 per barrel, protecting domestic fuel availability as transportation demand climbs. Simultaneously, India boosted US LPG imports to a record high, reducing structural dependency on Middle Eastern supply chains.
The UK is also set to receive its first tanker of Indian-refined jet fuel since January, carrying 500,000 barrels of kerosene from Reliance's Jamnagar refinery, following a temporary lifting of the ban on fuels produced using Russian crude.
LNG, Natural Gas, and the Broader Energy Market Repricing
The Hormuz reopening is reshaping energy markets well beyond the crude complex. QatarEnergy has confirmed readiness to resume LNG production at Ras Laffan, with 12 of 14 LNG trains assessed as undamaged and capable of reaching full output within approximately one month. Qatar has already formalised new crude supply agreements with Taiwanese buyers as Gulf energy trade resumes, signalling a rapid commercial reactivation of supply relationships disrupted during the conflict period.
European natural gas prices, which had been elevated by the intersection of Hormuz disruption, heatwave-driven demand, and the Ras Laffan explosion, are expected to ease materially as Qatari LNG volumes return to global markets. This repricing has broader macroeconomic consequences: a softer European energy price environment feeds into reduced inflation expectations and incremental pressure on the European Central Bank to continue its rate-cutting cycle.
At the US domestic level, US natural gas prices at the Waha hub in West Texas turned positive for the first time since February 2026, reaching $0.42 per MMBtu, supported by rising cooling demand and the end of the spring pipeline maintenance cycle.
FAQ: Understanding the US-Iran Hormuz Agreement and Its Market Impact
What did the US and Iran agree to regarding the Strait of Hormuz?
The two nations signed a 14-point interim memorandum providing for toll-free commercial vessel passage through the Strait for a 60-day window, simultaneous removal of Iranian-placed mines, and lifting of the US naval blockade on Iranian ports. According to Al Jazeera's coverage of the agreement, the deal was signed by US President Trump, Vice President Vance, and Iran's parliamentary speaker Qalibaf, with wide international reactions following swiftly.
How much oil flows through the Strait of Hormuz?
Approximately 20% of the world's total seaborne oil supply transits the Strait, making it the single most consequential maritime energy corridor on the planet. No alternative route exists at equivalent scale or cost.
Will the Strait remain open after the 60-day period expires?
The toll-free passage arrangement is explicitly interim. Future management of the route is subject to further negotiations involving regional partners including Oman. Iranian officials have indicated transit fees may be applied once the toll-free window closes.
How far did oil prices fall after the deal was confirmed?
Brent crude broke below $80 per barrel for the first time in more than four months. Both Goldman Sachs and Morgan Stanley revised their Q4 2026 Brent forecasts downward by approximately $10 per barrel to an $80/bbl average.
What is the primary risk scenario that could unwind the agreement?
An Israeli military escalation in Lebanon represents the most credible near-term circuit-breaker. A failure to reach a comprehensive final deal within the 60-day negotiation window also carries significant re-escalation risk, as the interim terms would lapse without a replacement framework.
What happens to Iran's frozen assets under the deal?
Iran has stated that the US agreed to unblock approximately $12 billion in frozen funds as part of the interim agreement framework. The full scope of sanctions relief remains subject to ongoing final-deal negotiations.
The Conditional Peace: What Energy Markets Need to Understand
The US-Iran deal to reopen the Strait of Hormuz has achieved something significant: it has decomposed a substantial war risk premium from global energy benchmarks in a matter of hours. However, the architecture of the agreement, built around a 60-day negotiating window with unresolved nuclear, sanctions, and asset-release questions, means markets are operating within a conditional reprieve rather than a durable settlement.
The simultaneous convergence of bearish forces makes the price trajectory clearer in the short term but more fragile in its assumptions. Geopolitical trade tensions, China's demand contraction, Russia's record export pace, potential OPEC+ discipline erosion via an Iraqi exit, and the structural weakness of the US Strategic Petroleum Reserve all compound the downward pressure on crude even before the geopolitical uncertainty is factored back in.
For energy market participants, the analytical framework that best captures the current situation is not one of peace being priced in, but of 60 days to determine whether peace can be priced in permanently. The distinction matters enormously for anyone holding positions sensitive to a rapid reversal of the war premium. The US-Iran deal to reopen the Strait of Hormuz is, consequently, best understood as the beginning of a negotiation rather than the conclusion of one.
Disclaimer: This article is for informational and educational purposes only and does not constitute investment advice. Energy market forecasts, scenario projections, and price estimates referenced herein involve significant uncertainty and should not be relied upon as the basis for investment decisions. All figures are sourced from publicly available data at the time of writing.
Want to Position Ahead of the Next Major Resource Discovery Triggered by Shifting Energy Markets?
Discovery Alert's proprietary Discovery IQ model delivers real-time alerts on significant ASX mineral discoveries the moment they hit the exchange, turning complex market shifts — like those reshaping global energy supply chains — into actionable investment opportunities for both short-term traders and long-term investors. Explore how historic discoveries have generated substantial returns on Discovery Alert's discoveries page, and begin your 14-day free trial today to secure a market-leading edge.