
July 28, 2026
The concentration of global energy flows through a narrow waterway between Iran and Oman creates unprecedented vulnerability for international petroleum markets. The Strait of Hormuz closure impact on oil production would represent the largest supply disruption in modern history, potentially removing over 20 million barrels daily from global markets. Furthermore, this chokepoint controls approximately one-fifth of worldwide oil flows, making it a critical strategic asset whose closure would trigger immediate economic consequences far exceeding historical precedents.
The strait's strategic importance extends beyond simple geography, representing a fundamental vulnerability in modern energy infrastructure that could reshape global markets permanently.
Understanding the Strategic Importance of Maritime Chokepoints
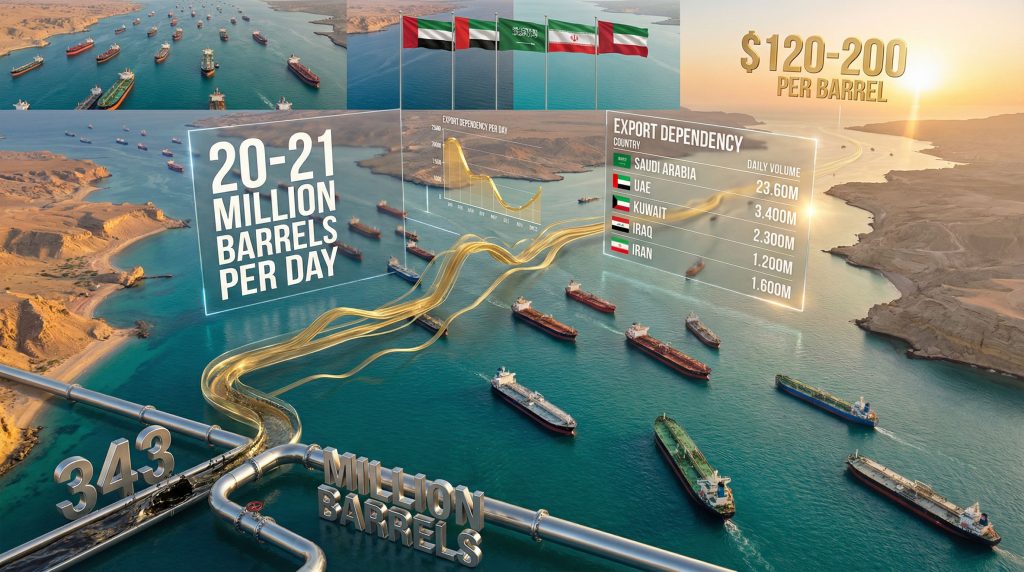
The Strait of Hormuz represents far more than a shipping lane; it functions as the primary artery for global energy security. This narrow waterway, measuring approximately 21 kilometres at its narrowest point, accommodates the passage of roughly 20-21 million barrels per day of petroleum products, representing approximately 20-25% of globally traded oil.
The strategic significance becomes evident through comparison with historical disruptions. The 1973 Arab Oil Embargo removed approximately 4.4 million barrels per day from global markets, causing oil prices to quadruple from $3 to $12 per barrel within months. Similarly, the 1979 Iranian Revolution disrupted 2.9 million barrels per day, driving prices from $15 to $39 per barrel.
However, the OPEC production impact of a complete Hormuz closure would represent a disruption five times larger than these precedent-setting events. Geographic positioning grants Iran significant control over vessel movements through its 12-nautical-mile territorial waters.
The waterway's configuration requires specialised navigation through channels controlled by the Musandam Peninsula, where approximately 16-17 tankers transit daily in each direction during normal operations. This traffic density creates additional vulnerabilities during periods of regional tension.
The strait's underwater infrastructure compounds strategic risks beyond oil markets. Major submarine pipelines and international communication cables traverse these waters, creating potential for cascading disruptions across multiple sectors. Modern VLCC tankers carrying 2 million barrels per vessel represent the backbone of this trade, with VLCCs comprising approximately 50-55% of total Hormuz traffic volume.
Historical maritime disruption patterns reveal escalating economic impacts with each successive crisis. The 1990 Gulf War disrupted 4.3 million barrels per day, causing price spikes to $40 per barrel and demonstrating how regional conflicts translate directly into global energy price volatility.
When big ASX news breaks, our subscribers know first
How Much Oil Actually Transits Through the Strait of Hormuz?
Current petroleum flows through the Strait of Hormuz encompass approximately 19 million barrels daily of liquid fuel exports, including 16 million barrels of crude oil and the remainder comprising refined products, condensates, and liquefied natural gas exports. This volume represents the combined output of seven major Gulf producers: Saudi Arabia, UAE, Kuwait, Iraq, Iran, Qatar, and Oman.
Regional export dependencies reveal critical asymmetries in infrastructure resilience. These factors directly influence oil price stagnation insights and market stability during disruption scenarios.
| Country | Daily Exports (mb/d) | Hormuz Dependency | Alternative Routes |
|---|---|---|---|
| Saudi Arabia | 5.5 | 70% | East-West Pipeline (5 mb/d capacity) |
| UAE | 3.2 | 85% | Fujairah Pipeline (1.5 mb/d capacity) |
| Kuwait | 2.1 | 100% | None available |
| Iraq | 3.8 | 95% | Limited northern routes (0.5-1 mb/d) |
| Iran | 2.6 | 90% | Minimal alternatives |
Kuwait's complete dependency on Hormuz transit creates the most severe vulnerability among regional producers. Without alternative pipeline infrastructure, Kuwait would face immediate production shutdown following any sustained closure.
Iraq's limited northern pipeline capacity through Turkey provides minimal relief, accommodating less than one-quarter of normal export volumes. Saudi Arabia maintains the most robust alternative infrastructure through its East-West Pipeline system, capable of handling 5 million barrels per day to Red Sea terminals at Yanbu.
However, this capacity covers only approximately 65% of typical Saudi exports, leaving substantial volumes dependent on Hormuz routing. The UAE's Fujairah pipeline offers similar partial relief, handling roughly 1.5 million barrels daily through Indian Ocean terminals.
During periods of regional tension, alternative routes demonstrate rapid capacity limitations. The combined alternative pipeline capacity across all Gulf producers totals approximately 6.5-7 million barrels per day, representing only 35% of normal Hormuz throughput.
What Storage Capacity Could Gulf Producers Utilise During a Closure?
Regional storage infrastructure represents the critical buffer determining how long Gulf producers could sustain operations during a Strait of Hormuz closure impact on oil production scenario. Across seven major Gulf producers, available onshore crude storage capacity totals approximately 343 million barrels, equivalent to 22 days of stranded production based on combined regional output rates.
This storage calculation assumes average daily production of 15.6 million barrels across Saudi Arabia, UAE, Kuwait, Iraq, Iran, Qatar, and Oman. Individual country storage capabilities vary significantly, with Saudi Arabia maintaining the largest reserves exceeding 100 million barrels while smaller producers like Oman operate closer to 50 million barrels of available capacity.
Onshore Terminal Characteristics and Limitations
Modern crude storage terminals operate under strict technical constraints that limit emergency utilisation:
• Normal operating capacity: 85-95% of maximum tank volume
• Emergency utilisation ceiling: 98% maximum before operational hazards
• Tank segregation requirements: Multiple crude grades require separate storage systems
• Pressure relief protocols: Safety systems prevent absolute capacity utilisation
These operational realities mean that theoretical storage capacities cannot be fully utilised during emergency scenarios. Tank farms require maintenance of specific temperature and pressure parameters while accommodating different crude specifications for light, medium, and heavy grades.
Maritime Storage Solutions
Floating storage provides additional buffering capacity through approximately 60 empty tankers currently positioned in Gulf waters. These vessels could absorb roughly 50 million barrels of additional crude, extending operational capacity by 3-4 days beyond onshore limits.
Floating storage deployment faces several operational challenges including mooring infrastructure limitations, pipeline connections, maintenance protocols, and storage economics. Daily operational costs for anchoring and monitoring services create economic constraints on extended floating storage strategies.
Combined Storage Window Analysis
Total available storage combining onshore terminals and floating capacity reaches approximately 393 million barrels. This mathematical ceiling represents a hard constraint determined by physical storage limitations rather than market forces or policy decisions.
Storage saturation creates mandatory production shut-ins due to engineering constraints, not economic considerations. These limitations directly affect oil price movements analysis and market dynamics during extended disruption scenarios.
How Long Could Regional Production Continue Without Export Access?
The mathematical constraints of regional storage infrastructure establish a definitive timeline for sustained production during complete Strait of Hormuz closure impact on oil production. Energy analysts calculate that Middle East producers could maintain output for no more than 25 days before storage saturation forces mandatory production halt.
This timeline reflects the intersection of daily production rates with available storage capacity across seven Gulf nations. With combined production averaging 15.6 million barrels per day and total storage reaching 393 million barrels, the calculation yields 25.2 days of theoretical maximum operation.
Extended Timeline Scenarios
Production sustainability follows predictable phases during extended closure:
Days 1-10: Normal Operations with Storage Buildup
• Producers maintain regular output while exports halt
• Storage tanks gradually fill to capacity
• Alternative pipeline routes operate at maximum throughput
• Market psychology drives initial price increases
Days 11-20: Approaching Storage Limits
• Storage facilities reach 90-95% capacity across most producers
• Selective production cutbacks begin at facilities with limited storage
• Floating storage deployment accelerates
• Price volatility intensifies with supply uncertainty
Days 21-25: Critical Storage Saturation
• Storage approaches 98% maximum safe operating levels
• Production cuts become mandatory for operational safety
• Alternative export routes cannot accommodate diverted volumes
• Market pricing reaches crisis levels
Day 26+: Forced Production Shutdown
• Physical storage constraints mandate production halt
• Economic consequences cascade through regional economies
• Strategic petroleum reserve releases become critical
• Alternative suppliers struggle to replace lost capacity
These timeline considerations significantly influence trade war oil impact assessments and emergency response planning.
Production Cut Sequencing
Not all producers face identical timelines due to varying storage-to-production ratios. Kuwait faces earliest shutdown risk due to 100% Hormuz dependency and limited storage, while Iran confronts rapid storage saturation given export volumes and infrastructure constraints.
Saudi Arabia enjoys an extended operational window through East-West Pipeline alternatives, and the UAE maintains moderate resilience via Fujairah routing and storage capacity. These differential impacts create regional economic asymmetries, with producers lacking alternative infrastructure facing earlier revenue losses.
Which Alternative Export Routes Could Partially Offset Losses?
Regional pipeline infrastructure provides limited alternatives for Gulf producers during Strait of Hormuz closure scenarios, but capacity constraints ensure substantial market disruptions regardless of alternative routing utilisation. Moreover, Saudi export strategies play a crucial role in determining regional response capabilities.
Saudi Arabia's Strategic Pipeline Infrastructure
The East-West Pipeline represents the most significant alternative export route, connecting eastern production facilities to Red Sea terminals at Yanbu and Jeddah. This system maintains capacity for 5-7 million barrels per day, though current utilisation typically operates below maximum throughput.
Pipeline specifications include a total length of 1,200 kilometres across Saudi territory with 48-inch main transmission lines featuring expansion capability. Multiple berths at Yanbu handle VLCC loadings, while current utilisation operates at approximately 60-70% of maximum capacity.
Red Sea routing provides access to European and African markets while bypassing Persian Gulf chokepoints entirely. However, this system handles roughly 65% of typical Saudi export volumes, leaving 2-3 million barrels daily dependent on Hormuz transit even with maximum pipeline utilisation.
UAE's Fujairah Bypass System
Abu Dhabi's pipeline to Fujairah terminals offers Indian Ocean access independent of Gulf routing. The system accommodates approximately 1.5 million barrels per day through specialised loading facilities designed for Murban crude exports.
Technical capabilities include a pipeline capacity of 1.5 million barrels per day maximum throughput, deepwater berths accommodating Suezmax tankers, and optimisation for UAE light crude grades. This infrastructure covers roughly 47% of typical UAE crude exports, providing partial but insufficient offset for Hormuz disruptions.
Regional Pipeline Networks
Iraq maintains limited alternative routing through northern pipelines to Turkish terminals, though capacity restrictions and technical challenges limit effectiveness. The Kirkuk-Ceyhan Pipeline maintains theoretical capacity of 1.6 million barrels per day but faces operational constraints including frequent security disruptions.
Current throughput typically ranges from 300,000-600,000 barrels per day actual flow, while 95% of Iraqi crude still requires southern terminal access. Iran's alternative infrastructure remains minimal due to geographic constraints and international sanctions affecting pipeline development.
Kuwait operates without significant alternative export infrastructure, creating complete dependence on Hormuz routing. Geographic positioning and limited pipeline investments leave Kuwait uniquely vulnerable among major Gulf producers.
What Would Be the Immediate Market Impact of a Closure?
Complete Strait of Hormuz closure impact on oil production would trigger the largest petroleum supply disruption in modern history, potentially removing 20+ million barrels daily from international markets. This volume represents approximately four times the scale of the 1973 oil embargo, which caused oil prices to quadruple within months.
Price Shock Modelling
Energy market analysts project unprecedented price movements during sustained Hormuz closure. Immediate response could reach $120-150 per barrel within the first week, with extended closure driving prices to $150-200 per barrel after 10-15 days.
During the storage saturation phase, prices could exceed $200 per barrel as production cuts begin, with continued escalation as spare capacity exhausts. These projections assume normal market functioning, though extreme scenarios could trigger trading halts and emergency measures.
Global Supply Chain Disruptions
Regional flow analysis reveals that 82% of Hormuz transit serves Asian markets, creating concentrated impact across major economies. China receives approximately 40% of total Hormuz flows, facing 8-9 million barrels reduced daily supply with strategic petroleum reserves providing 90-day coverage.
Japan depends on Gulf crude for 60% of total imports, experiencing 2-3 million barrels daily supply loss, though maintaining 180+ days SPR coverage. South Korea imports 75% of crude through Hormuz routing, creating 2.5 million barrels daily exposure vulnerability.
India sources 85% of crude imports from Gulf producers, facing 4-5 million barrels daily deficit with limited strategic reserves requiring immediate alternative sourcing. These nations would experience severe economic impacts from oil supply chain vulnerabilities during extended closure scenarios.
Refined Product Market Disruptions
Beyond crude oil impacts, refined product flows through Hormuz create additional supply chain vulnerabilities. Gasoline exports approximate 1.2 million barrels per day from Gulf refineries, while diesel flows reach 2.1 million barrels per day serving Asian commercial markets.
Jet fuel supplies totalling 800,000 barrels per day would affect international aviation, while petrochemical feedstock disruptions would impact ethylene and propylene supply affecting manufacturing. Regional refining capacity operates near maximum utilisation, limiting ability to compensate for lost refined product imports.
The next major ASX story will hit our subscribers first
How Would Different Regions Adapt to Supply Disruptions?
Regional responses to Strait of Hormuz closure impact on oil production reveal significant variations in adaptive capacity, strategic reserves, and alternative supply access. Understanding these differential capabilities provides insight into global economic impact distribution and recovery timeframes.
Asian Market Responses
Asian economies face the most severe immediate impact due to concentrated dependence on Gulf crude imports. China's strategic approach includes SPR deployment providing 90-day supply coverage, alternative supplier negotiations for increased Russian and Venezuelan imports, demand rationing through industrial sector consumption controls, and refinery optimisation for heavier crude grades.
Japan's resilience framework features extended SPR coverage exceeding 180 days, LNG substitution through increased natural gas power generation, supply diversification via enhanced US shale imports, and conservation measures including industrial efficiency improvements. South Korea's adaptation strategy involves refinery reconfiguration for alternative crude grades, product import acceleration, strategic partnerships through long-term contracts, and economic measures including fuel subsidy programs.
Non-Gulf Producer Advantages
Alternative oil-producing regions would experience significant economic benefits through increased market share and pricing power. US shale production response includes rapid drilling acceleration through DUC well activation, export capacity expansion managing pipeline bottlenecks, improved price realisation reducing WTI-Brent spreads, and investment acceleration toward proven reserves.
West African opportunities encompass enhanced Asian market access as traditional European crude diverts to Asia, price premium realisation favouring light sweet grades, production acceleration through offshore project development, and infrastructure utilisation maximising FPSO throughput.
European Energy Security Implications
European markets demonstrate relative resilience due to diversified supply sources and reduced Middle Eastern dependency. Russian supply maintenance continues through pipeline flows independent of Gulf disruptions, while Norwegian production maximisation enhances North Sea output.
SPR coordination involves EU strategic reserve release coordination, whilst alternative energy acceleration drives renewable deployment and LNG imports. European refining capacity operates with greater feedstock flexibility, enabling processing of various crude grades without major infrastructure modifications.
What Are the Economic Consequences Beyond Oil Markets?
Strait of Hormuz closure impact on oil production extends far beyond petroleum markets, creating cascading economic effects across global supply chains, financial systems, and macroeconomic stability. Understanding these broader implications reveals the true systemic risks associated with chokepoint vulnerabilities.
Shipping and Insurance Industry Impact
Maritime transportation faces immediate disruptions affecting global trade flows. War risk premiums increase from typical 0.05% to 2-3% of vessel value, whilst cargo insurance for petroleum shipments rises 500-1000%.
Alternative routing costs include distance penalties adding 14-21 days for Asian deliveries via Cape of Good Hope, Suez Canal congestion creating increased transit delays, port congestion at Asian terminals facing capacity constraints, and 40-60% higher bunker fuel costs for extended routing.
Tanker fleet reallocation involves VLCC repositioning from Gulf to alternative loading ports, charter rate escalation increasing 300-500% during crisis periods, and deferred maintenance scheduling during high-demand periods.
Global Inflation and Economic Growth
Energy cost increases propagate through economic systems via multiple transmission mechanisms. Consumer price impact includes direct energy costs affecting gasoline and electricity prices, transportation costs escalating air travel and freight rates, food prices rising from agricultural input costs, and manufacturing goods experiencing higher production costs.
Regional economic vulnerability affects emerging markets through higher energy import bills impacting balance of payments, net importers experiencing 1-3% GDP reduction per sustained price doubling, tourism-dependent economies facing reduced travel demand, and manufacturing exporters losing competitiveness from higher energy inputs.
Central Bank Policy Response Scenarios
Monetary authorities face complex policy challenges balancing inflation control with economic growth support. Federal Reserve options include interest rate policy pauses in tightening cycles, SPR coordination with emergency reserve releases, dollar policy benefiting American consumers, and financial stability monitoring of energy sector credit stress.
European Central Bank responses involve inflation targeting with temporary accommodation for energy-driven price increases, currency intervention addressing EUR weakness exacerbating import inflation, banking sector monitoring of energy-intensive industrial loans, and fiscal coordination supporting energy security measures.
How Might Geopolitical Dynamics Influence Closure Duration?
The duration and resolution of Strait of Hormuz closure impact on oil production depends critically on geopolitical factors that determine escalation paths, international responses, and diplomatic resolution mechanisms. Understanding these dynamics provides insight into probable closure timeframes and market recovery scenarios.
Conflict Escalation Scenarios
Regional military dynamics create multiple pathways for closure duration and intensity. Limited engagement scenarios include mining operations creating temporary shipping disruptions, patrol boat harassment causing intermittent traffic interference, and insurance withdrawal halting shipments without formal closure, typically lasting 7-21 days until diplomatic intervention.
Extended conflict scenarios involve infrastructure targeting attacks on loading terminals, naval engagement through direct military confrontation, and regional expansion beyond immediate Hormuz vicinity, potentially lasting 30-90 days requiring comprehensive ceasefire agreements.
International Intervention Probabilities
Global economic stakes create powerful incentives for international intervention. Naval coalition responses include combined maritime forces providing US, UK, and allied naval patrols, convoy protection through escort services, mine clearance operations, and intelligence sharing for regional military monitoring.
Diplomatic resolution mechanisms encompass UN Security Council emergency sessions addressing navigation rights, regional mediation through Gulf Cooperation Council involvement, economic pressure linking sanctions relief to waterway access, and track-two diplomacy supporting official negotiations.
Economic Pressure Points
Financial incentives create powerful motivations for conflict resolution. Iranian economic considerations include export revenue losses of $100-200 million daily from oil sales, enhanced economic isolation, domestic pressure from popular unrest, and potential negotiation forcing within 30-45 days.
Gulf State vulnerabilities encompass production shutdown costs exceeding $1 billion daily regionally, economic diversification impacts on non-oil sectors, investment flight affecting development projects, and strong economic motivations for rapid diplomatic solutions.
What Long-Term Strategic Changes Could Result?
Extended Strait of Hormuz closure impact on oil production would catalyse fundamental restructuring of global energy infrastructure, geopolitical relationships, and investment priorities. These transformative effects could persist long after waterway access restoration.
Energy Infrastructure Diversification
Chokepoint vulnerability exposure would accelerate alternative routing development. Pipeline infrastructure expansion includes Saudi East-West Pipeline capacity increases from 5 to 8-10 million barrels per day, UAE Fujairah system enhancement, Iraq northern route rehabilitation, and new Trans-Arabian alternative projects.
Strategic petroleum reserve enhancement encompasses Asian SPR expansion with China, India, and Japan increasing reserve targets, commercial inventory requirements through mandatory storage increases, regional cooperation via shared strategic reserves, and technology advancement in underground storage systems.
Geopolitical Realignments
Energy security priorities would reshape international relationships. US energy independence advantages include domestic production preference reducing Gulf military commitments, export market opportunities enhancing American crude competitiveness, alliance structure shifts in Middle East arrangements, and reduced vulnerability to regional supply disruptions.
China-Middle East relationship evolution involves supply diversification through Central Asian pipeline projects, strategic partnerships with alternative suppliers, investment reallocation reducing Middle East petroleum investments, and enhanced naval presence supporting alternative supply routes.
Investment Implications and Opportunities
Market disruptions would create lasting changes in capital allocation and sector preferences. Energy infrastructure resilience includes alternative route development, renewable technology acceleration, nuclear power renaissance, and efficiency technology advancement.
Transportation evolution encompasses electric vehicle adoption acceleration, alternative fuel development including hydrogen and biofuels, public transportation investment enhancement, and aviation efficiency prioritising fuel economy over speed.
Strategic commodity positioning includes supply chain resilience through redundancy requirements, inventory management with higher buffer stocks, geographic diversification reducing single-source concentration, and enhanced contract structures with alternative supply agreements.
Long-term market structure changes could include permanent risk premiums for Middle Eastern crude, enhanced price volatility expectations, and structural shifts toward energy independence policies across major economies. These adaptations would create lasting competitive advantages for nations and companies successfully navigating the transition toward more resilient energy systems, ultimately reshaping global energy markets for decades to come.
Want to Position Yourself Ahead of Market-Moving Energy Disruptions?
Discovery Alert's proprietary Discovery IQ model delivers real-time alerts on significant ASX mineral discoveries, including energy and critical mineral opportunities that could benefit from shifting supply dynamics. While global chokepoints create vulnerability for established energy flows, historic discoveries have demonstrated how emerging mineral projects can generate substantial returns during times of market uncertainty.