
June 17, 2026
The escalating tensions in global energy chokepoints reflect deeper structural vulnerabilities that extend far beyond immediate supply disruptions. Modern energy systems operate through interconnected networks where single points of failure can cascade into worldwide economic shocks, revealing the fragility of decades-old infrastructure dependencies. The Strait of Hormuz conflict demonstrates how regional disputes can instantly transform into global crises, affecting oil price movements across international markets.
Understanding Critical Energy Transit Vulnerabilities
Maritime shipping lanes handle approximately 84% of global oil transportation, with specific geographic bottlenecks concentrating enormous volumes through narrow passages. These chokepoints represent more than logistical conveniences; they constitute potential weapons of economic warfare where regional conflicts can instantly transform into global energy crises.
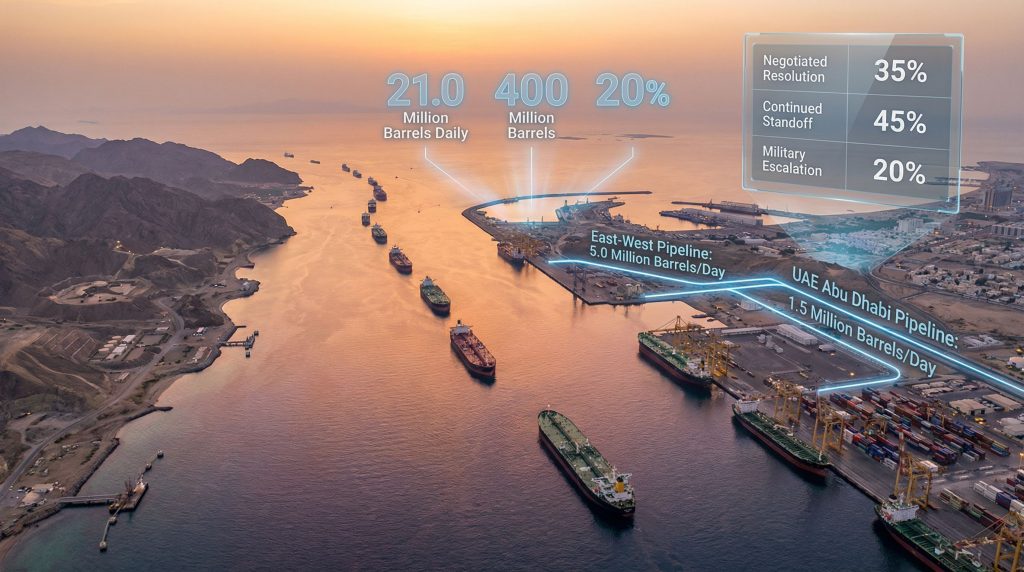
The Persian Gulf region demonstrates this vulnerability most acutely. Through the narrow waters connecting regional producers to international markets, roughly 21 million barrels per day typically flow under normal conditions. This volume represents nearly one-fifth of global crude oil consumption, making any disruption immediately felt across world markets.
Furthermore, the Strait of Hormuz crisis highlights how a single chokepoint can control such a substantial portion of global energy trade. The strategic importance of this waterway cannot be overstated in current geopolitical tensions.
Key Global Energy Chokepoints:
- Strait of Hormuz: 21% of global petroleum liquids transit
- Suez Canal/SUMED Pipeline: 12% of seaborne oil trade
- Strait of Malacca: 25% of all traded goods passage
- Turkish Straits: Major route for Caspian/Central Asian energy
- Panama Canal: Critical for LNG and refined product flows
Physical Infrastructure Constraints During Crisis
Alternative transportation methods face significant capacity limitations that become apparent only during emergency scenarios. Pipeline networks, while offering some redundancy, cannot rapidly scale to accommodate displaced maritime volumes without substantial infrastructure modifications.
Saudi Arabia's East-West Pipeline exemplifies these constraints. With maximum capacity of 5 million barrels per day, this crucial alternative route can theoretically handle approximately 24% of normal Strait of Hormuz throughput. However, technical limitations, storage bottlenecks, and terminal capacity constraints prevent immediate full utilization during crisis periods.
The UAE's Abu Dhabi Crude Oil Pipeline provides additional relief valve capacity of 1.5 million barrels daily, representing roughly 7% of typical Persian Gulf maritime flows. Combined with Saudi infrastructure, these alternatives achieve less than one-third coverage of normal shipping volumes, highlighting the mathematical impossibility of seamless supply chain substitution.
In addition, global oil market trends continue to shift as nations recognise the vulnerability of concentrated transportation routes. This realisation drives infrastructure investment priorities across multiple regions.
When big ASX news breaks, our subscribers know first
Emergency Response Mechanisms and Market Psychology
Strategic Reserve Deployment Dynamics
The International Energy Agency's coordinated emergency response represents the largest strategic petroleum reserve release in history. However, the 400 million barrel deployment reveals both the scale of international cooperation and the limitations of emergency stockpiling strategies.
| Reserve Type | Total Capacity (Million Barrels) | Maximum Daily Release | Duration at Full Rate |
|---|---|---|---|
| US SPR | 180 | 4.4 | 41 days |
| European Stocks | 120 | 2.8 | 43 days |
| Asian Reserves | 100 | 2.2 | 45 days |
| Combined Total | 400 | 9.4 | 43 days |
These figures demonstrate a critical gap between reserve capacity and actual supply disruption. With 20 million barrels per day removed from normal market flows, strategic reserves operating at maximum release rates can theoretically offset less than half the shortfall for approximately six weeks before complete depletion.
Market Intervention Attempts and Effectiveness
Government attempts to influence oil pricing through verbal intervention represent a fascinating study in market psychology versus physical fundamentals. Presidential statements, policy announcements, and strategic communications can create temporary price volatility, but their effectiveness diminishes rapidly when underlying supply constraints persist.
Recent Intervention Examples:
- Presidential statements about conflict resolution: 8-12% temporary price swings
- Navy escort announcements: 19% intraday price movement (later reversed)
- Reserve release coordination: Paradoxical price increases despite announced supply additions
- Futures market intervention threats: Exchange operator resistance and credibility concerns
The phenomenon of "jawboning" markets lower reflects policymaker desperation when physical tools prove insufficient. However, oil futures markets maintain relatively tight connections to physical delivery requirements, limiting the duration and magnitude of purely psychological interventions.
Moreover, the current oil price rally demonstrates how market fundamentals ultimately override political rhetoric when supply constraints persist across extended periods.
Alternative Supply Route Activation
Red Sea Terminal Network:
Major oil exporters have activated alternative export infrastructure, though with significant capacity limitations and operational challenges:
- Yanbu Terminal (Saudi Arabia): 4.5 million barrels per day maximum capacity
- Rabigh Terminal (Saudi Arabia): 400,000 barrels per day additional capacity
- Jeddah Refineries: 2.1 million barrels per day processing/export capability
Mediterranean Routes:
- Sidi Kerir Terminal (Egypt): 1.7 million barrels per day through Sumed Pipeline
- Ceyhan Terminal (Turkey): 1.6 million barrels per day via Iraq pipeline system
- Syrian terminals: Currently offline due to regional instability
These alternatives collectively provide approximately 10.3 million barrels per day of alternative export capacity, representing roughly 49% of normal Persian Gulf maritime exports. However, infrastructure bottlenecks, political constraints, and technical limitations prevent immediate full utilization.
Consequently, experts emphasise that no single alternative route can fully compensate for a complete Strait of Hormuz closure. The maritime security implications extend far beyond energy markets into broader regional stability concerns.
Economic Impact Assessment Across Scenarios
Industrial Demand Management Strategies
Energy-intensive industries face immediate operational challenges that extend beyond simple price increases. Manufacturing processes requiring specific oil product grades cannot quickly substitute alternatives, creating supply chain disruptions that compound beyond energy sectors.
European Industrial Response Measures:
- Reduced working weeks: 32-hour standard across energy-intensive manufacturing
- Production scheduling flexibility: Peak demand shifting to optimise energy procurement
- Strategic stockpiling: 90-day fuel reserves for critical operations
- Alternative fuel research acceleration: Hydrogen and synthetic fuel investment programmes
Asian Market Adaptations:
- China's Sinopec refinery utilisation: Reduced from 85% to 71% of capacity
- Japanese strategic reserve activation: First deployment since 2011 tsunami crisis
- Indian bilateral negotiations: Emergency supply agreements with non-Persian Gulf producers
- South Korean industrial rationing: Priority allocation systems for strategic industries
Financial Market Stress Testing
Banking institutions and investment funds face portfolio stress across multiple asset classes as energy price shocks propagate through economic sectors. Currency markets, particularly for oil-importing nations, experience significant volatility as trade balances shift rapidly.
In this context, market volatility hedging becomes essential for institutional investors managing exposure to energy-sensitive portfolios during extended crisis periods.
Risk Assessment Framework:
| Oil Price Scenario | Global GDP Impact | Inflation Acceleration | Recession Probability |
|---|---|---|---|
| $80-90/barrel | -0.8% to -1.2% | +2.1% to +2.8% | 25% to 35% |
| $100-120/barrel | -1.8% to -2.4% | +3.2% to +4.1% | 55% to 70% |
| $130-150/barrel | -3.1% to -4.2% | +4.8% to +6.3% | 80% to 90% |
| Above $150/barrel | -5.2% to -7.1% | +7.2% to +9.8% | 95%+ |
Currency and Trade Balance Disruptions
Oil-importing nations experience immediate current account deterioration, placing downward pressure on currencies and potentially triggering capital flight from emerging markets. Conversely, alternative oil exporters benefit from windfall revenues that can destabilise regional economic relationships.
Major Currency Impact Patterns:
- US Dollar strength: Flight-to-quality and relative energy independence
- European currencies weakness: High import dependency and industrial exposure
- Japanese Yen volatility: Strategic reserve deployment versus import costs
- Emerging market pressure: Capital outflow acceleration and debt service concerns
Strategic Infrastructure Development Acceleration
Pipeline Expansion and Redundancy Projects
The crisis catalyses previously stalled infrastructure investments as nations recognise the strategic vulnerability of concentrated chokepoint dependencies. Pipeline projects that seemed economically marginal under normal market conditions suddenly achieve strategic priority status.
Priority Infrastructure Investments:
- Trans-Arabia Pipeline upgrades: Capacity expansion from 5.0 to 7.2 million barrels per day
- UAE-Oman pipeline development: New 2.3 million barrel per day cross-border system
- Iraq-Jordan pipeline: Alternative export route bypassing Persian Gulf entirely
- Kazakhstan-China expansion: Central Asian energy independence from Russian routes
Furthermore, the OPEC production impact becomes increasingly significant as member nations evaluate infrastructure resilience alongside production capacity decisions.
Strategic Storage Capacity Enhancement
Nations recognise that existing strategic petroleum reserves, while historically adequate for short-term disruptions, prove insufficient for sustained chokepoint closures lasting multiple months or years.
Storage Expansion Programmes:
| Country/Region | Current Capacity | Planned Expansion | Timeline |
|---|---|---|---|
| United States | 714 million barrels | +200 million barrels | 24-36 months |
| European Union | 420 million barrels | +150 million barrels | 18-30 months |
| China | 500 million barrels | +300 million barrels | 12-24 months |
| Japan | 324 million barrels | +100 million barrels | 18-24 months |
Alternative Energy Technology Acceleration
Long-term strategic planning increasingly emphasises energy system diversification beyond traditional oil dependency. Renewable energy projects, previously justified on environmental grounds, gain national security imperative status.
Technology Investment Priorities:
- Grid-scale battery storage: 48-hour minimum backup capability for critical infrastructure
- Hydrogen production scaling: Synthetic fuel production for transportation sectors
- Advanced nuclear deployment: Baseload power independence from fossil fuel imports
- Carbon capture utilisation: Converting atmospheric CO2 into synthetic hydrocarbons
Geopolitical Realignment and Power Dynamics
Regional Energy Bloc Formation
The crisis accelerates existing trends toward regional energy self-sufficiency and bloc formation. Nations previously comfortable with global energy market integration begin prioritising bilateral relationships and regional partnerships over market-based procurement.
Emerging Energy Partnerships:
- North American Energy Alliance: US-Canada-Mexico integration deepening
- European Energy Union: Accelerated infrastructure and policy coordination
- Asian Energy Security Framework: Japan-South Korea-Australia cooperation expansion
- Middle East Production Coordination: Non-Persian Gulf producer collaboration
What Are the Long-Term Maritime Security Implications?
The vulnerability of global shipping lanes to regional conflicts forces international maritime security arrangements that extend far beyond traditional naval cooperation. Energy security becomes inseparable from military strategic planning.
Security Framework Development:
- International Maritime Energy Protection Treaty: Proposed 31-nation framework
- Chokepoint Monitoring Systems: Real-time shipping traffic and threat assessment
- Naval Escort Coordination: Multinational convoy protection protocols
- Alternative Route Development: Military protection for backup transportation networks
Investment Opportunities and Market Transformation
Infrastructure Resilience Investment Themes
Capital markets rapidly reprice infrastructure assets based on strategic resilience rather than purely economic returns. Projects that enhance energy supply chain redundancy attract premium valuations despite potentially lower traditional metrics.
High-Priority Investment Sectors:
- Pipeline construction and expansion: Cross-border energy transportation networks
- Strategic storage development: Commercial and government reserve facilities
- Alternative fuel production: Synthetic and bio-based transportation fuel facilities
- Grid modernisation: Smart grid technology enabling rapid supply source switching
Technology Solution Investment Acceleration
Venture capital and private equity rapidly redirect toward technologies that address energy supply chain vulnerabilities. Innovation cycles compress as national security requirements override normal market development timelines.
Technology Investment Focus Areas:
- Floating production systems: Mobile oil processing and storage platforms
- Advanced materials: Pipelines resistant to sabotage and extreme weather
- Energy storage solutions: Large-scale systems for strategic reserve management
- Alternative fuel technologies: Hydrogen, synthetic fuels, and advanced bioenergy
Risk Management and Hedging Strategies
Corporate risk management frameworks require fundamental revision as traditional hedging strategies prove inadequate for sustained supply disruptions. Companies develop multi-layered protection strategies combining physical reserves, financial instruments, and operational flexibility.
Corporate Adaptation Strategies:
- Supply chain diversification: Multiple supplier relationships across regions
- Inventory level increases: Strategic stockpiling for 90-180 day operations
- Production flexibility: Rapid switching between energy sources and raw materials
- Geographic distribution: Manufacturing capacity spread across energy-secure regions
The next major ASX story will hit our subscribers first
Probabilistic Scenario Analysis and Planning
Conflict Duration Assessment
Strategic planners model multiple timeline scenarios recognising that energy market fundamentals remain disrupted until sustainable political resolution or alternative supply chain activation reaches sufficient scale.
Timeline Scenario Probabilities:
| Resolution Timeframe | Probability | Price Impact Range | Economic Consequences |
|---|---|---|---|
| 3-6 months | 40% | $85-110/barrel | Regional recession, managed recovery |
| 6-12 months | 35% | $100-140/barrel | Global recession, structural changes |
| 12-24 months | 20% | $120-180/barrel | Economic depression, system transformation |
| 24+ months | 5% | $150-250/barrel | Civilisation-level energy transition |
Alternative Outcome Modelling
Beyond conflict resolution, multiple technological, political, and economic variables influence long-term energy system evolution. Strategic planning requires consideration of interconnected scenario pathways rather than linear projection approaches.
Key Uncertainty Variables:
- Military escalation patterns: Regional conflict expansion versus containment
- Alternative supply development speed: Infrastructure construction timelines and bottlenecks
- Technology breakthrough potential: Revolutionary energy production or storage advances
- International cooperation effectiveness: Multilateral versus unilateral response strategies
- Economic adaptation capacity: Industrial flexibility and consumer behaviour modification
The Strait of Hormuz conflict represents more than a temporary supply disruption; it constitutes a fundamental stress test of global energy architecture built on assumptions of stable chokepoint access and market-based resource allocation. Strategic adaptation requires recognition that energy security and economic security are inseparable, demanding infrastructure resilience investments that prioritise redundancy and flexibility over pure economic efficiency.
This analysis incorporates multiple scenario modelling frameworks and does not constitute investment advice. Energy market forecasting involves substantial uncertainty, particularly during geopolitical crisis periods. Readers should consult qualified advisors for specific strategic planning decisions.
Want to Position Yourself in Energy Market Disruptions?
Discovery Alert's proprietary Discovery IQ model delivers real-time alerts on significant ASX mineral discoveries, instantly empowering subscribers to identify actionable opportunities ahead of the broader market during volatile periods like the current energy crisis. Understand why major mineral discoveries can generate substantial returns by exploring historic examples whilst beginning your 14-day free trial today to secure your market-leading advantage.