
July 22, 2026
What Makes the Strait of Hormuz Critical to Global Energy Security?
Strategic chokepoints represent the invisible arteries of global commerce, where geography dictates the flow of energy that powers entire civilizations. The current Iran-US conflict impact on oil supply demonstrates how a single maritime corridor can hold the world economy hostage when geopolitical tensions escalate beyond diplomatic resolution.
Geographic Chokepoint Analysis
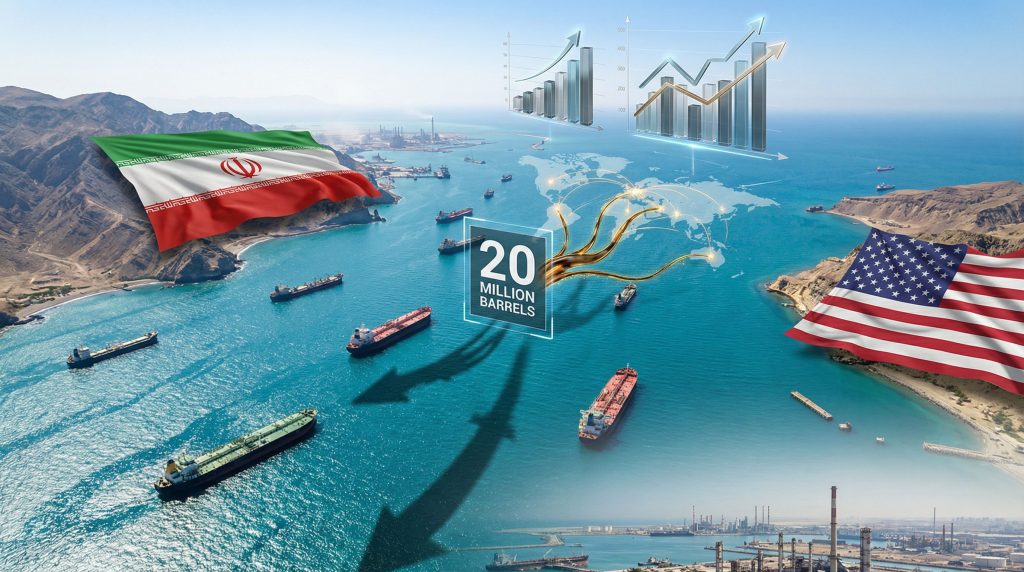
The Strait of Hormuz functions as an irreplaceable bottleneck where approximately 21 million barrels per day of crude oil and condensates traverse through waters barely 21 miles wide at their narrowest point. This volume represents roughly 20-21% of global petroleum trade, according to International Energy Agency data, making it the world's most critical energy transit route.
Recent vessel tracking analysis reveals the devastating impact of military conflict on maritime operations. As of late February 2026, approximately 170 ships remain trapped in the region, while Iranian-flagged vessel movements have declined by over 95% during active hostilities. The speed of this collapse demonstrates how quickly decades of established shipping patterns can disintegrate under warfare conditions.
Alternative routing options expose the geographic reality that no substitute pathway exists with comparable capacity. Ships attempting to bypass the Strait face three primary alternatives:
- Cape of Good Hope routing adds 2-3 weeks transit time and $0.50-1.50 per barrel in additional shipping costs during peacetime
- Suez Canal transit remains limited by Egyptian infrastructure capacity and faces its own geopolitical vulnerabilities
- Trans-shipment operations through regional hubs multiply handling costs and introduce additional supply chain complexity
- Pipeline alternatives lack sufficient capacity to replace seaborne volumes
Regional Production Dependencies
The concentration of global energy exports within the Persian Gulf creates a structural vulnerability that extends far beyond simple supply statistics. Middle Eastern nations account for 40% of global oil shipments, with the top five exporters Saudi Arabia, Russia, the United States, UAE, and Canada now controlling more than half of the world's traded crude oil.
Liquefied natural gas flows present an additional layer of dependency, with 18% of global LNG shipments disrupted by Strait closure. Qatar alone represents approximately 20% of global LNG exports, making the Persian Gulf a dual chokepoint for both crude oil and natural gas supplies that heat homes and power electricity generation across Asia and Europe.
The strategic petroleum reserve implications vary dramatically across importing nations, creating an uneven distribution of energy security buffers. Japan maintains approximately 145 days of consumption coverage through strategic reserves, while other major importers operate with significantly shorter duration protection against supply interruptions.
When big ASX news breaks, our subscribers know first
How Do Military Conflicts Immediately Impact Oil Supply Chains?
Modern energy supply chains operate on precision timing and predictable logistics networks that collapse rapidly when military operations commence. The Iran-US conflict impact on oil supply illustrates how decades of established commercial relationships can evaporate within 48-hour periods once shooting starts.
Supply Shock Mechanics
The current conflict demonstrates a clear three-phase supply disruption pattern that unfolds with mechanical precision. Furthermore, these oil price movements reveal how markets react to changing geopolitical landscapes:
Phase 1: Initial Market Chaos (Hours 0-12)
- Futures markets experience extreme volatility as traders assess military escalation
- Shipping companies implement immediate emergency protocols
- Insurance markets begin repricing war risk premiums for Gulf transits
Phase 2: Capacity Loss Realisation (Hours 12-48)
- Market reopening reveals the full scope of infrastructure damage and leadership casualties
- Rystad Energy estimates indicate potential net loss of 8-10 million barrels per day if Strait closure persists
- Major energy companies activate emergency supply chain contingency plans
Phase 3: Rerouting Implementation (Days 2-7)
- Shipping lines initiate emergency rerouting protocols around Africa
- War risk insurance premiums surge 300-500% above baseline rates
- Alternative supply sources begin ramping production to offset Gulf losses
Historical precedent analysis from the Gulf War (1990-1991) and Iran-Iraq War (1980-1988) reveals that initial supply shock effects typically exceed long-term disruption impacts as markets adjust to new routing patterns and alternative suppliers increase output.
Infrastructure Vulnerability Assessment
The targeting of critical energy infrastructure across Iran, Saudi Arabia, and Qatar creates cascading effects that extend far beyond immediate production losses. Nuclear facility strikes add radiological release risks that could necessitate evacuations across vast areas of Iran, according to International Atomic Energy Agency Director General Rafael Grossi.
Repair timeline estimates for damaged oil infrastructure vary significantly based on facility type and extent of destruction:
- Export terminals: 6-18 months for major structural damage
- Refinery complexes: 12-24 months for process unit reconstruction
- Pipeline networks: 3-8 months depending on geographic accessibility
- Offshore platforms: 18-36 months for complete facility replacement
Secondary impacts ripple through refined product markets as gasoline, diesel, and jet fuel supplies face independent disruption patterns. Petrochemical feedstock availability becomes constrained, affecting plastic and chemical production facilities across global manufacturing networks.
Which Countries Face the Greatest Energy Security Risks?
Import dependency creates asymmetric vulnerability patterns across the global economy, where geographic location and strategic reserve policies determine national resilience during supply crises. The Iran-US conflict impact on oil supply exposes these structural weaknesses with brutal clarity.
Import Dependency Risk Matrix
Asian economies demonstrate the highest concentration of Gulf dependency, creating a regional vulnerability cluster that encompasses the world's largest manufacturing economies:
| Country | Daily Gulf Imports | % of Total Consumption | Strategic Reserve Duration |
|---|---|---|---|
| China | 6.0M barrels | 45% | 90 days |
| India | 3.2M barrels | 52% | 74 days |
| Japan | 2.1M barrels | 67% | 145 days |
| South Korea | 1.8M barrels | 71% | 96 days |
Japan's strategic reserve duration provides the strongest buffer among major Asian importers, reflecting post-Fukushima energy security policy prioritisation. South Korea faces the highest percentage dependency despite maintaining substantial reserve coverage, while China's massive absolute import volume creates global market influence even at moderate dependency percentages.
Economic Vulnerability Scenarios
GDP impact modelling reveals that sustained oil prices above $100 per barrel trigger non-linear economic effects across import-dependent economies. Manufacturing sectors face dual pressures from higher input costs and reduced consumer spending as energy expenses consume larger portions of household budgets.
Industrial sector exposure analysis identifies particularly vulnerable segments:
- Petrochemical manufacturing: Direct feedstock cost increases of 40-60%
- Transportation logistics: Fuel cost surge affects distribution networks
- Aviation industry: Jet fuel price spikes reduce passenger demand and cargo volumes
- Steel production: Energy-intensive processes face margin compression
Consumer inflation transmission mechanisms operate through multiple channels, with transportation fuel costs feeding directly into food distribution expenses and heating oil prices affecting household energy bills during winter months.
What Are the Price Impact Scenarios for Extended Conflict?
Energy price volatility during geopolitical crises follows predictable patterns based on conflict duration, infrastructure damage severity, and alternative supply availability. Current analyst warnings suggest oil prices could reach $100 per barrel if Strait of Hormuz closure persists beyond initial military operations.
Short-Term Price Volatility Patterns
Historical conflict premium analysis from major Middle East crises reveals consistent price surge characteristics during the initial crisis phase. In addition, comprehensive oil market crash analysis from previous conflicts helps predict current market behaviour:
- 1973 Arab-Israeli War: Oil prices quadrupled within six months
- 1979 Iranian Revolution: Prices doubled during 12-month period
- 1990 Gulf War: 100% price increase during six-month conflict period
- 2003 Iraq Invasion: 40% premium during three-month military operation phase
Options market volatility indicators during the current crisis show extreme backwardation in futures curves as traders price immediate supply scarcity against uncertain conflict duration. Speculative trading volumes have surged 300-400% above normal levels as financial markets attempt to hedge against tail-risk scenarios.
UK wholesale gas prices demonstrate additional energy market stress, surging approximately 90% during the week preceding March 6, 2026, as European suppliers scramble to secure alternative LNG sources from non-Gulf exporters.
Long-Term Economic Modelling
Extended conflict duration creates exponential rather than linear economic damage as strategic reserves deplete and alternative supply sources reach maximum sustainable output levels. However, understanding oil price stagnation factors provides insight into potential stabilisation scenarios:
| Conflict Duration | Price Range | Global GDP Impact | Recession Probability |
|---|---|---|---|
| 2-4 weeks | $85-100/barrel | -0.3% to -0.5% | 15-25% |
| 1-3 months | $100-130/barrel | -0.8% to -1.2% | 40-60% |
| 6+ months | $130-180/barrel | -1.5% to -2.5% | 75-85% |
These projections assume normal weather patterns and no additional supply disruptions in non-Gulf producing regions. Simultaneous crises in multiple oil-producing areas could amplify price effects beyond historical precedent, particularly if North American shale production faces environmental or regulatory constraints during emergency response periods.
How Can Countries Mitigate Oil Supply Disruption Risks?
Strategic petroleum reserve utilisation represents the primary short-term defence mechanism against supply shock effects, though coordination challenges and political considerations often complicate emergency release decisions. The International Energy Agency emergency response system provides frameworks for collective action during major disruptions.
Strategic Reserve Utilisation
IEA coordinated release mechanisms have demonstrated mixed effectiveness during historical crises, with political coordination challenges often delaying optimal response timing. The United States Strategic Petroleum Reserve maintains approximately 714 million barrels of capacity, though actual inventory levels fluctuate based on policy directives and previous emergency releases.
National stockpile duration analysis reveals significant variation in preparation levels across major importing economies:
- Japan: 155+ days of consumption coverage through government and industry reserves
- Germany: 90+ days through joint government-industry stockpiling programmes
- United States: 60-90 days depending on current SPR inventory levels
- China: 60-90 days based on estimated strategic reserve construction progress
Emergency sharing agreements between allied nations provide additional flexibility, though legal frameworks and logistics coordination require advance preparation that may not exist between all potential partners.
Alternative Supply Source Development
Non-Gulf production capacity expansion potential varies dramatically across different producing regions based on existing infrastructure, reservoir characteristics, and regulatory environments. North American shale oil rapid deployment capabilities offer the most responsive alternative supply during crisis periods.
United States oil production surpassed 20 million barrels per day for the first time in 2024, providing substantial domestic supply security and export potential to allied nations during Gulf supply disruptions. This volume roughly equals the combined production of Saudi Arabia and Russia, demonstrating the strategic significance of North American energy independence.
Emergency production agreements with non-OPEC producers could potentially offset 60-70% of Gulf supply losses within 90-day timeframes. Furthermore, US oil production decline patterns suggest sustained maximum production rates may face technical and environmental limitations during extended crisis periods.
What Role Does Energy Transition Play in Geopolitical Risk Management?
Renewable energy deployment creates structural changes in national energy security calculations by reducing import dependencies and creating domestic production alternatives immune to foreign supply disruptions. The Iran-US conflict impact on oil supply accelerates policy discussions around energy transition timeline acceleration.
Renewable Energy as Strategic Security
Domestic energy production through wind, solar, and hydroelectric sources eliminates transportation vulnerabilities that affect imported fossil fuels. Countries with substantial renewable electricity generation capacity can implement demand response programmes during oil supply crises, shifting energy consumption patterns away from petroleum products toward domestically controlled electricity supplies.
Electric vehicle adoption projections suggest potential demand destruction for petroleum products during the 2025-2035 timeframe, though current EV market penetration remains insufficient to significantly reduce oil demand during acute supply crises. Battery manufacturing dependencies on lithium and critical minerals create alternative supply chain vulnerabilities that require parallel risk management strategies.
Grid resilience during supply shock scenarios depends on electricity generation fuel mix diversity and energy storage capacity. Nations with substantial natural gas power generation face continued import vulnerabilities, while countries operating nuclear or renewable-heavy electrical grids maintain greater supply security during international crises.
Critical Mineral Dependencies
Energy transition technologies create new supply chain vulnerabilities centred on lithium, cobalt, rare earth elements, and other critical minerals essential for battery production, wind turbine manufacturing, and solar panel assembly. Geographic concentration risks in these materials may replicate or exceed current oil import dependencies.
China controls approximately 60-70% of rare earth processing capacity, creating potential supply leverage similar to Middle Eastern oil dominance during previous decades. Lithium extraction concentrates in South America (Chile, Argentina) and Australia, while cobalt production centres in the Democratic Republic of Congo with significant Chinese processing control.
Strategic stockpiling requirements for energy transition metals remain underdeveloped compared to petroleum reserve programmes, creating potential bottlenecks during rapid renewable energy deployment scenarios driven by energy security concerns rather than climate policy priorities.
The next major ASX story will hit our subscribers first
How Do Financial Markets React to Middle East Energy Crises?
Energy sector equity performance during Middle East conflicts follows predictable patterns as investors anticipate profit margin expansion from higher commodity prices and increased strategic importance of non-Gulf production assets. Traditional energy companies typically outperform broader market indices during supply crisis periods.
Sector Performance Analysis
Energy stock premiums during conflict periods reflect both immediate cash flow benefits from higher commodity prices and long-term strategic value recognition for companies with production assets outside geopolitically volatile regions. Integrated oil companies with downstream refining operations face mixed impacts as crude costs increase while refined product margins potentially expand.
Transportation sector vulnerability patterns create immediate headwinds for airlines, shipping companies, and logistics providers facing fuel cost increases that cannot be immediately passed through to customers via pricing mechanisms. Aviation industry exposure proves particularly acute due to jet fuel price sensitivity and limited short-term demand elasticity.
Currency impacts on oil-importing versus oil-exporting nations create additional investment flow effects. Import-dependent economies face current account deterioration and currency weakness, while oil-exporting nations experience currency strength and fiscal account improvements during sustained high price periods.
Investment Flow Redirection
Capital flight from emerging market economies typically accelerates during energy supply crises as investors prioritise developed market assets with better energy security profiles. Portfolio managers implement defensive positioning strategies emphasising domestic energy production companies and industries with lower oil price sensitivity.
Safe haven asset performance during Middle East energy crises favours gold, US Treasury bonds, and currencies of energy-independent developed nations. Infrastructure investment delays affect energy-intensive industries as companies postpone expansion projects during periods of input cost uncertainty.
Private equity and venture capital flows often increase toward renewable energy and energy efficiency technologies as investors anticipate policy responses aimed at reducing import dependencies during the post-crisis period.
What Are the Long-Term Implications for Global Energy Architecture?
Supply chain redesign imperatives emerging from current Middle East instability will reshape global energy trade patterns for decades as importing nations prioritise supply security over cost optimisation. The Iran-US conflict impact on oil supply serves as a catalyst for structural changes already developing through climate policies and technological advancement.
Supply Chain Redesign Imperatives
Diversification strategies beyond Middle Eastern sources require substantial infrastructure investments in alternative supply regions and transportation networks. North American energy exports need pipeline and LNG terminal capacity expansion to serve Asian markets currently dependent on Gulf suppliers.
African oil and gas development presents opportunities for European supply diversification, though political stability concerns and infrastructure development requirements create long-term investment challenges. Norwegian offshore production offers established supply security for European markets despite higher extraction costs compared to Middle Eastern sources.
Maritime route security investment requirements will increase substantially as shipping companies and importing nations recognise the vulnerability of traditional chokepoint dependencies. Naval protection costs and alternative routing infrastructure represent new structural expenses for global energy trade.
Policy Response Evolution
Emergency legislation frameworks for energy security are likely to expand government authority over private sector energy infrastructure during crisis periods. Strategic alliance restructuring around energy independence creates new bilateral and multilateral agreements prioritising supply security relationships over purely commercial considerations.
International cooperation mechanisms during crises require strengthening beyond current IEA emergency response protocols to address LNG markets, refined product supplies, and critical mineral shortages that affect energy transition technologies. Regional energy sharing agreements may develop to complement existing global frameworks.
National energy independence policies will likely accelerate across import-dependent economies as the geopolitical risks of foreign supply dependencies become politically unsustainable for elected governments facing voter concerns about energy costs and supply reliability. Moreover, OPEC production impact decisions will continue influencing these strategic calculations.
Frequently Asked Questions About Iran-US Oil Supply Impact
How quickly do oil prices respond to Middle East conflicts?
Oil prices typically react within hours of military action initiation, with futures markets often moving 10-20% during overnight trading sessions before physical supply impacts become apparent. The current Iran-US conflict demonstrates this pattern, with price volatility beginning immediately upon news of February 28 airstrikes.
Can strategic petroleum reserves prevent supply shortages?
Strategic reserves provide temporary buffer capacity lasting 60-145 days depending on national stockpile levels, but cannot replace sustained supply losses exceeding 8-10 million barrels per day without coordinated international releases and alternative supply source activation.
Which alternative shipping routes exist if Hormuz closes?
Primary alternatives include Cape of Good Hope routing (adding 2-3 weeks transit time), limited pipeline capacity through Turkey and Eastern Mediterranean routes, and potential Arctic shipping during ice-free seasons. However, none provide comparable capacity to Strait of Hormuz transit volumes.
How long do typical Middle East conflicts affect oil markets?
Historical analysis suggests initial price premiums persist for 3-18 months depending on conflict resolution speed and infrastructure damage severity. Market normalisation typically requires 6-24 months for complete supply chain recovery and alternative source development, according to Goldman Sachs analysis.
This analysis is based on publicly available information and should not be considered as investment advice. Energy market conditions and geopolitical situations can change rapidly, affecting the accuracy of projections and scenario modelling. Readers should consult qualified professionals for investment decisions and emergency planning purposes.
Looking to Navigate Energy Market Volatility?
Discovery Alert's proprietary Discovery IQ model delivers real-time alerts on significant ASX mineral discoveries, including critical metals essential for energy transition technologies that could benefit from current supply chain disruptions. With geopolitical tensions reshaping global energy architecture, subscribers gain immediate insights into actionable investment opportunities ahead of broader market recognition of strategic resource value shifts.