
June 24, 2026
Global energy chokepoints represent critical vulnerabilities in the world's economic architecture, where single geographic passages control disproportionate shares of trade flows. Among these strategic waterways, few locations concentrate as much systemic risk as narrow maritime corridors that handle multiple energy value chains simultaneously. When disruptions in Strait of Hormuz operations occur, they trigger complex transmission mechanisms that extend far beyond simple commodity price adjustments, creating profound structural adjustments across interconnected economic systems.
Understanding the Hormuz Economic Multiplier Effect
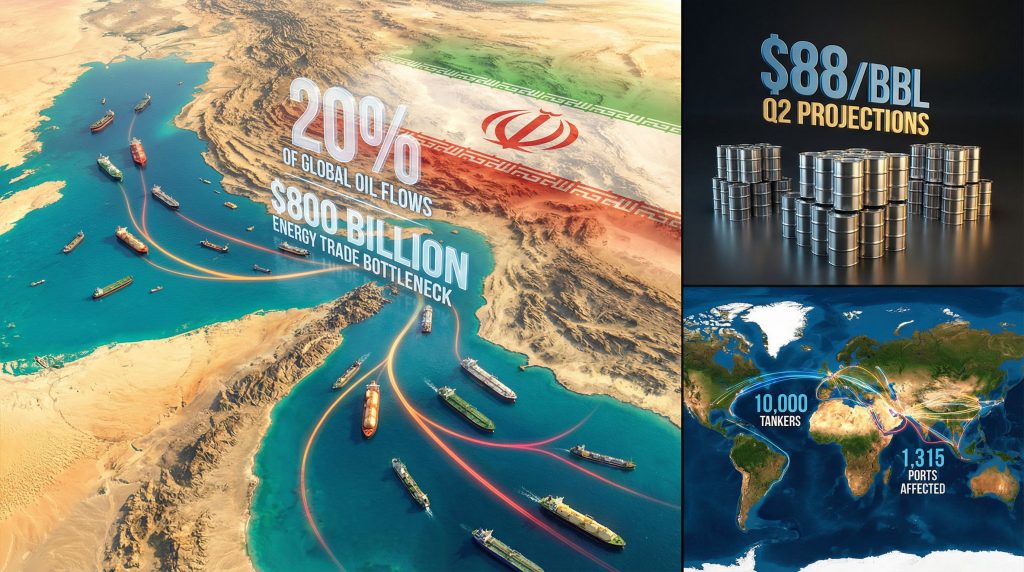
The Strait of Hormuz functions as the world's most critical energy chokepoint, handling approximately 20% of global crude oil flows and representing an estimated $800 billion annual energy trade bottleneck. This narrow 21-mile-wide passage between Iran and Oman creates a fundamental asymmetry in global energy security, where localised disruptions generate disproportionate worldwide impacts through cascading transmission mechanisms.
Economic analysis reveals that disruptions in Strait of Hormuz operations create multiplier effects that exceed typical supply-demand imbalances. Unlike conventional production shortfalls that markets can absorb through strategic reserves or alternative sourcing, chokepoint closures simultaneously constrain multiple energy value chains while limiting geographic substitution options. This simultaneity transforms routine supply adjustments into systemic economic pressure.
The distinction between temporary price spikes and structural inflation becomes critical during extended chokepoint disruptions. Furthermore, market analysts identify 4-8 weeks as the threshold duration where price volatility transitions from transient adjustment to embedded structural inflation. During this timeframe, elevated energy costs begin incorporating into wage negotiations, long-term supply contracts, and investment planning decisions across multiple economic sectors.
Quantifying Transmission Mechanisms
Energy economists distinguish three primary transmission pathways through which Hormuz disruptions cascade into broader economic systems:
• Direct price transmission through crude oil, refined products, and LNG spot markets
• Logistics cost transmission via shipping insurance, routing delays, and port congestion
• Structural adjustment transmission affecting long-term investment and consumption patterns
Current market projections suggest that total Hormuz closure would elevate Brent crude prices to $88 per barrel in Q2 2026, representing approximately $20 above baseline expectations. However, this headline figure understates the complexity of downstream impacts, as refined product shortages and LNG supply constraints create additional inflationary pressure independent of crude price movements.
When big ASX news breaks, our subscribers know first
Contemporary Disruption Characteristics vs Historical Precedents
Modern disruptions in Strait of Hormuz operations demonstrate fundamentally different characteristics compared to historical incidents from 1990-2025. Contemporary disruption mechanisms operate through electronic warfare and GPS jamming technologies that create operational uncertainty without requiring physical blockade infrastructure. Consequently, this technological evolution transforms traditional risk assessment models and insurance pricing mechanisms.
Historical Hormuz incidents typically involved either complete closure threats or selective targeting of specific vessel types. The 1990 Gulf War period demonstrated how total closure attempts generate immediate price responses but also accelerate market adaptation through alternative routing and strategic reserve deployment. However, 2026 disruption scenarios incorporate multidimensional interference affecting crude exports, refined product flows, and LNG infrastructure simultaneously.
Electronic Warfare Impact Assessment
GPS jamming creates three distinct market impacts that compound traditional disruption effects:
- Insurance premium escalation as risk assessment becomes mathematically uncertain
- Transit speed reduction as vessels navigate cautiously without reliable positioning systems
- Route diversification pressure increasing demand for alternative shipping corridors
War risk insurance premiums have escalated from baseline levels of 0.1-0.2% of cargo value during normal operations to potentially 0.5-1.0% during acute disruption periods. This premium expansion directly translates to consumer energy costs, as shipping companies incorporate insurance costs into freight rates and ultimately retail pricing.
Navigation system interference reduces effective chokepoint throughput even without complete closure. Vessels operating with compromised GPS systems reduce transit speeds by 15-25% to maintain safe navigation margins, effectively reducing daily throughput capacity proportional to speed reduction percentages.
Primary Market Disruption Analysis
Energy markets respond to Hormuz disruptions through interconnected price discovery mechanisms that operate across crude oil, refined products, and liquefied natural gas segments simultaneously. Each market segment demonstrates distinct supply elasticity characteristics and geographic substitution constraints that influence price transmission speed and magnitude.
Crude Oil Price Trajectory Modelling
Economic forecasting models project the following Brent crude price evolution during extended Hormuz disruptions:
| Timeline | Price Projection | Market Condition |
|---|---|---|
| Q2 2026 | $88/bbl | Acute supply constraint |
| Q3 2026 | $75/bbl | Partial market adaptation |
| Q4 2026 | $72/bbl | Strategic reserve deployment |
This projected decline assumes gradual restoration of transit capacity or successful market equilibration through demand destruction and alternative supply activation. The $20 premium embedded in Q2 pricing reflects market assessment of both immediate shortage severity and expected persistence duration.
Baseline crude pricing before disruptions appears to have operated near $68 per barrel, suggesting that market participants anticipated relatively stable supply-demand fundamentals absent geopolitical interference. This baseline provides the reference point for measuring disruption-specific price impacts versus underlying market trends, particularly when considering WTI and Brent futures market dynamics.
LNG Market Volatility Amplification
Liquefied natural gas markets demonstrate more acute vulnerability to Hormuz disruptions than crude oil markets due to infrastructure constraints and limited routing alternatives. Asian economies, particularly Japan and South Korea, typically source 35-40% of LNG imports from Persian Gulf suppliers, creating concentrated exposure to supply interruptions.
LNG market structure divides between long-term contracts (70-75% of global trade) with pricing formulas partially indexed to crude oil and spot market transactions (25-30% of volume) that exhibit extreme price volatility during supply disruptions. For instance, spot LNG prices can spike 200-400% during acute shortages, while contract prices increase more gradually through formula escalation mechanisms.
The asymmetric impact on Asian manufacturing becomes particularly pronounced because LNG-dependent industrial facilities cannot rapidly substitute alternative fuels without substantial capital investment. Power generation facilities designed for natural gas combustion require 6-12 months minimum for conversion to alternative fuel sources, creating inelastic demand during disruption periods. These dynamics contrast sharply with natural gas trends observed during normal market conditions.
Refined Product Shortage Sequencing
Petroleum product shortages develop according to predictable patterns based on storage capacity, demand elasticity, and geographic distribution networks. Transportation fuels face immediate shortages within 2-3 weeks of disruption onset, while heating oil and industrial products demonstrate 4-6 week adjustment periods.
Refinery configuration differences create regional vulnerability variations. Refineries configured for heavy crude processing face larger disruptions than facilities designed for lighter crude specifications. U.S. Gulf Coast refineries typically process heavier crude grades from Iraq and Iran, while Northern European facilities handle lighter North Sea and West African crude, creating different exposure profiles across geographic regions.
Secondary Economic Cascade Mechanisms
Beyond direct energy price impacts, Hormuz disruptions trigger secondary transmission mechanisms through global shipping networks, port infrastructure, and supply chain logistics systems. These cascading effects often generate more persistent economic impacts than initial price spikes, as logistics disruptions require months or years for complete resolution.
Global Shipping Network Stress
Maritime transportation networks face systemic stress when major chokepoints experience extended closure periods. The global petroleum tanker fleet comprises approximately 5,000-6,000 crude oil tankers plus equivalent numbers of product tankers and specialised LNG carriers. Total petroleum-related vessel operations potentially affect 10,000+ tankers serving 1,315+ ports worldwide.
Shipping route diversification creates compound delays through several mechanisms:
• Port scheduling disruptions as vessels arrive outside planned timeframes
• Cargo handling bottlenecks when multiple diverted ships arrive simultaneously
• Storage capacity constraints at alternative discharge terminals
• Crew scheduling complications extending voyage durations beyond contracted periods
War risk insurance markets demonstrate extreme sensitivity to geopolitical uncertainty, with premium calculations incorporating both probability assessments and loss magnitude estimates. When GPS jamming prevents accurate risk quantification, insurance providers apply larger risk premiums to compensate for unquantifiable uncertainty, effectively raising transportation costs proportional to insurance provider risk aversion levels.
Port Infrastructure Congestion Modelling
Alternative routing concentrates additional cargo volume through substitute ports that may lack capacity for sustained throughput increases. The Suez Canal represents the primary alternative for southbound Persian Gulf shipments, but canal authority data indicates daily transit capacity of 50-60 vessels under optimal conditions, suggesting limited additional capacity for rerouted Hormuz traffic.
Port congestion creates exponential rather than linear delay patterns. When port utilisation exceeds 85-90% of design capacity, average vessel waiting times increase exponentially, transforming 2-3 day normal turnaround periods into 10-14 day delays during peak congestion. These delays compound throughout the shipping network, as delayed vessels miss subsequent scheduled port calls.
Terminal storage capacity limitations exacerbate port congestion effects. However, petroleum storage terminals typically maintain 15-30 day inventory under normal operations, but cannot accept additional cargo deliveries when storage approaches maximum capacity, forcing vessels to wait offshore until storage space becomes available through product distribution.
Tertiary Macroeconomic Transmission Effects
Extended energy supply disruptions generate tertiary economic impacts through inflation expectations, monetary policy constraints, and structural adjustment processes across multiple economic sectors. These effects operate over 6-24 month timeframes and often persist beyond the resolution of initial supply disruptions.
Inflation Acceleration Dynamics
Macroeconomic forecasting models project Personal Consumption Expenditure (PCE) inflation acceleration to 2.9% year-over-year by Q4 2026, representing significant upward revision from pre-disruption baseline expectations. This inflation acceleration reflects both direct energy cost transmission and secondary effects through transportation, manufacturing, and service sector cost structures.
Energy cost increases transmit through the economy via multiple pathways:
• Direct consumption through gasoline, heating oil, and electricity price increases
• Transportation costs affecting goods distribution and logistics pricing
• Manufacturing input costs impacting industrial production and product pricing
• Service sector costs through commercial energy consumption and transportation expense
Inflation expectations become self-reinforcing when consumers and businesses anticipate persistent price increases. This expectation formation process transforms temporary supply shocks into embedded structural inflation that requires monetary policy intervention for resolution.
GDP Growth Downgrades and Recession Probability
Economic growth projections face substantial downward revision, with 2026 GDP growth estimates declining to approximately 2.0% from pre-disruption baselines near 2.5-3.0%. This growth deceleration reflects both demand destruction from elevated energy costs and supply chain disruption effects reducing productive capacity utilisation.
Recession probability assessments indicate 40% likelihood of technical recession during 2026, with probability increasing substantially if oil prices sustain above $100 per barrel for extended periods. These concerns align with broader global recession risks that economists have identified across multiple indicators.
Regional economic asymmetries become pronounced during extended energy disruptions. Asian economies face acute vulnerability due to heavy dependence on Persian Gulf energy imports and limited alternative sourcing options. European markets demonstrate moderate resilience through diversified supply portfolios but remain exposed through industrial energy costs. North American economies maintain relative insulation through domestic shale production capacity and strategic reserve deployment capabilities.
Investment and Capital Market Implications
Energy market disruptions create significant asset revaluation dynamics across multiple investment sectors, with effects extending beyond traditional energy investments into transportation, manufacturing, and consumer discretionary sectors. These revaluation processes reflect both immediate cash flow impacts and longer-term structural adjustment expectations.
Energy Sector Asset Repricing
Upstream energy assets outside Persian Gulf regions experience substantial value appreciation as investors recognise scarcity premiums and reduced geopolitical risk profiles. North American shale producers, North Sea operators, and West African oil companies benefit from sustained price premiums that improve project economics and expansion potential.
Refining sector margins demonstrate extreme volatility during supply disruptions, with geographic location determining impact direction. Refineries with access to non-Hormuz crude supplies can maintain operations while product prices increase, generating exceptional crack spread margins that may exceed $30-40 per barrel during acute shortage periods.
LNG infrastructure investments accelerate as consumers recognise supply security value. Furthermore, regasification terminals, LNG shipping capacity, and pipeline interconnection projects receive increased capital allocation as governments and corporations prioritise energy security over cost optimisation.
Currency and Commodity Correlation Effects
Energy disruptions create complex currency impacts through petrodollar recycling pattern changes and safe-haven capital flows. Traditional oil-exporting currencies benefit from elevated energy prices, while energy-importing economy currencies face pressure from deteriorating trade balances and inflation concerns.
Commodity market correlations strengthen during energy crises, as investors recognise interconnected supply chain dependencies and inflation transmission mechanisms. Industrial metals, agricultural products, and transportation-dependent commodities often appreciate alongside energy prices due to shared input cost exposure and logistics constraints.
U.S. dollar dynamics become particularly complex, as the currency's dual role as global reserve currency and domestic economic indicator creates conflicting pressures. Energy-driven inflation may weaken dollar purchasing power domestically while strengthening international demand for dollar-denominated energy transactions and safe-haven assets.
These market dynamics interconnect with broader geopolitical tensions, including trade war global impacts that compound the effects of energy market disruptions.
The next major ASX story will hit our subscribers first
Policy Response Framework and Economic Stabilisation
Government and central bank responses to energy supply disruptions operate through multiple policy channels, each presenting distinct effectiveness profiles and unintended consequence risks. Policy coordination becomes critical when energy disruptions coincide with broader geopolitical instability and financial market stress.
Strategic Reserve Deployment Effectiveness
Strategic Petroleum Reserve (SPR) releases provide temporary supply supplementation but demonstrate limited effectiveness during extended disruptions. U.S. SPR capacity of approximately 700 million barrels could theoretically offset complete Hormuz closure for 35-40 days at current consumption levels, but practical deployment rates limit daily release capacity to 4-6 million barrels.
International coordination enhances reserve effectiveness through synchronised release timing and market signalling effects. International Energy Agency (IEA) emergency response protocols coordinate member country releases totaling approximately 1.5 billion barrels globally, but deployment requires consensus decision-making that may introduce delays during acute crises.
Reserve deployment effectiveness depends critically on refinery capacity and product distribution infrastructure. Raw crude releases provide minimal immediate relief if refining capacity cannot process additional throughput or if product distribution networks lack capacity for increased flows.
Monetary Policy Constraint Analysis
Central banks face complex trade-offs when energy-driven inflation coincides with economic growth deceleration. Traditional monetary policy responses to inflation through interest rate increases may exacerbate economic slowdown without addressing underlying supply constraints that drive price increases.
The Federal Reserve and other major central banks must balance inflation targeting mandates against financial stability concerns during energy crises. Supply-driven inflation typically requires different policy responses than demand-driven price increases, as interest rate policy demonstrates limited effectiveness against external supply shocks.
International monetary policy coordination becomes essential when energy disruptions create divergent inflation and growth impacts across major economies. Currency stability and trade balance considerations may require coordinated intervention to prevent competitive devaluation cycles that worsen global adjustment processes.
Fiscal Policy Tools and Limitations
Government fiscal responses to energy crises operate through multiple channels, including consumer energy subsidies, strategic infrastructure investment, and economic stimulus programs targeted at affected sectors. However, fiscal policy effectiveness depends on implementation speed and targeting accuracy.
Energy subsidy programs can provide immediate consumer relief but may worsen underlying supply-demand imbalances by maintaining artificially high consumption levels. Gasoline tax suspensions and heating oil subsidies reduce consumer costs but do not address supply constraints that drive price increases.
Infrastructure investment acceleration represents a longer-term policy response that can enhance energy security and economic resilience. Pipeline expansion projects, renewable energy deployment, and grid modernisation initiatives provide economic stimulus while reducing future vulnerability to supply disruptions.
Risk Assessment and Probability-Weighted Economic Scenarios
Comprehensive risk assessment requires evaluation of multiple scenario pathways with associated probability estimates and economic impact projections. This framework enables policymakers and market participants to prepare appropriate response strategies across different disruption severity levels.
Base Case Scenario Analysis (60% Probability)
The most likely scenario involves 4-8 week disruption duration with gradual restoration of transit capacity through diplomatic resolution or military de-escalation. This timeframe allows market adaptation mechanisms to operate while preventing structural inflation embedding across the broader economy.
Economic impacts under base case assumptions include:
• Moderate inflation acceleration to 2.5-2.9% year-over-year
• GDP growth deceleration to 2.0-2.3% without technical recession
• Energy price normalisation within 6-12 months of disruption resolution
• Limited structural adjustment in investment patterns and consumption behaviour
Market adaptation mechanisms operate effectively within this timeframe, including strategic reserve deployment, alternative routing activation, and demand adjustment through price elasticity effects. Consumer behaviour modifications remain temporary, with normal consumption patterns resuming following price normalisation.
Stress Case Scenario Implications (30% Probability)
Extended disruption scenarios involving 3+ month closures create qualitatively different economic impacts through structural adjustment pressures and embedded inflation expectations. This duration exceeds market adaptation capacity and requires fundamental restructuring of energy supply chains and consumption patterns.
Stress case economic characteristics include:
• Persistent inflation above 3.0% requiring monetary policy intervention
• Technical recession probability exceeding 60% in energy-dependent economies
• Structural supply chain adjustment with permanent routing and sourcing changes
• Investment pattern shifts prioritising energy security over cost optimisation
Consumer and business behaviour modifications become permanent under stress case conditions, as elevated prices persist long enough to influence long-term planning decisions. Energy efficiency investments, fuel substitution projects, and supply chain diversification initiatives receive accelerated implementation as economic actors adapt to higher structural energy costs.
Furthermore, these conditions may coincide with broader global instability, potentially amplifying the OPEC production impact on international energy markets.
Tail Risk Scenario Assessment (10% Probability)
Extreme scenarios involving permanent geopolitical realignment and structural energy market fragmentation create fundamental transformation of global economic relationships. These outcomes require complete restructuring of energy trade networks and international economic cooperation frameworks.
Tail risk implications encompass:
• Multi-year economic adjustment periods with sustained elevated costs
• Permanent supply chain reconfiguration away from Persian Gulf dependence
• Accelerated energy transition investment driven by security rather than environmental concerns
• Regional economic bloc formation based on energy security alliances
Under tail risk scenarios, short-term crisis management transitions into long-term structural transformation. Energy independence initiatives, alternative energy infrastructure, and strategic alliance formation become permanent features of economic policy rather than temporary crisis responses.
Such extreme disruptions would likely coincide with broader supply chain implications that extend far beyond energy markets, affecting global food security and manufacturing networks across multiple continents.
Disclaimer: This analysis incorporates market projections and scenario modelling that involve inherent uncertainty and speculation. Economic forecasts depend on assumptions about geopolitical developments, market behaviour, and policy responses that may not materialise as expected. Investors and policymakers should conduct independent analysis and risk assessment before making decisions based on scenario projections.
Want to Capitalise on Geopolitical Energy Market Volatility?
Discovery Alert's proprietary Discovery IQ model delivers instant notifications when ASX mineral discovery announcements create actionable investment opportunities, particularly valuable during periods of global energy uncertainty when commodity markets face heightened volatility. With major discoveries like lithium, uranium, and critical minerals driving substantial returns, subscribers gain immediate access to emerging opportunities in Australian resource companies that may benefit from shifting global energy dynamics and supply chain diversification trends.