July 21, 2026

Understanding the Strait of Hormuz: Why This 21-Mile Waterway Controls Global Energy Markets
Energy markets operate under constant tension between geopolitical stability and supply security, but few locations embody this dynamic as dramatically as the narrow waterway separating Iran from Oman. When 20% of global oil flows converge through a maritime corridor barely wider than the English Channel, the intersection of geography and geopolitics creates systemic vulnerabilities that ripple across international markets with unprecedented speed and magnitude. Furthermore, understanding the implications of a Strait of Hormuz blockade becomes essential for investors, policymakers, and business leaders navigating an increasingly interconnected global economy.
When big ASX news breaks, our subscribers know first
Geographic Chokepoint Fundamentals
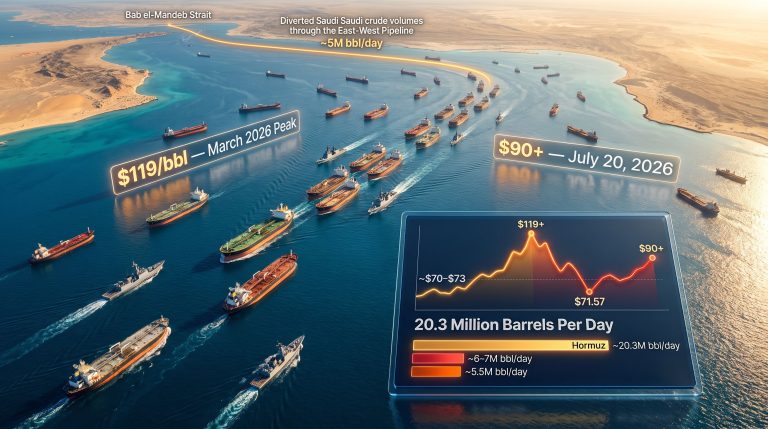
The Strait of Hormuz represents one of the most critical maritime passages in global commerce, with its narrowest point measuring just 21 miles (34 kilometers) between the Musandam Peninsula of Oman and Iran's coastline. This geographic constraint forces approximately 21 million barrels per day of crude oil and petroleum products through two designated shipping lanes, each only 2 miles wide, established under International Maritime Organisation protocols.
The strategic positioning creates inherent vulnerabilities that extend beyond simple transit logistics. Very Large Crude Carriers (VLCCs) carrying over 300,000 deadweight tons must navigate through waters with maximum operating drafts of 15-16 metres, requiring precise routing through designated channels. Seasonal variations, particularly summer monsoon patterns, further complicate navigation by affecting draft limitations and creating additional operational constraints.
Key Transit Statistics:
• Daily oil flow: 21 million barrels per day (20% of global petroleum trade)
• Transit time: 8-12 hours for complete passage
• Vessel capacity: VLCCs typically carry 2 million barrels per voyage
• Insurance requirements: War risk coverage mandatory during elevated threat periods
Alternative routing options remain severely limited by both infrastructure capacity and economic feasibility. The Suez Canal and Red Sea route adds 10-12 additional transit days, while overland pipeline alternatives lack sufficient capacity to replace Hormuz flows. This geographic reality transforms the Strait into what energy analysts describe as an irreplaceable component of global oil distribution networks.
Historical Precedents of Maritime Blockades
The 1980s Tanker War during the Iran-Iraq conflict provides the most comprehensive historical framework for understanding Strait of Hormuz disruptions. Between 1984 and 1988, both nations targeted commercial shipping, resulting in 544 vessel attacks and 2,431 seafarer casualties. However, despite this sustained campaign, oil transit through the Strait never completely ceased due to international naval presence and convoy protection protocols.
During this period, oil prices exhibited extreme volatility patterns that offer insights into market behaviour during prolonged Strait tensions. Initial price spikes of 65-100% occurred within weeks of escalation, but markets demonstrated remarkable adaptation through alternative routing, strategic reserve releases, and demand adjustment mechanisms. These oil price rally insights remain relevant for contemporary analysis.
International legal frameworks governing strait passage operate under the United Nations Convention on the Law of the Sea (UNCLOS), which establishes innocent passage rights for commercial vessels through territorial waters. Nevertheless, enforcement mechanisms depend heavily on naval presence and diplomatic pressure rather than legal jurisdiction, creating gaps between theoretical rights and practical implementation during crisis periods.
How Do Strait of Hormuz Blockades Actually Work in Practice?
Contemporary analysis reveals the mechanical complexity underlying Strait of Hormuz blockade scenarios, where financial markets and physical supply chains operate under fundamentally different timing mechanisms. Recent market observations demonstrate how 12.4 million barrels per day of curtailed production across seven Gulf states can create price volatility ranges exceeding 20% within single trading weeks.
Blockade Implementation Strategies
Modern blockade scenarios involve sophisticated combinations of naval positioning, selective enforcement, and psychological pressure that extend far beyond simple physical obstruction. Naval positioning strategies typically employ three-tier enforcement zones: outer perimeter surveillance, intermediate interdiction capabilities, and inner channel control through submarine deployment or surface vessel positioning.
Selective vs. Complete Closure Mechanisms:
- Selective enforcement targets specific flag states, cargo types, or vessel classifications
- Insurance-based disruption raises premiums to economically prohibitive levels without physical interdiction
- Administrative delays through extended inspection procedures and documentation requirements
- Complete physical closure via minelaying operations or sustained naval blockade
Insurance market responses often precede actual blockade implementation, as war risk premiums escalate from standard rates of 0.02-0.05% of cargo value to crisis levels of 0.5-2.0% based solely on threat perception. For a typical $100 million crude oil cargo, this represents an increase from $20,000-50,000 to $500,000-2,000,000 in additional insurance costs, effectively pricing many commercial operations out of viability.
Counter-Blockade Measures and Escalation Dynamics
International naval coalition responses follow established protocols developed during the 1980s Tanker War, emphasising convoy escort procedures and mine clearance operations. The United States maintains Fifth Fleet headquarters in Bahrain specifically to coordinate such responses, while European and Asian maritime powers contribute vessels and logistics support through formal burden-sharing agreements.
Escalation Timeline Framework:
| Phase | Duration | Primary Actions | Market Response |
|---|---|---|---|
| Initial Threat | 0-72 hours | Insurance premium increases, route planning adjustments | 5-15% oil price volatility |
| Limited Enforcement | 3-14 days | Selective vessel interdiction, convoy formation | 15-30% price escalation |
| Active Blockade | 2+ weeks | Complete transit denial, naval confrontation | 40-80% price surge potential |
| Military Resolution | Variable | International intervention, diplomatic mediation | Price normalisation over 4-12 weeks |
Strategic petroleum reserve deployment protocols provide temporary market stabilisation, with most developed nations maintaining 90-day emergency stocks. However, reserve release effectiveness depends on coordination timing and alternative supply activation, creating complex policy decisions that must balance immediate market relief against long-term strategic vulnerability. Consequently, understanding trade war oil movements becomes crucial for predicting market responses.
What Are the Immediate Economic Consequences of Hormuz Disruptions?
The economic ramifications of Strait of Hormuz blockade scenarios extend far beyond simple oil price increases, creating cascading effects through global supply chains that amplify initial disruptions through interconnected market mechanisms. Contemporary market analysis reveals how financial pricing models diverge significantly from physical supply realities during crisis periods.
Oil Price Volatility Patterns
Historical data demonstrates that Strait of Hormuz blockade scenarios generate asymmetric price responses, where upward price movements substantially exceed downward corrections during resolution phases. Recent market observations show Brent crude trading ranges expanding from typical 3-5% weekly volatility to 20-25% ranges during acute Strait tensions.
Documented Price Impact Analysis:
| Disruption Type | Historical Example | Price Impact | Recovery Duration |
|---|---|---|---|
| Threat Only | 2011 Iranian naval exercises | +30% ($85 to $110/bbl) | 6-8 weeks |
| Production Attack | 2019 Aramco drone strikes | +15-19% single day | 4-5 weeks |
| Transit Disruption | 1980s Tanker War peaks | +65-100% sustained | 3-6 months |
| Complete Closure | No modern precedent | Estimated +100-200% | 6-12 months |
Market psychology during Strait crises exhibits distinct patterns where financial optimism regarding diplomatic resolution conflicts with physical market deterioration. Energy analysts observe that markets simultaneously price probability distributions for negotiated settlements while physical oil flows experience cumulative constraint through disrupted routing, elevated freight costs, and insurance premium escalation.
Global Supply Chain Ripple Effects
Refined product shortages emerge through predictable cascade patterns that begin with forward contract repricing and evolve into physical scarcity within 21-45 days depending on regional strategic reserve levels. Refinery utilisation rates decline as crude intake capacity drops, while refined product inventories deplete at 1-2% daily rates in import-dependent markets.
Critical Supply Chain Vulnerabilities:
• Jet fuel supplies: Aviation industry faces acute shortages within 2-3 weeks
• Petrochemical feedstocks: Plastic and chemical manufacturing disruptions within 30 days
• LNG flows: 30% of global liquefied natural gas transits through Hormuz
• Fertiliser production: Agricultural input cost escalation affecting food security
Freight rate escalations compound supply disruptions through voyage time extensions and route economics. Alternative routing via the Suez Canal adds 10-12 transit days at additional costs of $400,000-480,000 per voyage, translating to $2-3 per barrel in marginal transportation costs. For refined products with higher value-to-volume ratios, these increases represent 4-6% immediate cost escalations at wholesale levels.
Critical Market Insight: Physical oil flows remain constrained by disrupted routing, extended voyage times, and elevated freight costs, while financial markets price diplomatic resolution probabilities rather than cumulative physical deterioration.
Which Countries Face the Greatest Strategic Vulnerability?
Import dependency analysis reveals stark asymmetries in Strait of Hormuz blockade exposure, with Asian economies facing disproportionate vulnerability due to geographic positioning and limited alternative supply sources. Japan's 90% Middle East oil dependency represents the most acute single-nation exposure, while South Korea, India, and China face escalating vulnerability as domestic production declines relative to consumption growth.
Import-Dependent Nations Risk Assessment
High-Risk Import Dependencies:
• Japan: 90% Middle East crude dependency, 60-day strategic reserves
• South Korea: 85% Middle East dependency, limited overland alternatives
• India: 65% Middle East imports, rapidly growing consumption base
• China: 45% Middle East dependency, increasing due to domestic production plateau
European markets face different vulnerability profiles due to alternative supply access through North Sea production, Russian pipeline networks (when operational), and North African imports. However, refinery configurations optimised for Middle Eastern crude grades create substitution challenges that manifest as processing cost increases rather than absolute supply shortages.
Strategic reserve adequacy varies significantly across import-dependent nations, with International Energy Agency member countries maintaining mandatory 90-day import coverage while non-IEA emerging markets often operate with 30-45 day inventory levels. These disparities create differential market impact timelines and policy response capabilities during prolonged disruptions.
Regional Economic Impact Modelling
Asia-Pacific manufacturing sectors face compound vulnerability through both direct energy cost increases and indirect supply chain disruptions. Petrochemical-intensive industries including automotive, electronics, and packaging experience cascading cost pressures that extend beyond simple energy input pricing.
Currency pressure dynamics emerge as oil-importing nations face simultaneous challenges: increased import costs denominated in U.S. dollars coincide with potential capital flight during geopolitical uncertainty. Historical analysis shows emerging market currencies declining 5-15% against the dollar during sustained oil price spikes, creating feedback loops that amplify energy import costs.
Manufacturing Sector Impact Assessment:
- Chemical and petrochemical: Direct feedstock cost increases of 15-25%
- Steel and aluminium: Energy-intensive processes face 8-12% cost escalation
- Transportation: Fuel cost increases affect logistics and distribution networks
- Agriculture: Fertiliser price spikes impact food production costs
Food security implications develop through fertiliser supply chain disruptions, as natural gas-based ammonia production faces input cost pressures that translate into agricultural productivity concerns within 6-12 months of sustained disruptions. This creates secondary humanitarian considerations beyond immediate energy market impacts, particularly when considering broader US–China trade war impacts.
How Do Financial Markets Price Hormuz Blockade Risk?
Financial market mechanisms for pricing Strait of Hormuz blockade risk operate through complex interactions between forward-looking probability assessments and backward-looking volatility models. Options markets provide real-time risk premium calculations through implied volatility surfaces, while commodity futures curves reveal expectations regarding disruption duration and resolution likelihood.
Risk Premium Calculation Methodologies
Energy market analysts employ multi-factor models that decompose oil price volatility into fundamental components: supply-demand balance changes, geopolitical risk premiums, financial market liquidity effects, and currency fluctuation impacts. During Strait tensions, geopolitical risk premiums can account for $15-30 per barrel of crude oil pricing above fundamental equilibrium levels.
Options Market Indicators:
• Implied volatility skew: Call option premiums exceed put premiums during supply threat scenarios
• Term structure inversion: Near-term volatility exceeds long-term expectations
• Cross-commodity correlations: Oil volatility spreads to natural gas and refined products
• Currency hedge demand: Increased options activity in oil-importing nation currencies
Commodity curve analysis reveals market expectations through contango and backwardation patterns. During active Strait tensions, front-month contracts typically trade at significant premiums to longer-dated futures, reflecting immediate supply concerns versus expectations of eventual resolution. Backwardation spreads exceeding $5-10 per barrel between front and 12-month contracts indicate severe near-term supply anxiety.
Investment Strategy Adaptations
Portfolio managers employ sector rotation strategies that capitalise on Strait of Hormuz blockade scenarios through energy equity positioning, infrastructure investments, and currency hedging mechanisms. Energy sector equities demonstrate non-linear responses to oil price increases, with upstream exploration companies showing 2-3x leverage to crude price movements during supply crisis periods.
Strategic Investment Positioning:
- Long energy equities: Upstream oil companies, tanker operators, refining capacity
- Short oil-intensive sectors: Airlines, transportation, chemical manufacturing
- Currency strategies: Long oil-exporting currencies, short import-dependent currencies
- Alternative energy acceleration: Renewable technology and infrastructure investments
Infrastructure investment priorities shift dramatically during sustained Strait tensions, with strategic petroleum reserve expansion, alternative pipeline development, and renewable energy acceleration receiving enhanced capital allocation. These investment themes create long-term structural changes that persist beyond immediate crisis resolution, often influenced by tariffs' market impact.
The next major ASX story will hit our subscribers first
What Military and Diplomatic Solutions Exist for Hormuz Crises?
Military response frameworks for Strait of Hormuz blockade scenarios operate through established naval coalition structures developed during decades of Persian Gulf security operations. The United States Fifth Fleet, headquartered in Bahrain, coordinates multinational naval presence including vessels from European allies, regional partners, and Asian maritime powers with significant energy import dependencies.
Naval Force Deployment Scenarios
Coalition Maritime Security Operations follow standardised protocols emphasising convoy protection, mine clearance capabilities, and graduated escalation responses. Naval force structures typically include:
• Destroyer escorts: Anti-submarine warfare and surface threat protection
• Mine countermeasure vessels: Channel clearance and safe passage restoration
• Logistics support ships: Extended operation sustainment capabilities
• Intelligence platforms: Surveillance and threat assessment coordination
Escort convoy protection protocols developed during the 1980s Tanker War provide operational templates for commercial vessel security. Convoy formations typically include 6-12 commercial vessels with dedicated naval escorts, following predetermined routes and timing schedules that optimise protection while maintaining operational efficiency.
Mine Clearance Operations represent the most technically demanding aspect of Strait reopening procedures. Modern naval mines employ sophisticated triggering mechanisms and acoustic signatures that require specialised equipment and trained personnel. Historical precedent suggests 2-4 weeks minimum timeframe for comprehensive channel clearance following active mining operations.
Diplomatic Resolution Frameworks
International mediation mechanisms for Strait crises operate through multiple diplomatic channels, including direct bilateral negotiations, regional organisation mediation, and United Nations Security Council intervention. The Gulf Cooperation Council provides regional diplomatic infrastructure, while major energy-importing nations maintain direct diplomatic engagement capabilities.
Negotiation Structure Elements:
- Immediate ceasefire agreements: Temporary suspension of hostile activities
- Transit guarantee protocols: International monitoring of commercial passage rights
- Economic compensation frameworks: Financial settlements for disruption damages
- Long-term security arrangements: Permanent agreements preventing future closures
Economic sanction effectiveness versus military pressure represents a critical policy trade-off during Strait crises. Sanctions typically require 3-6 months to generate meaningful economic pressure, while military intervention produces immediate but potentially escalatory responses. Historical analysis suggests combined approaches utilising economic pressure alongside diplomatic engagement achieve higher success rates than purely military or economic strategies.
Recent developments in the 2026 Strait of Hormuz crisis demonstrate how diplomatic frameworks evolve under pressure. Meanwhile, analysis of the current US-Iran standoff reveals the complexity of contemporary resolution mechanisms.
How Long Can Global Markets Withstand a Complete Hormuz Closure?
Strategic reserve depletion analysis reveals critical vulnerability timelines that vary significantly across different economic regions and energy security frameworks. International Energy Agency member countries maintain coordinated 90-day strategic petroleum reserves, but actual market stability depends heavily on demand destruction patterns and alternative supply activation capabilities rather than pure inventory mathematics.
Strategic Reserve Depletion Timelines
Global Strategic Reserve Capacity:
| Region/Country | Reserve Duration | Daily Release Capability | Market Impact Timeline |
|---|---|---|---|
| United States | 90+ days | 4.4 million bpd maximum | Immediate price stabilisation |
| European Union | 90 days (coordinated) | 2.8 million bpd combined | 2-3 day implementation lag |
| Japan | 90+ days | 1.6 million bpd | Regional supply priority |
| China | 45-60 days (estimated) | 1.0 million bpd | National priority focus |
Critical Threshold Analysis: Strategic petroleum reserve effectiveness depends on coordinated international release timing and alternative supply source activation. Independent national reserve deployment creates market fragmentation rather than global price stabilisation.
Demand destruction mechanisms provide automatic market adjustment during extreme price escalations. Historical precedent suggests $150+ per barrel oil prices trigger 5-10% global demand reduction within 30-45 days through substitution effects, delayed consumption, and industrial process modifications. This demand response creates natural ceiling effects that limit price escalation duration regardless of supply constraint severity.
Alternative Supply Route Capacity Limits
Pipeline infrastructure alternatives face fundamental capacity constraints that prevent complete Strait of Hormuz replacement. The Trans-Arabian Pipeline system possesses theoretical capacity of 5 million barrels per day, representing only 25% of typical Hormuz transit volumes. Expansion projects require 18-36 months implementation timelines under optimal conditions.
Alternative Route Capacity Analysis:
• Suez Canal maximum throughput: 8-10 million bpd (limited by canal transit capacity)
• SUMED Pipeline: 2.5 million bpd current capacity, expandable to 4 million bpd
• Caspian Sea export routes: 3 million bpd potential through multiple pipeline systems
• North American shale surge capacity: 2-4 million bpd additional production possible within 6-12 months
Red Sea and Suez Canal routing alternatives face their own vulnerability considerations, particularly regarding Yemen-based security threats and Egyptian political stability. These alternative routes create geographic risk concentration rather than true diversification, potentially leading to simultaneous disruption scenarios.
Caspian Sea export route development represents the most promising long-term alternative, utilising Trans-Caspian Pipeline networks that bypass traditional Middle Eastern chokepoints entirely. However, these routes traverse multiple national jurisdictions and require sustained international cooperation for reliability assurance. Additionally, Saudi exploration impact influences alternative supply calculations.
What Are the Long-Term Geopolitical Consequences of Repeated Hormuz Disruptions?
Recurring Strait of Hormuz blockade scenarios accelerate fundamental shifts in global energy architecture, driving permanent changes in infrastructure investment, alliance structures, and technological development priorities. Energy security policy transformations emerge from cumulative disruption experiences rather than single crisis events, creating path-dependent outcomes that reshape international economic relationships.
Energy Security Policy Transformations
Accelerated renewable energy investment patterns reflect strategic hedging against future Strait vulnerabilities rather than pure environmental considerations. Energy independence initiatives receive enhanced political support following each disruption cycle, with investment timelines compressing from 20-30 year planning horizons to 10-15 year urgent implementation frameworks.
Policy Acceleration Mechanisms:
• Nuclear energy programme revival: 15-20 year construction timelines receive expedited approval processes
• Strategic mineral supply diversification: Critical battery and renewable technology inputs prioritised
• Grid infrastructure hardening: Electrical transmission resilience enhancement programmes
• Alternative fuel mandates: Transportation sector decarbonisation timeline acceleration
Strategic alliance restructuring around energy flows creates new diplomatic frameworks that transcend traditional security partnerships. Energy importing coalitions develop parallel structures to existing military alliances, focusing specifically on supply route protection, reserve sharing protocols, and alternative infrastructure development coordination.
Critical mineral supply chain diversification imperatives emerge as renewable energy acceleration increases dependency on lithium, cobalt, rare earth elements, and other materials with concentrated geographic distribution patterns. These dependencies create new chokepoint vulnerabilities that require proactive mitigation strategies before crisis emergence.
Regional Power Balance Shifts
Gulf state cooperation versus competition dynamics intensify during Strait crises, as regional oil exporters face simultaneous revenue disruption and enhanced strategic importance. Saudi Arabia and UAE pipeline capacity development receives priority investment to reduce Hormuz dependency, while maintaining regional influence through energy export capabilities.
Iran's leverage mechanisms demonstrate both capabilities and limitations during Strait confrontations. While closure threats provide significant diplomatic pressure, sustained blockades impose severe economic costs on Iran's own energy export revenues. This creates self-limiting escalation dynamics where prolonged closures become economically unsustainable for the blocking power.
Regional Influence Factors:
- Economic interdependence: Iran's revenue dependency on energy exports limits closure duration
- Alternative route development: Gulf states' pipeline investments reduce Iranian leverage over time
- International intervention: Major importing nations' naval presence deters sustained closures
- Technological substitution: Renewable energy development reduces long-term chokepoint importance
China's Belt and Road alternative corridor strategies accelerate following each Strait disruption, with Central Asian pipeline networks and overland transportation infrastructure receiving enhanced investment priority. These developments create gradual shifts in global trade flow patterns that reduce maritime chokepoint vulnerability over 15-25 year timeframes.
How Should Investors and Businesses Prepare for Future Hormuz Crises?
Investment strategy frameworks for Strait of Hormuz blockade preparedness require multi-dimensional risk management approaches that address portfolio volatility, operational continuity, and strategic positioning across different crisis probability scenarios. Professional portfolio managers employ systematic hedging mechanisms rather than speculative positioning to manage energy market exposure during geopolitical uncertainty periods.
Portfolio Risk Management Strategies
Energy sector exposure optimisation requires understanding correlation patterns between crude oil price movements and equity performance across different industry segments. Upstream exploration companies demonstrate 2-3x leverage to oil price changes during supply disruptions, while integrated oil companies show more moderate 1.5-2x correlations due to refining margin offsets.
Sector-Specific Exposure Guidelines:
| Sector | Oil Price Sensitivity | Crisis Response Pattern | Recommended Allocation |
|---|---|---|---|
| Energy Upstream | +200-300% correlation | Outperform during crises | 5-8% maximum portfolio weight |
| Energy Infrastructure | +100-150% correlation | Stable crisis performance | 3-5% strategic allocation |
| Airlines | -150-200% correlation | Severe underperformance | Reduce/hedge during tensions |
| Chemical/Petrochemical | -100-150% correlation | Margin compression risk | Monitor input cost exposure |
Geographic diversification requirements extend beyond traditional equity allocation models to include currency exposure management and sovereign risk assessment. Oil-importing economies face dual pressure during Strait crises through both higher import costs and potential currency depreciation, requiring hedging strategies that address correlated risks simultaneously.
Commodity hedging instrument selection involves choosing between futures contracts, options strategies, and structured products based on specific risk tolerance and market outlook parameters. Calendar spread strategies can provide protection against short-term price spikes while maintaining exposure to longer-term energy market fundamentals.
Operational Contingency Planning
Supply chain redundancy development requires systematic identification of single points of failure within procurement, manufacturing, and distribution networks. Companies with significant energy input costs or Middle East supplier dependencies must develop alternative sourcing protocols that can activate within 30-60 days of disruption onset.
Critical Contingency Elements:
• Inventory management: Strategic buffer stock optimisation for extended lead time scenarios
• Alternative supplier relationships: Pre-negotiated contracts with geographically diverse sources
• Transportation flexibility: Multiple routing options and carrier relationships
• Financial hedging: Currency and commodity exposure management protocols
Force majeure clause optimisation in commercial contracts requires specific language addressing Strait closure scenarios, with clear definitions of triggering events, notification procedures, and cost allocation mechanisms. Standard force majeure clauses often prove inadequate during complex geopolitical disruptions that combine physical constraints with insurance and financing complications.
Operational scenario planning should include stress testing for 30-day, 90-day, and 180-day disruption scenarios with corresponding response protocols. These scenarios must address escalating constraint levels rather than binary on/off assumptions, as partial Strait disruptions create different operational challenges than complete closures.
Investment Strategy Summary:
Successful Strait of Hormuz blockade preparation requires integrated approaches that combine portfolio hedging, operational flexibility, and strategic positioning rather than speculative market timing. Professional investors focus on risk management and downside protection while maintaining exposure to energy sector opportunities during crisis resolution phases.
Disclaimer: This analysis is for educational purposes only and does not constitute investment advice. Energy market investments involve substantial risks, including total loss of capital. Geopolitical scenarios described may not materialise as projected, and historical precedents may not predict future outcomes. Consult qualified financial advisers before making investment decisions.
Ready to Navigate the Next Energy Market Crisis?
Strait of Hormuz tensions demonstrate how quickly geopolitical events can reshape global markets, creating both significant risks and exceptional opportunities for those prepared with timely information. Discovery Alert's proprietary Discovery IQ model identifies emerging opportunities across energy, mining, and commodity sectors, providing subscribers with real-time alerts on significant ASX discoveries that could benefit from global supply disruptions and energy market volatility. Begin your 14-day free trial today to position yourself ahead of market-moving developments and secure actionable insights when energy markets face their next major disruption.