July 13, 2026
Global energy markets remain vulnerable to supply disruptions that can reshape economic fundamentals within hours. The strait of Hormuz oil disruption represents perhaps the most significant single-point failure risk in the international energy system, with cascading effects that extend far beyond immediate crude oil price impacts.
Modern oil price movements during geopolitical crises demonstrate how quickly financial markets can amplify physical supply constraints. Furthermore, the interconnected nature of global energy infrastructure means that disruptions propagate through multiple channels simultaneously, affecting refined products, petrochemicals, and natural gas.
What Makes the Strait of Hormuz Critical to Global Oil Security?
Geographic Chokepoint Analysis
The Strait of Hormuz represents perhaps the most concentrated energy vulnerability in the global system. This narrow waterway connects the Persian Gulf to the Arabian Sea, with its narrowest navigable channel measuring just 21 nautical miles between the Iranian coast and Oman's Musandam Peninsula.
The shipping lanes themselves are even more constrained, with two-mile-wide traffic separation schemes for inbound and outbound tanker traffic. During peak transit periods, vessels pass through these channels at intervals of less than 30 minutes, creating a continuous stream of energy cargo worth billions of dollars daily.
Water depth variations add another layer of complexity. While the deepest sections reach 290 feet, shallower areas limit the maximum size of vessels that can transit safely. Ultra Large Crude Carriers (ULCCs) exceeding 320,000 deadweight tons often require specific tidal conditions and specialised navigation protocols.
Weather patterns further complicate transit security. The region experiences shamal winds that can reach 40 knots, creating hazardous conditions for loaded tankers. Summer temperatures exceeding 50°C (122°F) affect both crew safety and cargo handling procedures.
Global Energy Flow Dependencies
Current estimates indicate that approximately 21% of global petroleum liquids pass through the Strait of Hormuz annually. This translates to roughly 21 million barrels per day during normal operations, including both crude oil and refined products.
The strait's importance extends beyond crude oil to encompass:
- Natural gas flows: Approximately 20% of global LNG trade transits through Hormuz
- Condensate exports: Light hydrocarbon liquids essential for refinery blending
- Refined products: Including jet fuel, gasoline, and marine bunker fuels
- Petrochemical feedstocks: Naphtha and other chemical precursors
Regional production facilities connected to Hormuz-dependent export infrastructure include:
- Saudi Arabia: Ras Tanura (3.5 million bpd capacity), Ju'aymah (1.2 million bpd)
- UAE: Das Island LNG facility, Jebel Ali refined products terminal
- Kuwait: Mina Al-Ahmadi complex (2.1 million bpd export capacity)
- Iraq: Basra Oil Terminal and Al Faw facilities
- Iran: Kharg Island terminal (historically 1.5 million bpd capacity)
The economic value of daily transits exceeds $1.2 billion at current energy prices, representing approximately 0.8% of global GDP flowing through a single chokepoint.
When big ASX news breaks, our subscribers know first
Which Oil Production Systems Face the Greatest Vulnerability?
Gulf Cooperation Council Export Infrastructure
The concentration of export infrastructure within the Persian Gulf creates extraordinary vulnerability to supply disruptions. Major facilities operate with limited redundancy, as the economics of oil production have historically favoured centralised, high-capacity terminals over distributed export systems.
Saudi Aramco's Ras Tanura facility represents the world's largest offshore oil loading terminal, capable of simultaneously berthing multiple Very Large Crude Carriers (VLCCs). The facility's four sea berths can accommodate vessels up to 350,000 deadweight tons, while two Single Point Moorings (SPMs) handle the largest Ultra Large Crude Carriers.
The UAE's Das Island facility combines oil and LNG export capabilities, processing natural gas from offshore fields whilst also handling crude oil from Abu Dhabi's onshore and offshore production areas. This dual-purpose infrastructure creates both efficiency and vulnerability, as disruption affects multiple energy commodities simultaneously.
Kuwait's Mina Al-Ahmadi complex includes three distinct terminals: Mina Al-Ahmadi proper, Mina Saud, and Mina Abdullah. The integrated design allows for operational flexibility but also means that security threats affecting the broader complex impact Kuwait's entire export capacity.
Production Capacity at Risk Assessment
| Country | Daily Production Capacity | Hormuz Dependency | Alternative Routes | Recovery Timeline |
|---|---|---|---|---|
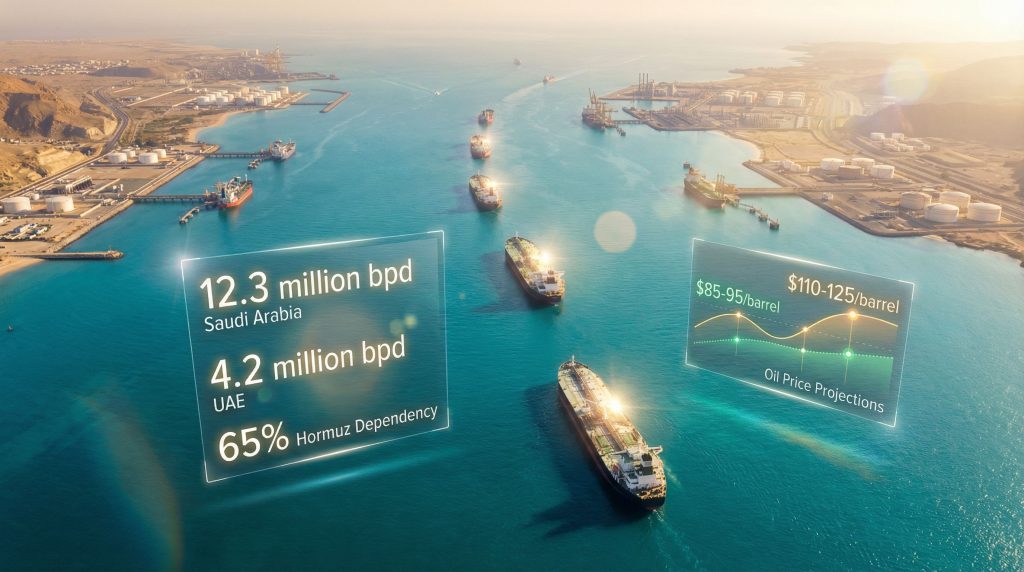
| Saudi Arabia | 12.3 million bpd | 65% | East-West Pipeline (5 million bpd) | 6-12 months |
| UAE | 4.2 million bpd | 85% | Abu Dhabi Pipeline (1.5 million bpd) | 12-18 months |
| Kuwait | 2.9 million bpd | 95% | Limited alternatives | 18-24 months |
| Iraq | 4.8 million bpd | 80% | Northern pipelines (variable) | 12-24 months |
| Qatar | 1.8 million bpd + LNG | 100% | No crude alternatives | 24-36 months |
The recovery timeline estimates assume different levels of infrastructure damage and the time required to restore full operational capacity. These projections consider factors including spare parts availability, skilled labour access, and the complex logistics of marine terminal reconstruction.
Strategic Reserve Implications
International Energy Agency (IEA) member countries maintain strategic petroleum reserves totalling approximately 1.5 billion barrels. However, the maximum release rate of roughly 4 million barrels per day could offset only a fraction of potential Hormuz-related supply losses.
The IEA's emergency response protocols include:
- Demand restraint measures: Reduced speed limits, car-free days, industrial fuel switching
- Coordinated stock releases: Synchronised drawdowns from member country reserves
- Supply enhancement: Increased production from non-affected regions
- Market transparency: Enhanced data sharing and communication protocols
Commercial inventory levels in key consuming regions typically provide 20-90 days of consumption coverage, depending on local regulations and market structures. However, panic buying and precautionary stockpiling can rapidly deplete these buffers during crisis periods.
How Do Oil Price Models Respond to Hormuz Disruption Scenarios?
Short-Term Price Volatility Mechanisms
Oil price discovery mechanisms become severely distorted during chokepoint disruptions as physical supply constraints intersect with financial market speculation. The risk premium embedded in futures prices can expand from typical levels of $2-5 per barrel to $20-40 per barrel during acute supply threats.
Spot market differentials experience dramatic shifts as regional crude oil benchmarks diverge. Brent crude, typically trading at a $2-4 premium to West Texas Intermediate (WTI), can see this differential expand to $15-25 per barrel as Atlantic Basin supplies become relatively more valuable than landlocked North American production.
Asian crude benchmarks such as Dubai Crude and Oman Crude experience the most severe price impacts, often trading at $10-30 premiums to other global benchmarks during Hormuz disruptions. This reflects both supply scarcity and the logistical premium required to secure alternative supply sources.
Freight rates for crude oil tankers increase exponentially during disruption scenarios. Worldscale rates for VLCC voyages from the Middle East to Asia can surge from typical levels of WS 40-60 to WS 200-400, reflecting both increased voyage distances and elevated insurance costs.
Duration-Based Economic Modelling
30-Day Disruption Scenario:
- Brent crude price range: $95-110 per barrel (from $75 baseline)
- Strategic reserve drawdown: 120-150 million barrels globally
- GDP impact: 0.2-0.4% reduction in global economic growth
- Inflation acceleration: 1.5-2.5 percentage points annualised
90-Day Extended Disruption Scenario:
- Price escalation: $125-150 per barrel range
- Demand destruction threshold: 2-4 million bpd global consumption reduction
- Recession probability: 60-75% likelihood for major economies
- Alternative supply activation: 1.5-2.5 million bpd additional production
Recovery timeline modelling indicates that even after physical infrastructure repairs, market normalisation requires additional 6-12 months as:
- Commercial inventories rebuild to normal levels
- Risk premiums gradually decline
- Alternative supply routes optimise efficiency
- Consumer confidence in supply security returns
Macroeconomic Transmission Channels
The relationship between oil price increases and GDP growth varies significantly across regions. Oil-importing economies typically experience a 0.1-0.2% reduction in GDP growth for every $10 per barrel increase in oil prices, though this relationship has weakened as economies have become more energy-efficient.
Inflation acceleration occurs through multiple channels:
- Direct energy costs: Gasoline, diesel, and heating oil price increases
- Transportation costs: Freight and logistics cost inflation
- Indirect effects: Food prices, manufacturing costs, service sector impacts
- Wage-price spirals: Secondary effects through labour market adjustments
Current account balance shifts can be dramatic for oil-importing nations. A sustained $30 per barrel oil price increase can worsen the current account deficit by 0.5-1.5% of GDP for major oil importers like Japan, India, and several European economies.
What Alternative Supply Chain Adaptations Emerge During Disruptions?
Pipeline Bypass Infrastructure Activation
Saudi Arabia's East-West Pipeline represents the most significant alternative to Hormuz transit, with a capacity of 5 million barrels per day. The 746-mile pipeline system connects Eastern Province oil fields to Red Sea export terminals at Yanbu, though current utilisation typically remains below 50% of capacity.
The pipeline infrastructure faces several operational constraints:
- Pump station capacity: Requires 48-72 hours for full capacity activation
- Terminal readiness: Yanbu facilities need advance preparation for increased throughput
- Tanker availability: Red Sea export routes require different vessel scheduling
- Quality specifications: Crude oil blending adjustments for different export grades
UAE's pipeline alternatives include the Abu Dhabi Crude Oil Pipeline, capable of handling 1.5 million barrels per day from onshore fields to Fujairah terminal on the Gulf of Oman. This route bypasses the Strait of Hormuz entirely, though capacity limitations restrict its ability to handle total UAE production.
Iraq's Northern Pipeline System connects southern oil fields to Turkish Mediterranean terminals, with theoretical capacity exceeding 1.5 million barrels per day. However, security concerns, technical maintenance issues, and political complications have historically limited reliable throughput to 400,000-600,000 bpd.
Maritime Route Diversification
Cape of Good Hope routing becomes economically viable when time charter rates and insurance costs justify the additional voyage time. The route adds approximately 2-3 weeks to Asia-bound voyages and increases transportation costs by $2-4 per barrel, depending on vessel size and market conditions.
Suez Canal capacity constraints limit the ability to redirect significant volumes through this alternative route. The canal's maximum daily capacity of approximately 50-60 vessels includes all ship types, with crude oil tankers representing only a fraction of total traffic.
Arctic shipping routes remain primarily theoretical for crude oil transport due to:
- Seasonal limitations: Ice-free navigation windows of 3-4 months annually
- Insurance restrictions: Limited coverage availability for Arctic crude oil voyages
- Infrastructure gaps: Insufficient port facilities and emergency response capabilities
- Environmental regulations: Strict emissions and safety requirements
Strategic Stockpile Deployment Protocols
The IEA Coordinated Emergency Response Measures (CERM) protocol enables member countries to release strategic petroleum reserves in coordinated fashion. Maximum sustainable release rates total approximately 4 million barrels per day across all member countries, though this capacity cannot be maintained beyond 90-120 days without compromising emergency reserve adequacy.
China's Strategic Petroleum Reserve system, whilst not subject to IEA coordination, maintains an estimated 500-600 million barrels in government reserves plus additional commercial stockpiles. Chinese authorities have demonstrated willingness to release reserves during price spikes, though decision-making processes remain opaque to international markets.
Commercial inventory coordination presents significant challenges as private companies optimise their own supply security rather than global market stability. Minimum stock requirements in various countries provide some coordination mechanism, but enforcement and monitoring capabilities vary widely.
Which Industries Experience the Most Severe Secondary Effects?
Petrochemical Manufacturing Disruptions
The integrated nature of Middle Eastern energy infrastructure means that petrochemical facilities face simultaneous disruptions to feedstock supplies and export logistics. Major petrochemical complexes in Saudi Arabia, UAE, and Kuwait typically source ethane, propane, and naphtha from the same production systems that export crude oil through Hormuz.
Global polymer markets experience particularly severe disruptions as:
- Polyethylene production in the Gulf region represents 25% of global capacity
- Polypropylene manufacturing depends heavily on propane feedstocks from Gulf producers
- PET plastic precursors face supply chain interruptions affecting packaging industries
- Synthetic rubber production experiences feedstock shortages impacting tyre manufacturing
Fertiliser production capacity reductions create cascading effects through global agriculture:
- Ammonia synthesis depends on natural gas feedstocks from affected regions
- Urea production faces both feedstock and export logistics challenges
- Phosphate fertilisers require sulphuric acid often produced using sulphur from oil refining
- Seasonal timing amplifies impacts during key planting periods
Chemical intermediates shortage cascades affect:
- Pharmaceutical manufacturing: API production using petrochemical intermediates
- Electronics industry: Speciality chemicals for semiconductor manufacturing
- Automotive sector: Plastics, adhesives, and synthetic materials
- Construction materials: Insulation, piping, and structural components
Transportation Sector Vulnerabilities
Aviation fuel supply chains face immediate stress as jet fuel represents 8-12% of typical refinery output, and Middle Eastern refineries produce high-quality jet fuel specifications required for international aviation. Airport fuel storage capacity typically provides only 3-7 days of consumption coverage at major hubs.
Maritime bunker fuel availability creates secondary disruptions as ships require fuel oil or marine gas oil for propulsion. Singapore, Rotterdam, and Panama bunker hubs maintain strategic inventory levels, but price volatility and credit constraints can limit small shipping companies' access to fuel.
Road transport cost transmission occurs through multiple mechanisms:
- Direct fuel costs: Gasoline and diesel price increases
- Freight surcharges: Logistics companies pass through fuel cost increases
- Last-mile delivery: E-commerce and food delivery cost increases
- Public transportation: Government subsidies under pressure from higher fuel costs
Power Generation Sector Adaptations
Oil-fired power plants retain fuel switching capabilities in many markets, though natural gas often represents the primary alternative fuel. Gas turbine efficiency typically provides 40-60% thermal efficiency compared to 35-45% for oil-fired steam turbines, creating both economic and environmental incentives for fuel switching.
The importance of natural gas forecasts becomes evident as power generators adjust fuel procurement strategies during supply disruptions. Grid stability considerations become critical as multiple factors converge:
- Supply contract renegotiation: Long-term fuel supply agreements face force majeure claims
- Inventory management: Power plants increase fuel storage to minimise supply risk
- Maintenance scheduling: Deferred maintenance to maximise generation availability
- Interconnection utilisation: Increased electricity imports from less affected regions
Renewable energy deployment can experience acceleration during sustained high fossil fuel prices:
- Solar and wind projects: Improved economic competitiveness
- Energy storage systems: Enhanced value proposition for grid stability
- Grid integration: Accelerated infrastructure investment to accommodate variable generation
- Policy support: Government incentives for energy independence initiatives
How Do Financial Markets Price Hormuz-Related Energy Risk?
Derivatives Market Response Patterns
Oil futures curve structures transform dramatically during Hormuz crisis scenarios. Normal contango patterns (where future prices exceed spot prices) often invert to steep backwardation, with near-month contracts trading at $15-30 premiums to longer-dated futures as immediate supply scarcity dominates market psychology.
Oil futures trends reveal how implied volatility in options markets can surge from typical levels of 25-35% to 60-100% annualised volatility, reflecting both price uncertainty and liquidity premiums. At-the-money call options experience the most dramatic premium expansion, whilst deep out-of-the-money puts gain value as investors hedge against extreme downside scenarios.
Cross-commodity correlations strengthen significantly during energy crises:
- Natural gas prices typically rise 60-80% as much as crude oil prices
- Coal prices increase due to fuel switching in power generation
- Precious metals gain safe-haven demand during geopolitical uncertainty
- Agricultural commodities face fertiliser cost and transportation disruption pressures
Crack spread dynamics reflect refining margin opportunities as product prices often increase faster than crude oil costs. Gasoline crack spreads can expand from typical $15-25 per barrel to $40-60 per barrel during supply disruptions, whilst distillate cracks experience similar magnification effects.
Energy Sector Equity Valuation Impacts
Upstream oil companies with production outside the Gulf region typically experience 25-40% stock price appreciation during Hormuz disruption scenarios. North American shale producers, North Sea operators, and Latin American oil companies benefit from both higher oil prices and increased strategic value of their production locations.
Refining sector performance varies significantly based on crude oil sourcing and product market exposure:
- Complex refineries with heavy crude processing capabilities often outperform
- Simple refineries dependent on light sweet crude may face margin compression
- Integrated oil companies benefit from upstream production offsetting refining challenges
- Regional refiners in consuming markets gain competitive advantages
Energy infrastructure investments receive premium valuations during supply security crises:
- Pipeline companies with strategic route diversification capabilities
- Storage terminal operators benefiting from increased inventory demand
- LNG facilities providing supply flexibility between regions
- Renewable energy projects with accelerated development timelines
Currency and Bond Market Transmission
Petrodollar recycling mechanisms face severe disruption as oil-exporting nations experience reduced export revenues whilst oil-importing countries face deteriorating current accounts. This creates complex currency dynamics where traditional dollar strength during crises intersects with energy-induced inflation pressures.
Emerging market currencies with high oil import dependencies typically experience 15-25% depreciation against the U.S. dollar during sustained energy price increases. India, Turkey, South Africa, and Brazil face particular vulnerability due to large current account deficits and limited strategic reserves.
Sovereign bond markets reflect fiscal implications of energy price increases:
- Oil-exporting countries: Bond yields often decline due to improved fiscal positions
- Oil-importing nations: Yields typically increase reflecting fiscal strain and inflation concerns
- Credit ratings: Agencies often place import-dependent economies on negative watch
- Corporate bonds: Energy-intensive industries face credit quality downgrades
The next major ASX story will hit our subscribers first
What Long-Term Strategic Realignments Result from Prolonged Disruptions?
Energy Security Policy Transformations
National energy independence initiatives gain political momentum during supply crises, leading to accelerated domestic production programs and import diversification strategies. Strategic petroleum reserve expansion becomes a national security priority, with target inventory levels increasing from typical 90-day coverage to 180-day or greater protection.
Renewable energy transition timelines often experience significant acceleration as energy security considerations align with climate policy objectives. Government spending programmes for solar, wind, and energy storage deployment can increase by 50-100% during sustained high fossil fuel price periods.
Critical mineral supply chain diversification becomes strategically linked to energy security planning as battery storage, electric vehicle adoption, and renewable energy infrastructure require rare earth elements, lithium, cobalt, and copper from geographically diverse sources.
Geopolitical Alliance Restructuring
The strait of Hormuz oil disruption scenarios illuminate how OPEC market influence intersects with broader geopolitical realities. Energy partnership agreements undergo fundamental renegotiation as traditional supplier-consumer relationships prove vulnerable to geopolitical disruption.
Long-term purchase contracts increasingly include supply security clauses, alternative delivery mechanisms, and force majeure protections. Moreover, military cooperation frameworks expand to encompass maritime security operations in strategic waterways.
Naval protection for energy infrastructure and commercial shipping becomes a shared responsibility amongst allied nations with common energy security interests. Regional power dynamics shift as alternative energy suppliers gain increased geopolitical influence.
Norway, Canada, Guyana, and Brazil experience enhanced strategic partnerships with major consuming nations seeking supply diversification. According to energy analysts, "The global oil market's dependence on the Strait of Hormuz creates a single point of failure that affects approximately 21% of global petroleum liquids transit, making alternative supply routes increasingly valuable during geopolitical tensions."
Infrastructure Investment Prioritisation
Pipeline construction projects receive accelerated approval processes and enhanced financing support during post-crisis periods. Trans-regional pipeline networks connecting multiple supply sources become strategic infrastructure priorities comparable to national defence systems.
LNG terminal development experiences dramatic acceleration as supply flexibility between global regions becomes economically and strategically essential. Floating storage and regasification units (FSRUs) provide rapid deployment options for import capacity expansion.
Energy storage technology deployment scales rapidly as grid stability and supply security concerns drive policy support and private investment. Utility-scale battery systems, pumped hydro storage, and compressed air energy storage receive infrastructure investment comparable to traditional generation capacity.
Which Regional Markets Show Greatest Resilience During Supply Disruptions?
North American Energy Independence Factors
Shale oil production flexibility provides North America with unique supply response capabilities during global energy crises. U.S. unconventional production can typically increase output by 1-2 million barrels per day within 6-12 months of sustained higher prices, though drilling rig availability and pipeline capacity constraints limit immediate response.
Strategic petroleum reserve capacity in the United States totals 714 million barrels, providing approximately 75 days of import protection at normal consumption levels. Release mechanisms can deliver up to 4.4 million barrels per day for sustained periods, representing significant global market intervention capability.
Canada-U.S. energy integration provides additional supply security through oil sands production, hydroelectric power sharing, and natural gas pipeline networks. Cross-border energy trade totalling $150+ billion annually creates integrated market mechanisms that enhance supply flexibility.
European Union Adaptation Mechanisms
Diversified supply source portfolios reduce European vulnerability to single-region disruptions, though Russian energy dependencies create different vulnerability patterns. Norway's offshore production, North Sea resources, and North African pipeline supplies provide alternative supply routes that bypass Middle Eastern chokepoints.
EU emergency solidarity mechanisms include mandatory sharing of natural gas supplies during crisis periods and coordinated release of strategic petroleum stocks. REPowerEU initiatives accelerate renewable energy deployment and energy efficiency improvements to reduce import dependencies.
Green Deal acceleration opportunities leverage energy security concerns to advance climate policy objectives. Hydrogen infrastructure development, offshore wind expansion, and electric vehicle adoption receive enhanced policy support and financing mechanisms.
Asian Market Vulnerability Assessment
China's strategic reserve adequacy remains partially opaque but estimates suggest total government and commercial stocks of 800-900 million barrels. Reserve release capabilities during the COVID-19 period demonstrated coordination mechanisms between government stockpiles and commercial inventories.
Japan's energy security protocols include comprehensive emergency response frameworks developed through decades of import dependency management. Strategic reserves, demand reduction measures, and alternative fuel switching capabilities provide 90+ days of consumption coverage during supply disruptions.
India's import diversification strategies focus on expanding supplier relationships beyond traditional Middle Eastern sources. Growing imports from Russia, Latin America, and Africa reduce concentration risk, though total import dependency continues increasing with economic growth.
Southeast Asian collective response frameworks through ASEAN+3 emergency oil sharing mechanisms provide regional coordination during supply crises. Combined strategic reserves and commercial stockpiles across member countries create collective supply security comparable to individual major economies.
How Can Investors Position for Hormuz-Related Energy Volatility?
Portfolio Hedging Strategies
Energy commodity futures positioning requires sophisticated timing strategies as risk premiums can persist for months or years following initial crisis events. Long positions in front-month contracts capture immediate supply disruption effects, whilst calendar spreads profit from backwardation patterns during supply scarcity periods.
Options strategies for energy volatility include:
- Long straddles on crude oil futures to capture price movement in either direction
- Call spreads on refined product futures to benefit from margin expansion
- Put spreads on energy-intensive industrial stocks as cost hedging
- Volatility trading through VIX options during geopolitical uncertainty periods
Currency hedging becomes critical for international energy investments as dollar strength during crises can offset commodity price gains for non-U.S. investors. Emerging market currency puts provide portfolio protection against energy-induced current account pressures.
Sector Rotation Opportunities
Traditional energy vs. renewable energy timing strategies require careful analysis of policy response timelines and technology deployment speeds. Near-term outperformance typically favours conventional energy companies, whilst sustained high prices accelerate renewable energy adoption and long-term investment returns.
Trade war impacts create additional complexity during strait of Hormuz oil disruption scenarios. Regional refining capacity value propositions vary significantly based on crude oil sourcing flexibility and product market access:
- U.S. Gulf Coast refiners benefit from domestic crude oil and export capabilities
- European refiners face margin pressure from higher crude costs and demand destruction
- Asian refiners experience mixed impacts based on crude sourcing and government price controls
Energy storage technology investment themes gain momentum during sustained high energy prices as grid stability and supply security concerns drive policy support. Utility-scale battery manufacturers, pumped hydro developers, and compressed air energy storage companies benefit from accelerated deployment schedules.
Risk Management Framework Development
Scenario-based stress testing methodologies must account for multiple crisis duration possibilities and recovery timeline variations. Monte Carlo simulations incorporating geopolitical risk factors, infrastructure damage assessments, and alternative supply activation timelines provide probability-weighted return distributions.
Correlation analysis across energy subsectors reveals time-varying relationships during crisis periods:
- Upstream-downstream correlations often increase during supply disruptions
- Regional energy company correlations decrease as location-specific advantages emerge
- Energy-broader market correlations typically strengthen during sustained high prices
Tail risk protection through options strategies requires careful strike price and expiration selection as extreme events can exhaust traditional hedging mechanisms. Deep out-of-the-money options provide cost-effective protection against low-probability, high-impact scenarios.
ESG integration in energy transition investing creates additional complexity during fossil fuel price spikes as short-term performance pressures conflict with long-term sustainability objectives. Engagement strategies with energy companies on transition planning become increasingly important during high-price periods that improve cash flow generation capabilities.
Recent analysis suggests that "A sustained closure of the Strait of Hormuz would create the most severe oil supply shock since the 1970s, potentially removing 15-20 million barrels per day from global markets and triggering oil prices above $150 per barrel within weeks." Consequently, investors must prepare for unprecedented volatility levels that could reshape entire sectors.
Disclaimer: This analysis is for educational purposes only and does not constitute investment advice. Energy market investments carry significant risks including price volatility, geopolitical uncertainty, and regulatory changes. Past performance does not guarantee future results. Investors should conduct their own research and consult qualified professionals before making investment decisions. The scenarios presented are hypothetical and actual market conditions may differ significantly from these projections.
Are You Prepared for the Next Energy Supply Crisis?
Discovery Alert's proprietary Discovery IQ model delivers real-time alerts on significant ASX mineral discoveries, instantly empowering investors to identify actionable opportunities ahead of the broader market. Whilst global energy disruptions create volatility, smart investors position themselves in Australian mineral discoveries that often benefit from commodity price surges and supply chain diversification trends.