July 21, 2026
Strategic Maritime Chokepoints and Global Energy Vulnerability
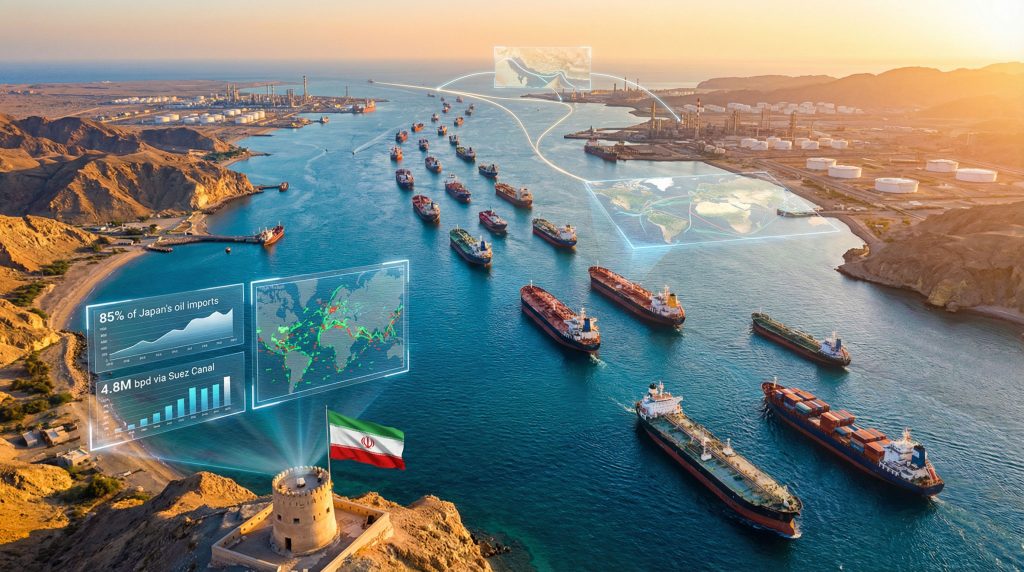
Modern energy infrastructure depends on critical maritime passages that concentrate massive flows of petroleum products through narrow geographic corridors. These chokepoints represent systemic vulnerabilities where geopolitical tensions can rapidly transform into global economic disruptions. The interconnected nature of energy markets means that disruptions in one region cascade across continents, affecting everything from industrial production to consumer fuel prices.
The concentration of energy flows through limited maritime routes creates what analysts term "chokepoint dependency" – where the closure of a single waterway can disrupt substantial portions of global energy trade. This vulnerability has intensified as global energy consumption has grown while the number of viable alternative routes remains constrained by geography and infrastructure capacity.
Understanding these dynamics becomes crucial when examining how regional conflicts can escalate into worldwide energy security crises, with implications extending far beyond the immediate geographic area of tension.
When big ASX news breaks, our subscribers know first
Iran Strait of Hormuz Closure: Understanding the Strategic Implications
The Strait of Hormuz represents the world's most critical energy chokepoint, with approximately 21 million barrels per day of crude oil and liquefied natural gas passing through this narrow waterway, according to the U.S. Energy Information Administration. This volume represents roughly 21% of global petroleum liquids trade, making any Iran Strait of Hormuz closure a matter of international concern.
The strait's strategic importance stems from its unique geographic position as the primary export route for Persian Gulf oil producers. At its narrowest point, the waterway measures approximately 21 nautical miles wide, with shipping lanes on the Iranian side measuring roughly 2 nautical miles, creating natural bottlenecks that can be exploited during periods of regional tension.
Iran has historically leveraged threats of strait closure as a diplomatic tool during periods of international pressure. Previous instances include threats during 2011-2012 sanctions discussions and following the U.S. withdrawal from the Joint Comprehensive Plan of Action in 2019. However, energy security analysts note that no complete closure has been successfully maintained, as such actions would damage Iran's own petroleum export revenues while provoking international military response.
Furthermore, recent developments in regional tensions have heightened concerns about potential disruptions, as reported by The Guardian's analysis of the current geopolitical situation.
Technical Maritime Constraints
The strait consists of two traffic separation schemes with designated shipping lanes that pass through Iranian territorial waters. The main shipping channel maintains a minimum depth of approximately 27 meters, sufficient for the largest petroleum tankers but creating navigational constraints that limit rerouting options during crisis periods.
Maritime authorities have documented that alternative routing around a strait closure would require vessels to:
• Navigate through significantly longer routes adding 7-18 days to transit times
• Utilise shipping lanes with lower capacity thresholds than current Hormuz volumes
• Accept substantially higher transportation costs ranging from $1.50 to $6.50 per barrel
• Coordinate with congested alternative chokepoints like the Suez Canal
Immediate Energy Market Disruption Scenarios
Energy markets respond rapidly to supply disruption threats, with historical precedents providing insight into potential volatility patterns. During the 2019 Abqaiq facility attack in Saudi Arabia, WTI crude increased approximately 19.5% in a single day, rising from around $54 per barrel to $62 per barrel, while Brent crude surged approximately 15% from $60 to $71 per barrel.
A complete Iran Strait of Hormuz closure would represent a more substantial supply disruption than the Abqaiq incident, potentially removing 5-6% of global daily oil supply from immediate access to international markets. According to the International Energy Agency, such disruptions typically trigger Strategic Petroleum Reserve coordination across OECD nations to stabilise pricing and supply availability.
In addition, the oil price movements during previous geopolitical crises demonstrate the market's sensitivity to supply chain disruptions in this critical region.
LNG Market Displacement Effects
Liquefied natural gas markets face particular vulnerability to Hormuz disruptions, as approximately 55-60% of global LNG transits Middle Eastern chokepoints. Industry analysis indicates that shipping delays of 7-14 days can increase spot LNG prices by 15-35%, creating ripple effects across regional gas markets from Europe to Asia.
The impact varies significantly by importing region:
• European markets can partially compensate through increased pipeline imports from Norway and Russia
• Asian markets face more limited alternatives, particularly Japan and South Korea with high LNG dependency
• Emerging markets experience the most severe impacts due to limited strategic reserves and contract flexibility
Moreover, the LNG market implications of supply disruptions extend beyond immediate pricing effects to long-term supply contract restructuring.
Alternative Route Capacity Analysis
| Route | Daily Capacity | Transit Time Extension | Cost Premium |
|---|---|---|---|
| Suez Canal | 4.8 million bpd | +7 days | +$2.50/barrel |
| Cape of Good Hope | 3.2 million bpd | +14 days | +$5.20/barrel |
| Trans-Arabian Pipeline | 1.65 million bpd | +3 days | +$1.80/barrel |
These alternative routes face significant constraints in absorbing full Hormuz volumes. The Suez Canal Authority manages approximately 12-13% of global trade volume and cannot accommodate a complete diversion of 21 million barrels per day without creating severe congestion and further delays.
National Energy Security Vulnerability Assessment
Different nations face varying levels of exposure to Hormuz-related supply disruptions based on their import dependency ratios, source diversification, and strategic reserve capacities. The most vulnerable economies share common characteristics: high energy import dependency, limited domestic production, and concentrated sourcing from Middle Eastern suppliers.
Japan's Critical Exposure
Japan imports approximately 85-90% of its crude oil consumption, with roughly 70-80% sourced from Middle Eastern producers. This translates to approximately 60-65% of Japan's crude imports transiting through the Strait of Hormuz, creating acute vulnerability to any sustained closure.
Japan maintains 240 million barrels in strategic petroleum reserves, equivalent to approximately 170 days of net imports at current consumption levels. While this represents one of the world's highest reserve-to-consumption ratios, Japanese industry analysts note that prolonged disruptions would require demand management protocols across transportation and manufacturing sectors.
South Korea's Manufacturing Vulnerability
South Korea imports 98-99% of crude oil consumed domestically, with approximately 70-75% sourced from Middle Eastern suppliers. The nation's 65-70% dependency on Hormuz transit routes creates particular risks for its petrochemical and heavy industry sectors, which require consistent feedstock availability for optimal production schedules.
The country's 180 million barrel strategic reserve provides substantial buffer capacity, but energy economists note that South Korea's industrial structure makes it particularly sensitive to price volatility rather than absolute supply shortages.
India's Growing Energy Import Dependency
India imports approximately 85% of total crude oil consumption, with 60-65% sourced from Middle Eastern producers. The country's 55-60% Hormuz dependency coincides with rapid economic growth that continues expanding energy demand across transportation, industrial, and residential sectors.
India's strategic petroleum reserve capacity of approximately 71 million barrels provides only 35-40 days of import coverage, significantly lower than other major consuming nations. This limited reserve capacity creates urgent vulnerability during extended disruption periods, though India benefits from geographic access to African sources and emerging Central Asian suppliers that bypass Hormuz routing.
China's Diversified Supply Strategy
China imports approximately 50-55% of total crude oil consumption, with 45-50% sourced from Middle Eastern suppliers. The country's 40-45% Hormuz transit exposure reflects deliberate supply diversification strategies including overland pipeline imports from Russia and Central Asia.
China maintains an estimated 300-350 million barrel strategic reserve, providing substantial buffer capacity. Chinese energy planners have systematically developed alternative supply corridors specifically to reduce dependence on maritime chokepoints, including the Belt and Road infrastructure investments.
International Response Coordination Mechanisms
Global powers maintain established frameworks for responding to energy supply disruptions, though the effectiveness of these mechanisms depends on the scope and duration of any closure. Historical patterns suggest coordinated responses typically occur within 72-96 hours of confirmed supply disruptions.
United States Strategic Response Capabilities
The U.S. Navy maintains permanent presence in the Persian Gulf region through the Fifth Fleet headquartered in Bahrain, typically including 25-30 naval vessels and 1-2 Carrier Strike Groups in the Arabian Sea and Persian Gulf areas. This existing presence enables rapid response escalation during maritime security crises.
The U.S. Strategic Petroleum Reserve contains 714 million barrels capacity with current utilisation levels around 370-380 million barrels. The reserve system can release up to 4.4 million barrels per day during surge capacity operations, providing substantial market intervention capability during supply disruptions.
European Union Energy Diversification Protocols
European Union LNG regasification capacity totals approximately 200+ billion cubic metres annually, with 30-35% typically sourced from Middle Eastern suppliers. Emergency protocols activate alternative supply sources including:
• Australia (~20% of EU LNG imports)
• United States (~15% of imports)
• Qatar (~25% of imports)
• Norway pipeline capacity expansion during crisis periods
The EU's diversified supply base provides more flexibility than Asian markets, though sustained disruptions would still require demand management across industrial and residential sectors.
Regional Alliance Coordination
The Gulf Cooperation Council, comprising Saudi Arabia, UAE, Qatar, Kuwait, Bahrain, and Oman, maintains coordination mechanisms for spare production capacity deployment. Saudi Arabia and the UAE collectively control approximately 2-3 million barrels per day of spare capacity that can be activated within 30-90 days to partially offset supply disruptions.
However, these Gulf producers also depend on Hormuz for their own exports, limiting their ability to fully compensate for closure-related supply losses without alternative export infrastructure. Additionally, the OPEC production impact on global markets becomes more pronounced during supply crises.
Long-Term Geopolitical Transformation Scenarios
Extended disruptions to Hormuz transit would accelerate existing trends toward energy supply diversification and infrastructure resilience enhancement. Historical analysis suggests that major supply disruptions create lasting changes in energy trade patterns that persist beyond the immediate crisis period.
Global Chokepoint Vulnerability Mapping
Energy security analysts have identified multiple critical chokepoints where similar disruptions could occur:
| Chokepoint | Annual Oil Transit | Global Trade Percentage |
|---|---|---|
| Strait of Hormuz | 900 million barrels | 21% |
| Suez Canal/Sumed Pipeline | 450 million barrels | 9% |
| Strait of Malacca | 400 million barrels | 8% |
| Panama Canal | 200 million barrels | 5% |
This concentration of global energy flows through limited geographic corridors creates systemic vulnerability that extends beyond any single regional conflict. Strategic planners across major economies are developing redundant routing capabilities to reduce dependence on individual chokepoints.
Regional Power Balance Implications
Iran's capacity to sustain complete strait closure remains limited due to economic and political constraints. Iranian petroleum exports of approximately 1.5-2.0 million barrels per day depend entirely on Hormuz transit, creating economic self-damage from any extended closure. Additionally, historical analysis suggests 80-90% probability of international military response within 2-3 weeks of sustained blockade attempts.
Saudi Arabia and the UAE benefit from market share expansion opportunities during supply disruption periods, as their spare production capacity becomes increasingly valuable. These producers can typically expand output by 2-3 million barrels per day within 30-90 days, partially offsetting closure-related supply losses while capturing premium pricing.
Consequently, Russia's position as an alternative energy supplier to both Europe and Asia strengthens during Middle Eastern supply disruptions, as overland pipeline routes become more strategically valuable relative to maritime shipping alternatives.
According to BBC's reporting on the current regional tensions, the geopolitical implications extend far beyond immediate energy markets.
The next major ASX story will hit our subscribers first
Energy Transition Acceleration Dynamics
Supply security crises historically accelerate adoption of alternative energy sources and efficiency technologies. The oil shocks of the 1970s catalysed renewable energy research and nuclear power expansion, while recent geopolitical tensions have driven increased investment in solar, wind, and battery storage technologies.
Renewable Energy Investment Surge Scenarios
Extended fossil fuel supply disruptions typically trigger emergency renewable capacity deployment across major economies. Key acceleration patterns include:
• Solar installation timelines compressed from 12-18 months to 6-9 months through regulatory streamlining
• Wind project development prioritised through expedited permitting and grid connection processes
• Battery storage deployment accelerated to support grid stability during transition periods
• Energy efficiency measures implemented across industrial and commercial sectors to reduce total demand
However, renewable energy infrastructure cannot compensate for petroleum supply disruptions in transportation and petrochemical sectors, which require liquid fuels or substantial industrial process modifications.
Energy Independence Policy Recalibration
Major consuming nations typically respond to supply crises by revising national energy security strategies toward greater domestic production and supply diversification. Historical patterns suggest:
• Strategic reserve expansion to provide longer buffer periods during future disruptions
• Domestic production incentives for oil, gas, and renewable energy sources
• Infrastructure investment in alternative transportation corridors and energy storage capacity
• International cooperation agreements for emergency supply sharing during crisis periods
Furthermore, the energy transition challenges facing major economies become more urgent during supply security crises, accelerating policy implementation timelines.
Resolution Pathway Analysis
Energy market participants and policy makers maintain contingency planning for multiple resolution scenarios, each with different timelines and market implications. Historical precedent suggests most maritime chokepoint crises resolve within weeks rather than months due to economic and political pressures on all participants.
What Are the Diplomatic De-escalation Frameworks?
Scenario A: Ceasefire Enforcement Through International Mediation
International coalition coordination through United Nations and regional security frameworks typically provides the most sustainable resolution path. This approach requires:
• Coordinated diplomatic pressure from major powers including the United States, European Union, and China
• Economic incentives for all parties to resume normal commercial operations
• Security guarantees that address underlying regional tensions beyond the immediate crisis
Scenario B: Partial Reopening With Conditional Access
Limited transit resumption under Iranian oversight conditions represents a compromise solution that:
• Allows face-saving measures for Iranian leadership while restoring most commercial flows
• Requires international monitoring mechanisms to ensure consistent access
• Creates ongoing uncertainty that maintains elevated energy prices above pre-crisis levels
Scenario C: Multilateral Security Guarantee Framework
Long-term resolution through enhanced maritime security cooperation including:
• International naval coordination to ensure freedom of navigation
• Economic development assistance to reduce regional tensions
• Infrastructure investment in alternative transportation corridors to reduce future chokepoint dependency
Corporate Risk Management Strategies
Energy-intensive industries maintain sophisticated risk management protocols for supply disruption scenarios, though the effectiveness of these strategies depends on disruption duration and severity.
Emergency Procurement Frameworks
Critical industries facing energy supply disruption must activate alternative sourcing strategies within 48-72 hours to maintain operational continuity while minimising cost impacts
Successful corporate energy security planning typically includes:
• Diversified supplier relationships across multiple geographic regions and transportation routes
• Inventory management protocols that increase strategic reserves during elevated geopolitical risk periods
• Price hedging mechanisms including futures contracts and options strategies to limit volatility exposure
• Production flexibility systems that enable temporary demand reduction or alternative feedstock utilisation
Supply Chain Resilience Enhancement
Manufacturing and logistics companies implement multi-tier supply chain modifications during energy crises:
• Modal transportation shifts from energy-intensive shipping and trucking toward rail and pipeline alternatives where available
• Regional sourcing adjustments to minimise transportation distances and energy requirements
• Inventory positioning optimisation to reduce just-in-time vulnerability during supply chain disruptions
• Customer communication protocols to manage delivery expectations and pricing adjustments
How Do Economic Impacts Vary Across Industries?
Different economic sectors experience varying degrees of impact from energy supply disruptions, with transportation and energy-intensive manufacturing facing the most immediate pressure while service sectors typically experience delayed and indirect effects.
Transportation Sector Disruption Timeline
| Industry Segment | Week 1-2 | Week 3-4 | Month 2+ |
|---|---|---|---|
| Aviation | 15% fuel cost increase | Route optimisation | Fleet efficiency upgrades |
| Maritime Shipping | 25% bunker fuel surcharge | Alternative routing protocols | Modal shift acceleration |
| Ground Transportation | Regional price variations | Supply allocation management | Alternative fuel adoption |
| Manufacturing | Inventory utilisation | Production schedule adjustment | Supply chain redesign |
Aviation and shipping industries face immediate cost pressures as fuel represents 25-35% of operating expenses for airlines and 50-60% for shipping companies. These sectors typically implement fuel surcharges within days of supply disruptions while developing medium-term efficiency improvements.
Financial Market Volatility Patterns
Energy supply crises create predictable patterns across financial markets:
• Energy sector equities typically gain 15-25% during the initial weeks of supply disruption as pricing power increases
• Transportation and manufacturing stocks decline 10-20% due to increased operating costs and margin pressure
• Currency markets reflect trade balance impacts, with oil-importing nations experiencing 2-5% depreciation against major reserve currencies
• Commodity futures markets show volatility spikes with trading volumes increasing 40-60% during crisis periods
However, the trade war impact on oil markets demonstrates that Iran Strait of Hormuz closure effects can compound with other geopolitical tensions, creating more complex market dynamics.
Infrastructure Resilience and Future Security Architecture
Long-term energy security requires systematic infrastructure development that reduces dependence on individual chokepoints while maintaining economic efficiency. Strategic planning across major economies increasingly focuses on redundancy and diversification rather than cost optimisation alone.
Alternative Corridor Development Priorities
Infrastructure investment priorities emerging from chokepoint vulnerability analysis include:
• Trans-continental pipeline systems that bypass maritime chokepoints entirely
• Strategic petroleum reserve expansion to provide longer buffer capacity during extended disruptions
• Port capacity enhancement at alternative locations to handle rerouted shipping traffic
• Renewable energy acceleration to reduce overall petroleum dependency across transportation and industrial sectors
International Cooperation Framework Evolution
Energy security cooperation among major economies continues evolving toward more sophisticated coordination mechanisms:
• Shared strategic reserve management allowing coordinated releases during supply crises
• Emergency supply sharing agreements that automatically activate during predetermined trigger events
• Maritime security partnerships combining naval resources from multiple nations for chokepoint protection
• Infrastructure investment coordination to ensure alternative routes develop sufficient capacity for crisis periods
These developments suggest that while individual chokepoint closures create significant short-term disruptions, the global energy system continues adapting toward greater resilience and reduced vulnerability to single-point failures. However, this adaptation process requires sustained investment and international cooperation that extends beyond immediate crisis response mechanisms.
Disclaimer: This analysis represents strategic scenario modelling based on historical precedents and established energy market dynamics. Actual outcomes during any specific crisis will depend on numerous variables including duration, international response coordination, and concurrent global economic conditions. Readers should consult current market data and professional analysis for investment or strategic planning decisions.
Looking to Capitalise on Energy Security Opportunities?
Discovery Alert's proprietary Discovery IQ model delivers real-time alerts on significant energy and resource discoveries across the ASX, empowering subscribers to identify actionable opportunities ahead of broader market recognition. During periods of global energy uncertainty, understanding which companies hold strategic mineral resources becomes increasingly critical for informed investment decisions. Begin your 14-day free trial today and secure your market-leading advantage in the evolving energy landscape.