July 21, 2026
Strategic Maritime Vulnerabilities Reshape Energy Security Architecture
The modern energy system's exposure to single-point-of-failure scenarios has reached unprecedented levels of complexity. Strategic planners now recognise that current global distribution networks contain inherent weaknesses that extend far beyond traditional petroleum markets, creating cascading risks across multiple commodity sectors simultaneously.
When examining global oil supply chains Iran conflict dynamics, the interconnected nature of energy infrastructure becomes starkly apparent. Maritime chokepoints, integrated production facilities, and cross-border pipeline networks create vulnerability matrices that can trigger system-wide disruptions affecting everything from semiconductor manufacturing to agricultural production.
When big ASX news breaks, our subscribers know first
Critical Infrastructure Weaknesses Exposed by Regional Tensions
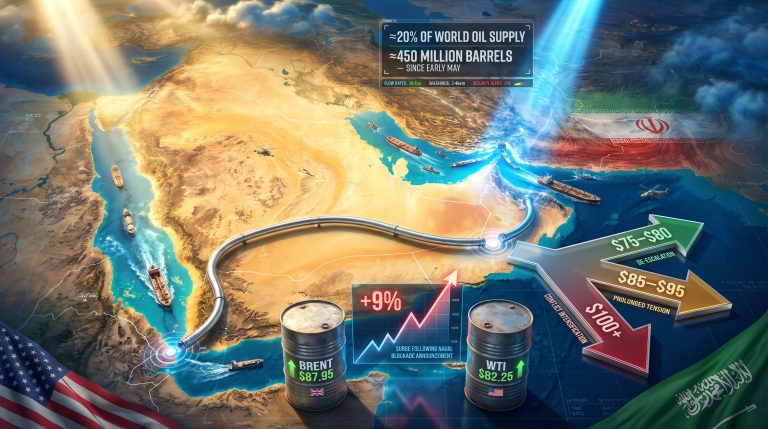
The Strait of Hormuz handles approximately 20-21 million barrels per day, representing roughly 20-22% of global petroleum traded by sea. Furthermore, this single waterway's strategic importance cannot be overstated, as its closure would immediately affect global energy security architecture.
Key vulnerability indicators include:
- Maritime chokepoint dependencies affecting over 20 million barrels daily
- Integrated LNG-helium production facilities creating multi-commodity exposure
- Cross-border pipeline networks vulnerable to regional escalation
- Limited storage capacity during extended supply disruptions
Beyond the Strait of Hormuz, additional maritime chokepoints compound systemic risks. The Strait of Malacca handles 25-30 million barrels per day, while the Suez Canal processes approximately 3-4 million barrels daily of oil alongside 12% of global maritime trade.
Qatar's integrated facilities exemplify multi-commodity vulnerability. The Ras Laffan Industrial City combines LNG production of 77 million tons annually with helium extraction operations. Qatar produces approximately 1.3 billion cubic feet of helium per year, representing 28% of global helium supply. Consequently, a single facility disruption affects multiple commodity streams globally, from energy markets to semiconductor production requiring helium cooling systems.
Storage infrastructure limitations compound these vulnerabilities. Global crude oil storage capacity totals approximately 1.6-1.7 billion barrels, with strategic reserves varying significantly by nation. The U.S. Strategic Petroleum Reserve holds roughly 370 million barrels, while International Energy Agency member countries maintain 1.5 billion barrels in strategic reserves.
Alternative Distribution Networks Gaining Strategic Priority
Energy companies are rapidly reconfiguring distribution networks to bypass traditional Middle Eastern corridors. This represents the most significant supply chain restructuring since the 1970s oil crises, with permanent implications for global oil supply chains Iran conflict scenarios.
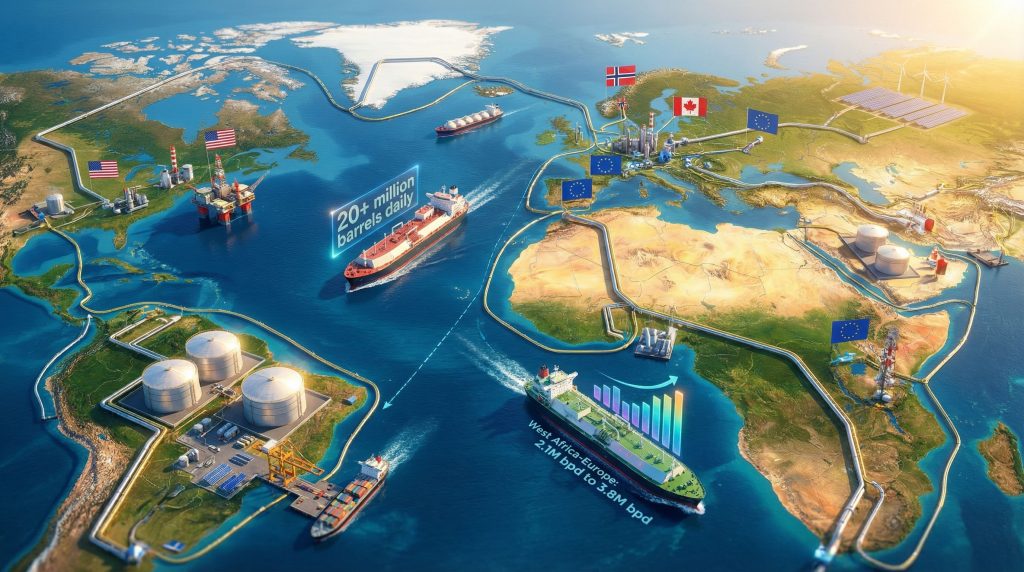
West African Export Route Expansion
West African producers are positioning themselves as primary alternatives to Middle Eastern suppliers. Current export capacity from West Africa to Europe reaches 2.5-2.8 million barrels per day, with significant expansion potential.
Production capacity breakdown:
- Angola: 1.0-1.1 million bpd (2024)
- Nigeria: 1.2-1.5 million bpd (facing production challenges)
- Congo (DRC): 0.2-0.3 million bpd
Angola aims to reach 1.8 million barrels per day by 2028 under new oil licensing rounds, though production recovery faces multi-year timelines due to underinvestment and technical challenges. However, Nigeria's production has declined from pre-2020 levels of 1.7 million barrels per day due to infrastructure deterioration and security concerns.
North American Production Surge Dynamics
The Permian Basin currently produces 5.5-5.9 million barrels per day, with realistic growth projections reaching 6.2-6.8 million barrels per day by 2027. This represents 12-15% growth, constrained by infrastructure limitations and regulatory timelines rather than geological factors. Understanding US drilling trends provides valuable insight into production capabilities.
U.S. LNG export capacity reached 9.3 billion cubic feet per day as of 2024, with multiple expansion projects in development. Golden Pass, Venture Global Calcasieu Pass, and other facilities will add significant capacity over 2-4 year timeframes.
Trans-Asian Pipeline Capacity Realities
The China-Central Asia pipeline system demonstrates mixed expansion potential. The Central Asia-China Gas Pipeline operates at 55 billion cubic meters annually, while the Central Asia-China Oil Pipeline maintains 200,000 barrels per day capacity. Current utilisation rates of 65-70% suggest expansion possibilities limited by Central Asian production capacity from Kazakhstan and Turkmenistan.
The East Siberia Pacific Ocean (ESPO) pipeline currently delivers 1.5-1.6 million barrels per day to China, representing maximum operational capacity rather than the higher figures suggested in some strategic projections.
Regional Energy Security Framework Evolution
European Union Strategic Adaptation
EU member states maintain 270-300 million barrels in combined strategic petroleum reserves, supporting approximately 20-22 days of consumption at current daily usage of 13-14 million barrels. Historical release protocols typically cover 30-60 days of cumulative daily consumption during emergency scenarios.
European renewable capacity additions reached 50 GW of wind and 30 GW of solar in 2023. The proposed EU Energy Transition Acceleration Fund targets €300 billion for energy security investments, building on €1.4 trillion in cumulative Green Taxonomy investments from 2020-2024. Moreover, the comprehensive energy security outlook demonstrates the strategic importance of diversification efforts.
Timeline assessment: Complete Middle Eastern energy independence by 2035 appears unrealistic given current infrastructure. The EU imports 5-8% of crude oil and 20-30% of natural gas from Middle Eastern sources. A more achievable target involves reducing Middle Eastern energy dependency below 10% by 2040 through coordinated infrastructure investments.
Asia-Pacific Diversification Strategies
Japan's LNG import diversification reflects strategic rebalancing. Current import breakdown shows Qatar supplying 30-35%, Australia 30-35%, and other sources 30-40%. Japan maintains strategic petroleum reserves of 340 million barrels while actively reducing single-supplier dependency.
China's strategic petroleum reserves reached 570-600 million barrels capacity as of 2024, with expansion targeting 1 billion barrel capacity by 2030. Overland imports from Russia via ESPO and Central Asian pipelines deliver 1.0-1.2 million barrels per day, representing successful diversification from maritime-dependent sources.
India's approach involves balancing relationships across multiple suppliers. Iranian crude imports currently range from 0-200,000 barrels per day depending on sanctions enforcement, down from historic levels of 600,000-700,000 barrels per day pre-2018. India now sources from Saudi Arabia, Iraq, UAE, Brazil, Mexico, and Angola.
Economic Impact Distribution Across Energy Value Chains
Primary Beneficiaries
U.S. shale producers benefit from sustained oil prices above $90 per barrel, improving margins across Permian Basin operations. Norwegian energy companies enhance their European market position through proximity advantages and existing infrastructure connections. The oil price rally analysis illustrates how geopolitical tensions can create sustained price advantages.
Canadian oil sands operations experience improved economics despite higher production costs, as price premiums offset operational challenges. Shipping companies command premium rates for alternative route navigation, particularly vessels capable of Arctic or extended African route operations.
Sectors Under Pressure
European manufacturing faces input cost increases affecting global competitiveness. Asian petrochemical producers experience feedstock cost inflation, squeezing margins across downstream operations. The broader trade war implications compound these challenges across global markets.
Global airlines confront fuel cost increases threatening route profitability, particularly long-haul operations with higher fuel consumption ratios. Emerging market importers face foreign exchange pressure as energy bills consume larger portions of foreign currency reserves.
Multi-Commodity Market Interconnections
Global oil supply chains Iran conflict scenarios extend beyond petroleum into interconnected commodity markets. Helium prices increased approximately 40% due to Gulf region supply constraints, affecting semiconductor production requiring helium cooling systems. Additionally, supply chain disruptions create cascading effects across multiple industries.
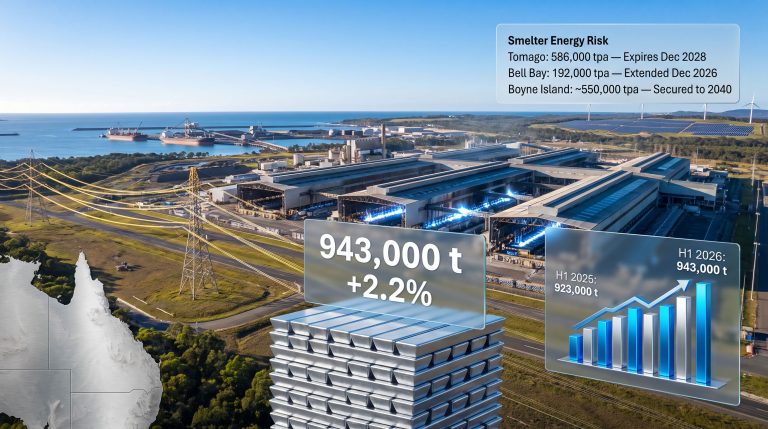
Fertiliser supply chains experience disruption during critical agricultural planting seasons, as natural gas feedstock costs rise. Aluminium production faces constraints from Gulf region supply limitations, affecting manufacturing sectors dependent on lightweight metals.
Petrochemical feedstock costs create downstream product inflation across plastics, synthetic materials, and chemical processing industries. Furthermore, the oil price trade dynamics demonstrate how commodity interconnections amplify market volatility.
The next major ASX story will hit our subscribers first
Strategic Reserve Capacity and Market Absorption
Global markets can theoretically withstand 90-120 days of complete Middle Eastern supply loss through strategic reserve releases and emergency production increases. Extended disruptions beyond 120 days would trigger fundamental market restructuring.
| Duration | Market Response | Price Impact | Strategic Implications |
|---|---|---|---|
| 30-60 days | Strategic reserve releases | $85-95/barrel | Manageable with existing buffers |
| 60-120 days | Emergency production increases | $95-110/barrel | Strain on spare capacity |
| 120+ days | Permanent supply reallocation | $110+/barrel | Structural market transformation |
Investment Themes Emerging from Supply Chain Disruption
Energy security-focused infrastructure development represents the primary investment opportunity. Grid-scale battery and hydrogen storage systems address intermittency challenges as renewable capacity expands.
Alternative transportation fuels gain priority, particularly sustainable aviation and marine fuels reducing dependency on traditional petroleum products. Supply chain analytics platforms utilising AI-powered disruption prediction systems become essential for strategic planning.
Strategic asset classes include:
- Energy security-focused infrastructure funds
- Alternative energy corridor development projects
- Strategic commodity storage facilities
- Supply chain resilience technology platforms
Regional energy infrastructure emphasising distributed generation and microgrids reduces dependency on centralised systems vulnerable to chokepoint disruption.
Scenario Planning for Supply Chain Normalisation
Diplomatic Resolution Pathway (35% probability)
Multilateral negotiation frameworks could restore normal operations within 6-12 months. Market impacts would involve gradual price normalisation to $70-80 per barrel as alternative supply routes integrate with restored traditional channels.
Military Stalemate Scenario (45% probability)
Continued chokepoint disruption lasting 12-24 months would accelerate workaround development. Sustained elevated pricing accompanies new supply route establishment, creating permanent shifts in global energy trade patterns.
Escalation Framework (20% probability)
Indefinite Middle Eastern supply reduction would trigger comprehensive energy system restructuring. Fundamental changes to global oil supply chains Iran conflict dynamics would reshape geopolitical energy relationships permanently.
Alternative energy corridor development becomes critical infrastructure under all scenarios. Investment in supply chain resilience technologies, strategic commodity storage expansion, and regional energy security frameworks represents essential preparation for an increasingly complex energy security environment.
This analysis is based on publicly available data and strategic scenario modelling. Energy market projections involve inherent uncertainties, and actual outcomes may vary significantly from scenario assessments. Readers should conduct independent research before making investment decisions.
Ready to Position Yourself Ahead of Market-Shifting Commodity Discoveries?
Discovery Alert's proprietary Discovery IQ model delivers real-time notifications on significant ASX mineral discoveries, instantly identifying actionable opportunities as supply chain disruptions create heightened demand for critical resources. Explore historic examples of exceptional market returns from major mineral discoveries, then begin your 14-day free trial today to secure your market-leading advantage in an increasingly volatile commodity landscape.