
June 6, 2026
Understanding Strategic Petroleum Reserve Operations in Modern Markets
Energy security frameworks have evolved dramatically as global supply chains face unprecedented challenges. Modern petroleum inventory management operates within a complex web of federal policy directives, market volatility concerns, and long-term economic preparedness strategies. Unlike traditional commodity storage, strategic petroleum reserves function as both economic stabilizers and national security assets.
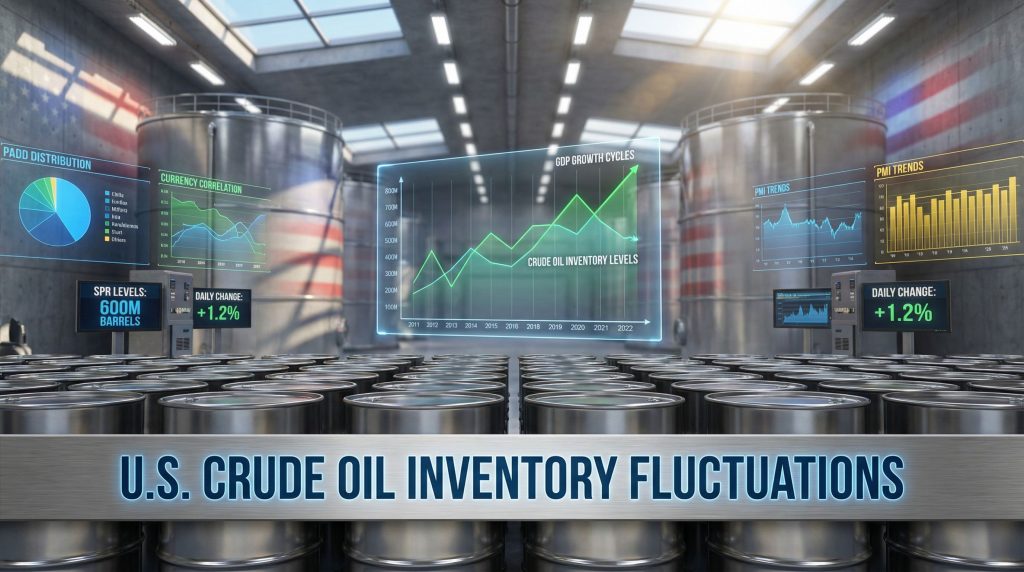
Federal energy policy increasingly recognises inventory levels as early-warning indicators for broader economic vulnerabilities. When U.S. crude oil inventories decrease by significant margins, as demonstrated by recent EIA data showing a 3.5 million barrel drawdown bringing total stocks to 420.3 million barrels, market participants interpret these movements through multiple analytical frameworks simultaneously.
Commercial stockpiling behaviour reflects sophisticated risk management approaches that balance storage costs against supply disruption probabilities. The current inventory level sits 4% below the five-year average, creating a technical threshold that historically triggers heightened monitoring across energy security agencies. Furthermore, this decline aligns with broader oil price rally insights that examine similar market dynamics.
Strategic reserve utilisation patterns demonstrate clear correlations with macroeconomic stress indicators. Government-directed inventory releases typically occur when commercial inventories fall below 5% of historical averages, though geopolitical circumstances can override these predetermined thresholds. This dual-trigger system creates layered protection against both market-driven and politically-motivated supply disruptions.
Historical analysis reveals that inventory drawdowns correlate with GDP growth cycles through demand-side mechanisms rather than supply constraints. During periods of economic expansion, industrial activity increases petroleum consumption faster than production capacity adjustments can accommodate, creating natural inventory declines that signal healthy economic momentum.
When big ASX news breaks, our subscribers know first
Market Psychology Driving Energy Price Discovery
Weekly petroleum inventory reports function as the primary market-clearing mechanism for futures pricing because they provide quantifiable data on fundamental supply-demand imbalances. The recent variance between API preliminary estimates (11.1 million barrel decline) and final EIA confirmation (3.5 million barrel decrease) illustrates how information asymmetries create trading opportunities in energy markets.
Algorithmic trading systems incorporate EIA release timing into their execution frameworks, typically producing 1-3% intraday volatility in crude futures contracts. When actual inventory changes exceed analyst expectations by greater than 50% (as occurred with the expected 2 million versus actual 3.5 million barrel decline), price impact coefficients increase measurably across the entire futures curve.
Recent price responses demonstrate the complexity of modern energy markets. Despite the bullish inventory data, Brent crude gained only $0.32 (+0.48%) to $67.65/barrel, while WTI increased $0.24 (+0.38%) to $63.45/barrel. However, week-over-week performance showed Brent down $0.45/barrel, suggesting broader macroeconomic concerns outweighed isolated inventory fundamentals. This aligns with comprehensive oil price movements analysis examining similar market patterns.
Cross-Asset Correlation Mechanisms
Energy inventory fluctuations influence currency markets through multiple transmission channels. Crude oil inventory declines theoretically reduce net U.S. energy import requirements, improving the external balance position and creating moderate negative pressure on the U.S. Dollar Index (DXY). However, this relationship exhibits significant time-variation depending on whether inventory movements reflect demand destruction versus supply constraints.
Key correlation patterns include:
• GDP Growth: Strong positive correlation with 3-6 month lead times
• Manufacturing PMI: Very strong correlation within 2-4 weeks
• Consumer Confidence: Moderate positive correlation over 1-3 months
• Dollar Index: Moderate negative correlation within 1-2 weeks
Sector rotation patterns emerge when inventory levels signal economic transitions. Declining inventories suggesting strong demand favour cyclical sectors (industrials, consumer discretionary, transportation) while simultaneously pressuring defensive sectors. Conversely, rising inventories indicate demand weakness and favour bond proxies and utilities.
Options markets typically experience 15-25% volatility expansion in the 15 minutes surrounding EIA data releases, as market makers adjust implied volatility surfaces based on fundamental data surprises. Geographic basis spreads between regional delivery points also adjust, with Midland WTI versus Cushing differentials reflecting inventory distribution changes across PAD regions.
Regional Economic Geography Through Inventory Distribution
The Petroleum Administration for Defense (PAD) district system divides energy infrastructure analysis into five regions, each reflecting distinct economic characteristics and demand patterns. PADD III (Gulf Coast) contains approximately 46% of U.S. atmospheric distillation capacity (roughly 5.8 million barrels daily of total 17.9 million barrel/day capacity), making it the dominant crude inventory hub for North American trade.
Regional inventory distributions reveal both structural economic characteristics and cyclical demand patterns. Gulf Coast refining concentration creates the region as the primary crude inventory hub, while Midwest and East Coast regional stockpiles track local demand patterns and transportation logistics more closely. In addition, these patterns often reflect OPEC production impact on global supply chains.
Agricultural Demand Patterns in Midwest Operations
Recent EIA data shows middle distillates inventories decreased by 5.6 million barrels, with production declining 5,000 barrels daily to 4.8 million barrels daily. Four-week average distillate demand totalled 4.0 million barrels, representing a 6.2% year-over-year decline that reflects both seasonal patterns and agricultural sector dynamics.
Agricultural sector diesel demand exhibits bimodal seasonal characteristics distinct from residential heating oil patterns:
• Spring planting season (March-April): Peak diesel demand for machinery operations
• Fall harvesting period (September-October): Secondary peak for crop processing equipment
• Winter heating demand (November-February): Overlapping residential/commercial heating oil consumption
This complex demand structure requires sophisticated inventory management strategies that balance overlapping seasonal cycles while maintaining adequate strategic reserves for emergency situations.
Consumer Behaviour Indicators Through Fuel Demand Analysis
Total products supplied, serving as a proxy for U.S. oil demand, rose to 20.8 million barrels per day over the recent four-week period, up 0.9% compared to the same period last year. This modest increase reflects evolving consumption patterns influenced by remote work trends and industrial activity levels.
Gasoline demand averaged 8.3 million barrels per day over the four-week measurement period, while distillate four-week average supplied averaged 4.0 million barrels. The 6.2% year-over-year decline in distillate consumption provides insights into commercial transportation demand and industrial activity indicators. Consequently, these trends may relate to the broader US oil production decline affecting domestic supply dynamics.
Demand elasticity patterns reveal how economic activity translates into petroleum consumption. Work-from-home trends continue affecting transportation fuel demand structures, while industrial sector requirements for heating oil and diesel provide real-time indicators of manufacturing confidence levels.
Regional Economic Health Metrics
State-by-state fuel consumption patterns function as leading economic indicators, particularly when analysed alongside employment data and industrial production statistics. Commercial transportation demand reflects supply chain velocity, while agricultural sector fuel needs indicate rural economic conditions and crop production cycles.
Transportation cost differentials affecting regional price discovery include:
• Pipeline capacity constraints limiting inter-regional distribution efficiency
• Storage facility utilisation rates indicating regional supply adequacy
• Refinery maintenance scheduling patterns reflecting capital investment cycles
• Product yield optimisation indicating technological advancement adoption
Industrial Health Signals from Refinery Operations
Recent inventory data shows gasoline inventories increased by 700,000 barrels following a previous week's gain of 200,000 barrels, while average daily gasoline production decreased to 9.0 million barrels. This production-inventory divergence suggests refinery operators are managing capacity utilisation in response to demand patterns rather than maintaining maximum throughput.
Refinery capacity utilisation rates correlate with manufacturing sector confidence through multiple channels. When refineries operate below optimal efficiency, it often indicates either weak demand forecasts or planned maintenance activities that reflect longer-term capital investment cycles.
Product yield optimisation strategies indicate technological advancement adoption across the refining sector. Modern refineries adjust their processing configurations to maximise higher-value products while minimising less profitable outputs, creating efficiency gains that support regional economic development.
Employment and Regional Development Impacts
Refining sector job creation generates significant multiplier effects on local economies, particularly in Gulf Coast regions where petroleum processing concentrates. Skills development requirements in evolving energy processing industries create workforce development opportunities that extend beyond direct employment.
Community economic dependency on energy infrastructure operations creates vulnerability to operational changes but also provides stability during economic downturns when energy demand remains relatively inelastic compared to discretionary spending categories.
Trade Balance Dynamics Through Import-Export Flows
U.S. energy export capacity contributes measurably to trade deficit reduction through multiple mechanisms. Domestic production increases enable import substitution while simultaneously creating export revenue streams that improve the overall external balance position.
Strategic alliance implications of energy trade relationships extend beyond economic considerations into geopolitical frameworks. Countries receiving U.S. petroleum exports develop economic interdependencies that support broader diplomatic objectives while reducing their reliance on potentially unstable suppliers.
Currency and monetary policy connections include:
• Petrodollar recycling patterns affecting international monetary flows
• Federal Reserve policy considerations related to energy price stability and inflation expectations
• Exchange rate impacts on energy import costs and consumer price indices
The next major ASX story will hit our subscribers first
Economic Recession Indicators Through Inventory Cycles
Historical correlation analysis reveals that inventory builds often precede broader economic slowdowns, as reduced industrial demand creates unplanned stockpile accumulation. The current 3.5 million barrel decrease occurring during winter demand season suggests continued economic activity rather than demand destruction patterns.
Supply chain stress indicators reflected in storage facility utilisation provide early warning signals for broader economic contractions. When inventories decline faster than seasonal patterns predict, it typically indicates either supply disruptions or stronger-than-expected industrial demand. However, these patterns must be considered alongside oil price stagnation analysis to understand complete market dynamics.
Government intervention thresholds based on inventory level triggers create predictable policy response mechanisms. Emergency reserve release criteria typically activate when commercial inventories fall below specific percentiles of historical averages, providing automatic stabilisation mechanisms during crisis periods.
Policy Response Coordination
Coordination between energy policy and broader fiscal stimulus measures ensures that petroleum market interventions align with macroeconomic objectives. Strategic reserve releases often coincide with other economic support measures to maximise their stabilising effects across multiple sectors simultaneously.
Investment strategy implications include:
• Portfolio allocation considerations based on inventory cycle positioning
• Currency hedging strategies for energy-dependent economies
• Commodity exposure timing based on storage capacity utilisation rates
• Volatility forecasting using inventory deviation metrics
Long-Term Investment Themes from Inventory Trends
Infrastructure development opportunities emerge from analysing long-term inventory management requirements. Storage capacity expansion needs driven by production growth create investment opportunities in both traditional petroleum storage and emerging alternative fuel storage systems.
Technology modernisation requirements in inventory management systems reflect broader digitalisation trends affecting energy infrastructure. Advanced monitoring systems, predictive analytics, and automated trading platforms require ongoing capital investment to maintain competitive advantages.
Energy Transition Economic Implications
Stranded asset risks in traditional storage infrastructure must be evaluated against transition timelines for alternative energy systems. While petroleum storage remains essential for decades, investment decisions must consider changing fuel mix requirements and grid stability needs.
Alternative fuel storage requirements create capital allocation shifts that affect traditional petroleum infrastructure investments. Hydrogen storage, battery systems, and renewable fuel processing facilities require different technical specifications and geographic distributions than conventional petroleum storage.
Risk management framework considerations:
• Geopolitical risk assessment incorporating strategic reserve levels
• Supply chain resilience evaluation through regional inventory analysis
• Market regime analysis identifying periods where inventory changes fail to produce expected price responses
Market Intelligence for Investment Decision-Making
The recent disconnect between API estimates and EIA confirmation demonstrates the importance of understanding petroleum accounting methodologies. The Weekly Petroleum Supply Reporting System (WPSRS) collects data through standardised protocols, but timing differences between preliminary and final reports create information arbitrage opportunities.
Lead times between data collection, preliminary reporting, and final confirmation typically span 24-48 hours, creating windows where sophisticated traders can position themselves ahead of official announcements. Furthermore, crude oil inventories data provides additional context for understanding these timing mechanisms and their competitive advantages in energy market participation.
Regional breakdowns following PAD district classifications enable targeted investment strategies based on geographic factors affecting energy infrastructure. Transportation network upgrades supporting efficient distribution create investment opportunities in pipeline capacity, storage facilities, and processing equipment.
Price transmission mechanisms typically operate within 2-4 weeks from inventory changes to consumer price impacts, with regional variations based on distribution infrastructure efficiency and local market competition dynamics. This predictable timing enables strategic positioning across energy value chains.
The evolving relationship between U.S. crude oil inventories decrease patterns and broader economic indicators provides ongoing opportunities for sophisticated market participants who understand the complex interconnections between energy markets and macroeconomic performance.
Disclaimer: This analysis is for informational purposes only and does not constitute investment advice. Energy markets involve substantial risks, and past performance does not guarantee future results. Readers should conduct their own research and consult qualified professionals before making investment decisions.
Looking for Strategic Commodity Investment Opportunities?
Discovery Alert's proprietary Discovery IQ model delivers real-time alerts on significant ASX mineral discoveries, empowering investors to identify actionable opportunities in strategic commodities before broader market recognition. Begin your 14-day free trial at Discovery Alert today and gain the market-leading advantage needed for informed commodity investment decisions.