
July 27, 2026
Strategic Vulnerability Framework: Understanding Market Concentration Risks
The global aluminum industry faces unprecedented challenges as aluminum in crisis war tariffs and a market running on empty converge to create systemic vulnerabilities. Modern aluminum markets operate under extraordinary concentration dynamics that extend far beyond traditional commodity price fluctuations. The industry's geographic clustering around energy-advantaged regions, combined with just-in-time inventory management practices, has created a perfect storm scenario.
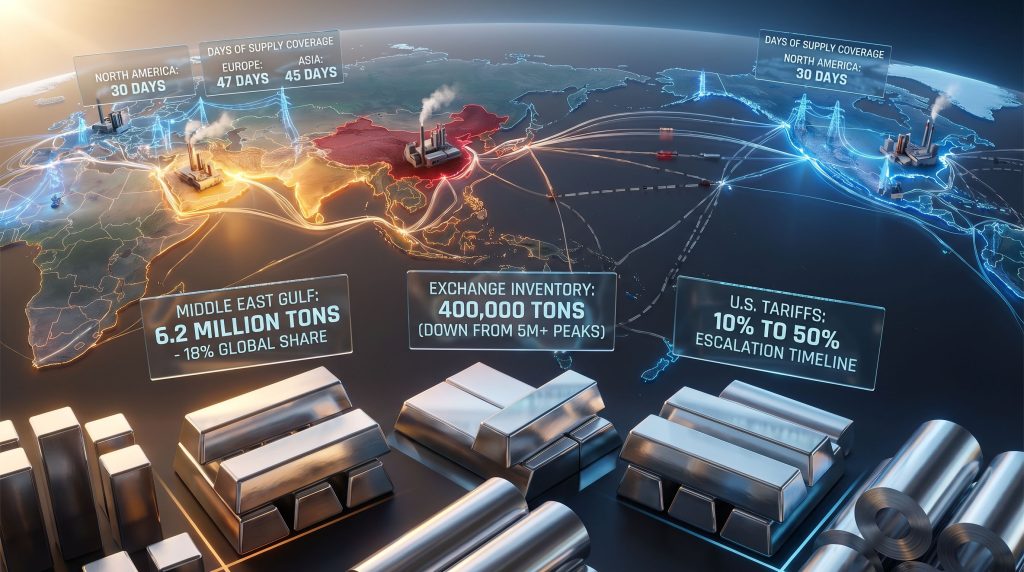
Geographic production concentration represents the primary risk factor driving market instability. With China controlling 57% of global annual capacity at 39.8 million tons and the Middle East Gulf region accounting for 18% at 6.2 million tons, approximately three-quarters of world aluminum production originates from regions subject to geopolitical tensions or trade policy restrictions.
Energy dependency creates the second critical vulnerability layer. Aluminum smelting requires approximately 13,000-15,000 kWh per ton through electrolytic processes that cannot be interrupted without permanent facility damage. Furthermore, a typical smelter consumes power equivalent to a Boston-sized city, making energy availability and pricing the determining factor in production economics.
Critical Vulnerability Indicators:
• Production Geography: 75% of capacity concentrated in politically sensitive regions
• Energy Intensity: Boston-equivalent power consumption per facility
• Inventory Buffers: 92% decline in London Metal Exchange stocks from historical peaks
• Substitution Barriers: Limited alternatives for aerospace and automotive applications
The inventory depletion crisis exemplifies market fragility. London Metal Exchange stocks have collapsed from over 5 million tons in the early 2010s to under 400,000 tons currently, while Chicago Mercantile Exchange deliverable stocks total just 1,864 tons following a 70% year-to-date decline. These levels provide approximately 30 days of consumption coverage, well below the 60-90 day safety margins considered prudent.
Strategic Supply Chain Fragility Matrix:
| Risk Factor | Historical Norm | Current Status | Crisis Threshold |
|---|---|---|---|
| Exchange Inventory | 5M+ tons | 400,000 tons | <200,000 tons |
| Days Coverage | 60-90 days | 30 days | <15 days |
| Price Volatility | ±15% annually | ±40% monthly | >50% monthly |
| Geographic Risk | Distributed | 75% concentrated | >80% concentrated |
Transportation bottlenecks compound production concentration risks. The Strait of Hormuz handles approximately 20% of global aluminum trade, creating a single chokepoint for Middle Eastern exports to Western markets. Additionally, when shipping constraints occur, remaining global capacity cannot economically compensate due to energy cost differentials.
When big ASX news breaks, our subscribers know first
Regional Production Dynamics and Strategic Dependencies
Middle Eastern aluminum production represents far more than its 18% global capacity share suggests. The region specialises in high-purity primary aluminum and aerospace-grade alloys that cannot be substituted with commodity-grade Chinese production. Consequently, this specialisation creates strategic dependency relationships where Western manufacturers require Gulf region supplies regardless of price premiums.
Gulf Region Production Specifications:
• High-purity primary aluminum: Meeting AS9100 aerospace certification standards
• Specialised alloy production: Automotive crash structure applications
• Energy cost advantages: Natural gas access creating $200-400/ton production savings
• Strategic shipping position: Rapid access to European and North American markets
Current disruption evidence demonstrates the region's critical importance. Emirates Global Aluminium's Al Taweelah smelter sustained missile damage requiring up to one year for full production restoration. Moreover, Aluminium Bahrain, operating as the largest single-site production plant outside China, faces unknown damage extent following similar attacks.
Regional Capacity Analysis:
| Producer | Annual Capacity | Specialisation | Recovery Timeline |
|---|---|---|---|
| Emirates Global | 2.9M tons | Aerospace alloys | 12 months |
| Aluminium Bahrain | 1.5M tons | High-purity primary | Unknown |
| Qatar Aluminium | 0.7M tons | Automotive grades | 6-8 months |
The Strait of Hormuz shipping constraint creates dual vulnerability. Beyond production facility damage, remaining operational capacity faces raw material supply disruption as bauxite and alumina feedstock cannot reach Gulf smelters through traditional shipping corridors. This creates compound scarcity where both production capability and production input availability are simultaneously constrained.
Chinese production capacity, while representing 57% of global supply, operates primarily for domestic consumption and semi-finished product exports. In addition, China's aluminum industry focuses on downstream processing into wire, rod, and plate rather than primary aluminum ingot exports, meaning Chinese capacity cannot substitute for Gulf region high-purity primary metal requirements.
Strategic Production Distribution:
• China (39.8M tons): Domestic consumption focus, limited primary exports
• Middle East (6.2M tons): Export-oriented, high-specification products
• North America (4.1M tons): Regional self-sufficiency, 40% idle capacity
• Europe (3.8M tons): Import-dependent, 2.1M tons mothballed capacity
Geopolitical Risk Transmission Mechanisms
Current market disruption demonstrates how geopolitical events trigger cascading supply chain failures through multiple transmission mechanisms. The Iranian conflict has created immediate production shutdowns, shipping route closures, and inventory depletion patterns that compound over time rather than stabilising. This crisis exemplifies how aluminum in crisis war tariffs and a market running on empty create unprecedented market instability.
Immediate Impact Evidence (0-30 days):
The cash-to-three-month futures spread reached $95.50/ton backwardation, representing the tightest market conditions since the 2007 financial crisis. This extreme pricing structure indicates traders expect severe near-term physical aluminum scarcity regardless of longer-term supply recovery expectations.
LME inventory movements reveal crisis-level behaviour patterns. 98,000 tons of Indian aluminum were cancelled from exchange registry in the first week of March, then re-warranted the following week as time spreads deteriorated. This cancellation/re-warranty cycle demonstrates desperate physical procurement competition among market participants.
Crisis-Level Market Indicators:
• Backwardation Spread: $95.50/ton (tightest since 2007 financial crisis)
• Inventory Turnover: 98,000 tons cancelled and re-warranted within days
• Price Escalation: Four-year highs at $3,580/ton on LME
• Supply Deficit Projection: 4 million metric tons annually (Wood Mackenzie)
Medium-term consequences involve alternative supplier capacity constraints. North American idle capacity totaling 1.2 million tons requires 12-18 months for restart and faces energy cost barriers of $80-120/MWh. Similarly, European mothballed capacity of 2.1 million tons needs 18-24 months for restoration.
Mothballed Capacity Restart Analysis:
| Region | Idle Capacity | Restart Timeline | Energy Threshold | Economic Viability |
|---|---|---|---|---|
| North America | 1.2M tons | 12-18 months | $80-120/MWh | Marginal |
| Europe | 2.1M tons | 18-24 months | €90-130/MWh | Unlikely |
| Australia | 0.8M tons | 6-12 months | A$70-100/MWh | Conditional |
Russian aluminum complications add further constraint layers. 270,000 tons of Russian metal remain registered in LME inventory but are unavailable to Western buyers due to Ukraine-related sanctions. This represents approximately 68% of total LME registered stocks, effectively removing most exchange inventory from Western market access.
Trade Policy Amplification Effects
United States tariff escalation has transformed import economics beyond normal trade protection impacts. The progression from 10% baseline Section 232 tariffs to 50% under current policy creates imported ingot costs exceeding $2,500/ton above LME pricing. Furthermore, combined with LME prices at four-year highs of $3,580/ton, total US import costs exceed $6,080/ton.
Tariff Escalation Economic Impact:
| Tariff Level | Import Premium | Total Cost Impact | Manufacturing Response |
|---|---|---|---|
| 10% (2018-2022) | $200/ton | Manageable | Normal operations |
| 25% (2024-2025) | $600/ton | Moderate stress | Design optimisation |
| 50% (Current) | $2,500/ton | Severe constraint | Production reduction |
This tariff structure forces domestic manufacturers into impossible economic choices. Automotive producers requiring 180 kg aluminum per vehicle face cost increases of $450 per unit from tariff impacts alone. Meanwhile, aerospace manufacturers, with 75% aluminum content by weight, cannot absorb such cost escalation while maintaining competitive pricing.
Canadian aluminum exports face strategic redirection toward European markets to avoid US tariff barriers. This export diversion reduces North American aluminum availability precisely when regional self-sufficiency becomes critical for supply chain resilience. The US steel-aluminum tariffs create artificial scarcity in the continent best positioned for energy-secure production expansion.
Trade Diversion Consequences:
• Canadian Export Redirection: European market preference over US sales
• Asian Supplier Premiums: 40-60% markup for US delivery acceptance
• Domestic Utilisation: Increased capacity utilisation but insufficient scale
• Competitiveness Erosion: Long-term industrial disadvantage
Japanese manufacturers demonstrate adaptation patterns by returning to Russian aluminum supplies despite previous self-imposed sanctions following the 2022 Ukrainian invasion. This procurement strategy reflects the reality that speciality aluminum grades from Russian producers cannot be economically substituted from alternative sources.
Exchange Inventory Crisis and Market Function
Global aluminum inventories have reached critically low levels that threaten basic market functioning. London Metal Exchange stocks at 400,000 tons provide approximately 30 days of global consumption coverage, while historically stable markets maintained 60-90 day buffer levels. This represents a key indicator of aluminum in crisis war tariffs and a market running on empty.
Exchange Inventory Depletion Timeline:
| Period | LME Inventory | CME Inventory | Market Condition |
|---|---|---|---|
| Early 2010s | 5M+ tons | Abundant | Normal function |
| 2020-2023 | 2-3M tons | Adequate | Moderate stress |
| March 2026 | 400,000 tons | 1,864 tons | Crisis level |
The 1,864 tons remaining in CME warehouses represents less than half a day's North American consumption. This inventory level eliminates any buffering capacity for supply disruptions, forcing manufacturers into immediate production adjustments when procurement delays occur. Market volatility hedging becomes increasingly critical.
Off-warrant inventory of 100,000 tons at LME provides additional complexity. This metal sits in exchange-approved warehouses but lacks immediate delivery availability due to ownership or financing arrangements. However, during crisis periods, off-warrant metal often becomes available at premium pricing.
Critical Inventory Thresholds:
• Normal Function: 60-90 days consumption coverage
• Stress Warning: 30-45 days coverage
• Crisis Level: 15-30 days coverage
• System Failure: <15 days coverage
Current inventory depletion patterns indicate systematic market failure approaching. When coverage falls below 15 days, manufacturing sectors begin production shutdowns rather than inventory building due to procurement cost uncertainty. Consequently, this creates demand destruction that masks underlying supply inadequacy.
Energy Constraint Barriers to Production Recovery
Aluminum smelting represents one of the most energy-intensive industrial processes, creating absolute barriers to rapid capacity additions during supply crises. The electrolytic reduction process requires continuous power supply equivalent to 850,000 homes annually per typical facility, making energy availability the binding constraint on production expansion.
Power Consumption Technical Requirements:
• Electrolytic Process: 13,000-15,000 kWh per ton production
• Continuous Operation: No demand-shifting or load management possible
• Grid Stability: Voltage fluctuations cause permanent cell damage
• Restart Costs: $50-100 million per facility following extended shutdown
The Mozal aluminum smelter case study demonstrates energy constraint severity. Australia's South32 placed the Mozambique facility into care and maintenance in March 2026 after failing to secure economically viable power supply contracts. This shutdown occurred independent of geopolitical disruptions, illustrating how energy costs alone can force production cessation.
Energy Cost Thresholds by Region:
| Region | Economic Threshold | Current Cost | Production Viability |
|---|---|---|---|
| North America | $80-120/MWh | $95-140/MWh | Marginal |
| Europe | €90-130/MWh | €110-180/MWh | Uneconomic |
| Australia | A$70-100/MWh | A$85-125/MWh | Conditional |
Mothballed European capacity of 2.1 million tons faces particularly severe restart barriers. Natural gas price volatility following regional conflicts has created electricity costs exceeding €130/MWh in many markets, well above the €90/MWh threshold for economic aluminum production. Natural gas price trends significantly impact aluminum production economics.
Power grid modernisation requirements add complexity to restart calculations. Smelters require dedicated transmission infrastructure and grid stability measures that can take 18-24 months to implement even when financing and permitting approvals are obtained rapidly.
The next major ASX story will hit our subscribers first
Manufacturing Sector Adaptation Strategies
Industrial aluminum consumers have implemented emergency adaptation measures that demonstrate the severity of supply constraints across multiple sectors. These adaptations range from material substitution to fundamental product redesign, with varying degrees of technical feasibility and economic impact.
Industry-Specific Substitution Analysis:
| Sector | Aluminum Content | Substitution Options | Implementation Timeline |
|---|---|---|---|
| Automotive | 180 kg/vehicle | Steel, carbon fiber | 12-18 months |
| Aerospace | 75% by weight | Limited alternatives | 36-60 months |
| Packaging | 95% recyclable | Steel, plastic | 3-6 months |
| Construction | 40% applications | Steel, concrete | 6-12 months |
Automotive manufacturers face moderate substitution feasibility but significant cost implications. Replacing 180 kg of aluminum per vehicle with steel alternatives increases vehicle weight by 40-60 kg, reducing fuel efficiency and requiring engine recalibration. Furthermore, carbon fiber substitution maintains weight targets but increases material costs by 300-500%.
Aerospace applications confront the most severe constraints. 75% aluminum content by weight in commercial aircraft cannot be rapidly substituted due to Federal Aviation Administration certification requirements. Alternative materials require 36-60 months for testing, approval, and production integration, making short-term substitution impossible.
Strategic Adaptation Measures:
• Design Optimisation: Reducing aluminum content per unit through engineering
• Strategic Stockpiling: Building inventory during availability windows
• Supply Diversification: Multi-region procurement agreements
• Alternative Materials: Long-term substitution development programs
Packaging sector adaptation demonstrates the fastest response capability. Beverage can manufacturers have shifted toward steel alternatives within 3-6 months, accepting slightly higher transportation costs for improved supply chain reliability. This substitution success reflects the packaging sector's lower technical barriers compared to structural applications.
Construction industry responses vary by application type. Window frames and curtain wall systems face limited substitution options due to corrosion resistance requirements, while structural applications can utilise steel alternatives with design modifications. These adaptations typically require 6-12 months for specification changes and supply chain integration.
Chinese Production Strategy and Export Policy
China's aluminum industry response reflects strategic domestic consumption prioritisation rather than global market stabilisation objectives. Despite controlling 57% of global production capacity, Chinese aluminum policy focuses on value-added downstream processing and domestic industrial development rather than primary aluminum exports.
Chinese Aluminum Industry Structure:
• Annual Capacity: 39.8 million tons (57% global share)
• Domestic Consumption: 85-90% of production
• Export Focus: Semi-finished products (wire, rod, plate)
• Primary Exports: Limited to 10-15% of production
March 2026 production data shows 2.7% month-over-month increase, indicating Chinese capacity utilisation expansion during global supply crisis. However, this increased production targets domestic infrastructure development and manufacturing sector support rather than international market supply augmentation.
Chinese export policy emphasises semi-finished aluminum products over primary ingot sales. This strategy captures higher value-added processing while supporting domestic employment in downstream industries. Wire rod, aluminum plate, and extrusion products receive export promotion while primary aluminum faces indirect restrictions through value-added processing requirements.
Chinese Export Structure Analysis:
| Product Category | Export Share | Strategic Priority | Market Impact |
|---|---|---|---|
| Primary Aluminum | 10-15% | Low priority | Limited relief |
| Wire/Rod | 25-35% | High priority | Competitive pressure |
| Sheet/Plate | 20-30% | Medium priority | Selective availability |
| Extrusions | 15-25% | High priority | Market flooding risk |
Regional supply agreement preferences favour Belt and Road Initiative partners and long-term strategic relationships over spot market sales to Western buyers. This policy approach means Chinese aluminum availability for crisis response depends on geopolitical relationships rather than purely economic considerations.
Technology transfer requirements increasingly accompany Chinese aluminum sales agreements. Western buyers seeking reliable Chinese supply access face pressure to share manufacturing technology or establish joint venture arrangements, creating strategic complications beyond procurement economics.
Strategic Resilience Framework Development
Market participants must develop comprehensive resilience frameworks that address multiple vulnerability layers simultaneously rather than pursuing single-point solutions. Effective risk management requires geographic diversification, technology investment, inventory strategy, and alternative material development integrated into coherent strategic approaches.
Multi-Layer Resilience Strategy:
• Geographic Diversification: 30-40% domestic/regional production targets
• Technology Investment: Recycling infrastructure for 75% recycled content
• Strategic Reserves: National-level inventory buffers
• Alternative Materials: Substitution development programs
Circular economy emphasis represents the most sustainable long-term resilience strategy. Aluminum recycling requires only 5% of primary production energy while maintaining material properties through multiple use cycles. Achieving 75% recycled content targets reduces dependence on energy-intensive smelting and geographic concentration risks.
Recycling Infrastructure Investment Requirements:
| Component | Investment Need | Timeline | Strategic Benefit |
|---|---|---|---|
| Collection Systems | $50-100B globally | 5-7 years | Supply diversification |
| Sorting Technology | $20-40B globally | 3-5 years | Quality maintenance |
| Processing Capacity | $75-150B globally | 7-10 years | Energy independence |
Early warning system development enables proactive risk management through predictive analytics and supply chain visibility platforms. Geopolitical risk monitoring algorithms can identify potential disruption scenarios 30-90 days in advance, enabling inventory building and alternative procurement activation.
Regional self-sufficiency targets provide strategic independence from concentrated production areas. North America and Europe possess sufficient bauxite reserves and renewable energy potential to achieve 30-40% domestic production within 10-15 years, but require sustained investment commitment and policy support. The bauxite project benefits demonstrate potential for increased domestic production capacity.
What Are the Long-term Implications?
The aluminum industry's current crisis demonstrates the fundamental transformation required in commodity market thinking. Traditional just-in-time inventory management and lowest-cost procurement strategies have created systematic vulnerabilities that threaten industrial continuity when disruptions occur. The ongoing situation illustrates how aluminum in crisis war tariffs and a market running on empty forces strategic planning capabilities.
Trump tariffs impact on global aluminum markets extends beyond immediate cost considerations. Success requires strategic planning capabilities that anticipate multiple scenario outcomes and maintain operational flexibility across diverse risk environments.
According to Reuters analysis, "The aluminum crisis represents a perfect storm of geopolitical tensions, supply chain vulnerabilities, and market concentration that threatens global industrial stability."
Future market participants must develop capabilities in scenario modeling, supplier relationship management, and alternative technology adoption that exceed traditional procurement functions. The integration of sustainability objectives with resilience requirements creates opportunities for competitive advantage through circular economy approaches and renewable energy adoption.
According to Market Screener, the convergence of these factors suggests a fundamental restructuring of global aluminum markets over the coming decade.
Long-term Market Structure Evolution:
Strategic Imperative: Organisations must transition from cost-optimised supply chains to resilience-focused procurement strategies that prioritise continuity over short-term savings, recognising that supply security represents strategic competitive advantage in increasingly volatile global markets.
The aluminum industry's current crisis demonstrates the fundamental transformation required in commodity market thinking. Traditional just-in-time inventory management and lowest-cost procurement strategies have created systematic vulnerabilities that threaten industrial continuity when disruptions occur.
Looking to capitalise on commodity market volatility and disruption?
Discovery Alert's proprietary Discovery IQ model delivers real-time alerts on significant ASX mineral discoveries, instantly empowering subscribers to identify actionable opportunities ahead of the broader market during periods of heightened commodity demand. With global aluminum markets facing unprecedented supply constraints and inventory crises, savvy investors can explore historic discovery outcomes to understand how major mineral finds have generated substantial returns, then begin their 14-day free trial today to position themselves ahead of market movements.