
July 30, 2026
When Energy Markets Stop Behaving Like Markets
Energy historians will likely look back at the mid-2020s as a period when the distinction between a temporary supply disruption and a permanent market realignment became critically important. The global LNG sector has endured price spikes before. The European gas crisis of 2021 to 2022, the post-pandemic demand surge, and the cascading effects of the Russia-Ukraine conflict all produced extreme volatility. But each of those episodes, however painful, ultimately resolved into some approximation of prior market conditions.
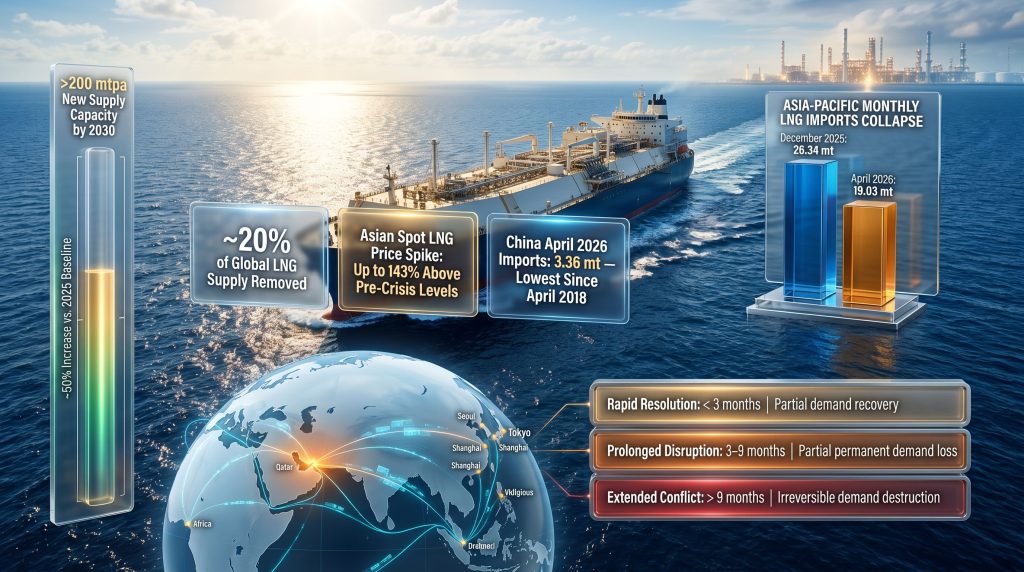
What is unfolding in 2026 carries a different character. The closure of the Strait of Hormuz and the force majeure cascade triggered by strikes on energy infrastructure across the Persian Gulf have removed approximately 20% of total seaborne LNG volumes from global markets. That is not a price event. It is a structural event, and the difference matters enormously for anyone trying to understand where natural gas demand is headed. Structural gas demand destruction in the global LNG market is the defining analytical challenge for energy investors over the next 12 to 36 months.
When big ASX news breaks, our subscribers know first
The Anatomy of a 20% Supply Collapse
How the Hormuz Closure Reshaped Global Gas Flows
The Strait of Hormuz is arguably the most consequential maritime chokepoint in global energy trade. Roughly one-fifth of the world's LNG transits through or originates from the Persian Gulf region, with Qatar's Ras Laffan complex functioning as the critical anchor of that supply architecture. When hostilities between the United States, Israel, and Iran intensified in early 2026, the resulting strikes on Gulf energy infrastructure triggered force majeure declarations that effectively removed Qatar from active LNG export markets.
The volume consequences were immediate and severe. Asian spot LNG prices spiked by an estimated 143% above pre-crisis levels, while European gas prices surged approximately 85% above where they had been trading. These were not short-lived intraday moves, but sustained pricing dislocations that began rewiring buyer behaviour across import-dependent economies.
The Arithmetic of Loss
The scale of the demand-side response can be read directly from the import data. According to shipping intelligence firm Kpler, Asia-Pacific LNG imports are tracking at approximately 19.03 million tonnes for April 2026, compared to a seasonal peak of 26.34 million tonnes in December 2025 and 20.69 million tonnes in March 2026. That is a decline of nearly 28% from the December high in just four months.
| Disruption Metric | Estimated Scale |
|---|---|
| Global LNG supply removed | ~20% of total seaborne volumes |
| Asian spot LNG price spike | Up to 143% above pre-crisis levels |
| European gas price increase | ~85% above pre-crisis levels |
| Asia-Pacific monthly LNG imports (April 2026) | ~19.03 million tonnes |
| Prior seasonal high (December 2025) | ~26.34 million tonnes |
| China April 2026 LNG imports (est.) | ~3.36 million tonnes |
| China December 2025 LNG imports | ~7.66 million tonnes |
China's figures are particularly striking. April 2026 import volumes are estimated at just 3.36 million tonnes, down from 7.66 million tonnes in December 2025. That represents a 56% contraction in roughly four months, and brings Chinese LNG import levels to their lowest point since April 2018, according to Reuters market analyst Clyde Russell citing Kpler data.
Is This a Price Shock or a Permanent Market Break?
Defining Structural Gas Demand Destruction
Understanding what is actually happening in the LNG market requires precision around terminology that is frequently misused. A price shock is cyclical. Buyers absorb elevated costs, reduce consumption at the margin, and return to prior purchasing patterns once prices normalise. Structural gas demand destruction in the global LNG market is something categorically different.
Structural gas demand destruction occurs when a supply disruption or price shock is sustained long enough that buyers permanently alter their energy sourcing strategies, switching fuels, accelerating alternative energy investment, or abandoning infrastructure commitments, rather than returning to prior consumption patterns once conditions normalise.
The critical variable, then, is duration. Philip Mshelbila, Secretary-General of the Gas Exporting Countries' Forum (GECF), addressed this directly at an industry event in Paris. Speaking to Reuters, Mshelbila indicated that if the conflict concluded immediately, global gas markets could expect a recovery window of six months to approximately one year. However, if hostilities persist beyond six months, the behavioural adjustments currently visible in trade data would likely transition from tactical responses into permanent structural shifts.
The Six-Month Threshold
This framing introduces a critical concept that is underappreciated in mainstream energy market commentary: the habituation threshold. When energy buyers are forced to adapt to a new supply environment, the adaptations they make are not costless or reversible. Utilities that restart coal capacity incur capital expenditure. Industrial facilities that switch feedstocks enter new supply contracts.
Governments that accelerate electrification policy commit budget resources that create political constituencies for continuation. After roughly six months, these adaptations begin to self-reinforce, creating path dependency that persists long after the original trigger resolves. Furthermore, the LNG supply outlook for the remainder of the decade depends heavily on whether this threshold is crossed.
Three Structural Headwinds Threatening Long-Term LNG Demand
Headwind 1: Coal Re-Substitution Across Asian Industry
Asia is the marginal demand growth engine for global LNG. Japan, South Korea, China, and a cluster of South and Southeast Asian emerging economies were collectively expected to absorb the bulk of new LNG supply coming online through 2030. When prices spike beyond the affordability threshold, Asian industrial buyers do not simply reduce gas consumption. Many revert to coal, a fuel that remains cheaper, more domestically accessible, and logistically simpler for heavy industrial applications.
The volume consequences of coal reversion in Asia are outsized relative to equivalent switching in other regions. Given that Asian economies collectively account for the largest share of anticipated LNG demand growth, any durable reduction in their gas appetite directly undermines the commercial viability of projects whose economics depend on that growth trajectory materialising.
This creates a profound policy contradiction. Many of the same governments now reverting to coal on energy security grounds have simultaneously made binding climate commitments that require accelerating the retirement of coal capacity. The conflict between energy security imperatives and decarbonisation obligations is not theoretical. It is playing out in real procurement decisions right now.
Headwind 2: Accelerated Electrification and Renewable Policy Pivots
Supply insecurity has historically been one of the most powerful accelerants of energy transition. The 2022 European gas crisis produced a solar deployment surge across the continent that climate policy alone had failed to deliver at equivalent speed. The current disruption is generating a comparable dynamic, and energy transition trends suggest this acceleration is becoming self-reinforcing.
Reports of European rooftop solar orders tripling as gas prices surge represent exactly the kind of demand-side structural response that, once embedded, does not simply reverse when gas prices fall. A household or industrial facility that has invested in solar generation has changed its energy consumption architecture permanently. At scale, millions of such decisions translate into a measurably lower gas demand baseline.
In import-dependent Asian economies, the same logic applies to electrification policy. Governments that are acutely exposed to LNG price volatility have strong political incentives to accelerate domestic renewable energy solutions in ways that reduce their long-term gas import dependency.
Headwind 3: Weakening Infrastructure Investment Appetite
Perhaps the most consequential and least discussed structural headwind involves the political economy of LNG import infrastructure. Long-term LNG supply deals are typically structured around regasification terminals, floating storage and regasification units (FSRUs), and interconnecting pipeline networks that have capital lives of 20 to 40 years. A government or utility that commits to this infrastructure is implicitly committing to LNG as a multi-decade energy source.
In the post-Hormuz environment, that commitment is being reassessed across several key import markets. Energy import dependency has become a political liability of the first order. Governments facing electorates dealing with energy price shock have every incentive to reframe long-term LNG investment as a strategic vulnerability rather than a security asset.
The Supply Overhang Problem: 200 mtpa Entering a Contracting Market
The Pre-Crisis Oversupply Narrative
Before hostilities disrupted Gulf energy flows, the consensus view among LNG market analysts was that the global market was approaching a tipping point into oversupply. The primary driver was a wave of new US liquefaction capacity that had reached final investment decision (FID) between 2022 and 2024, combined with additional volumes from other export projects. The anticipated result was more than 200 million tonnes per annum (mtpa) of new capacity coming online by 2030, representing approximately a 50% increase against the 2025 baseline. Consequently, the US natural gas prices trajectory was already a focal point for market participants navigating this anticipated oversupply environment.
| Metric | Estimated Figure |
|---|---|
| New LNG capacity coming online by 2030 | >200 million tonnes per annum |
| Increase vs. 2025 baseline | ~50% |
| Estimated supply capacity surplus above demand floor | ~337 mtpa |
| Proportion creating fundamental mismatch | ~50% of surplus capacity |
Mshelbila noted at the Paris event that prior analyst consensus had pointed to precisely this oversupply outcome materialising in 2026, driven by US capacity expansion running ahead of demand growth. The disruption has complicated that picture in ways that are not yet fully legible. As the IEA has noted, the Middle East crisis is delaying the anticipated LNG supply wave whilst simultaneously accelerating demand-side structural change.
Three Market Outcomes Depending on Conflict Duration
| Scenario | Conflict Duration | Market Outcome |
|---|---|---|
| Rapid Resolution | Less than 3 months | Partial demand recovery; 6 to 12 month normalisation window |
| Prolonged Disruption | 3 to 9 months | Structural buyer behaviour shift; partial permanent demand loss |
| Extended Conflict | More than 9 months | Irreversible demand destruction; LNG oversupply glut deepens significantly |
The paradox embedded in the extended conflict scenario is counterintuitive but analytically important. A supply disruption of sufficient duration and severity can simultaneously create the conditions for a demand glut to emerge later, precisely because the buyers who were expected to absorb new supply have permanently reduced their LNG dependency during the disruption period.
Who Is Filling the Gap, and Why It Matters
The Upstream Molecule Problem
With Qatari volumes largely absent from the market, the gap-filling response has been predictably concentrated in US LNG, which has the distinct advantage of being geographically unconstrained by the Hormuz situation and commercially motivated to move volumes at elevated spot prices. Russian LNG has also partially filled the space, though volumes remain constrained by geopolitical considerations across European buyer markets.
The more revealing story lies in what has not happened. African LNG producers, whose combined reserves and existing infrastructure should theoretically make them natural beneficiaries of a Middle Eastern supply disruption, have been largely unable to capitalise on the opportunity. The GECF's Mshelbila was direct about this gap: African nations hold excess capacity across both LNG and pipeline export infrastructure, yet none of their key export pipelines to Europe is currently operating at full capacity.
| Country/Route | Status | Key Constraint |
|---|---|---|
| Nigeria LNG | Below full capacity; exports rising to Asia | Infrastructure bottlenecks; planned expansion from 22 mtpa to 30 mtpa |
| Algeria (pipeline to Europe) | Below full capacity; deliveries rising | Upstream molecule constraints; export pipelines not at full capacity |
| Libya (pipeline to Europe) | Below full capacity | Political instability; infrastructure underinvestment |
| Algeria gas production target | 200 bcm/year by 2030 | Requires $50 to $60 billion in upstream investment |
Algeria is perhaps the clearest illustration of the upstream molecule problem. The country exported approximately 39 to 40 billion cubic metres of natural gas via pipeline and LNG last year, representing 13 to 14% of Europe's total gas imports. Algeria has recently launched tenders for seven new oil and gas exploration blocks, with bids due by November 2026, as part of a plan to grow annual gas output to 200 billion cubic metres by 2030, requiring an estimated $50 to $60 billion in upstream capital.
The problem is temporal. These are decade-scale investments addressing an immediate market need. As Mshelbila described, the opportunity to fill the infrastructure exists, but the molecules needed to physically move through that infrastructure do not yet exist in deliverable form. Reserves sitting in undrilled or undeveloped fields cannot respond to a spot market price signal.
The next major ASX story will hit our subscribers first
Geographic Demand Destruction: The Sharpest Exposures
China's 56% Import Collapse
China's situation is qualitatively different from other affected importers. The 56% decline from December 2025 to April 2026 reflects a combination of factors: strategic reserve drawdowns replacing spot market purchases, deliberate demand management reducing industrial gas consumption, and the substitution of domestic gas production and coal for imported LNG. The critical long-term question is whether China's LNG import infrastructure investment trajectory changes as a consequence of this episode.
Pakistan and Price-Induced Demand Cuts
Pakistan's situation is structurally different and arguably more revealing. Unlike China, Pakistan does not have the domestic production base or strategic reserve cushion to absorb LNG price spikes through voluntary demand management. Qatar's $20 billion LNG supply disruption forced Pakistan back into spot market procurement at precisely the moment spot prices were at their most punishing.
The result is organic demand destruction, where industrial and commercial consumers simply cannot afford gas at current prices and either curtail activity or switch fuels. This dynamic is replicated across several South and Southeast Asian price-sensitive markets. Furthermore, analysts at OilPrice.com have highlighted that this price-induced demand curtailment in emerging markets represents one of the most consequential near-term risks to LNG demand growth assumptions.
Japan and South Korea: Structured Vulnerability
Japan and South Korea occupy a distinctive position. Both nations maintain substantial long-term contracted LNG volumes that partially insulate them from spot market price exposure. However, neither country is entirely hedged. Spot market top-up requirements and contract repricing provisions expose both to the current pricing environment, while the broader energy security debate triggered by the Hormuz closure is already influencing policy deliberations around nuclear restarts and domestic renewable acceleration.
What This Means for LNG Project Economics Through 2030
The FID Risk
The commercial logic underpinning final investment decisions for new LNG export capacity rests on confidence in long-term demand growth in Asian import markets. If the current disruption produces durable demand reduction across China, Japan, South Korea, and the price-sensitive emerging market tier, the demand assumptions embedded in projects currently at pre-FID stage become unreliable.
| Market Expectation | Pre-Crisis Forecast | Post-Crisis Revised View |
|---|---|---|
| LNG market balance (2026) | Tipping into oversupply | Uncertain; glut delayed or structurally altered |
| Primary driver of oversupply | US capacity expansion plus slow demand growth | Demand destruction offsetting new supply additions |
| Asian import growth trajectory | Moderate growth | Sharp contraction; multi-year recovery uncertain |
| Long-term contract appetite | Stable | Weakening in import-dependent economies |
The interaction between 200-plus mtpa of new supply and a contracting demand base is not a scenario that LNG project economics were modelled to survive. For regasification terminal developers in import-dependent economies already reassessing their long-term LNG commitments, the stranded asset risk is no longer theoretical. In sum, structural gas demand destruction in the global LNG market has shifted from a tail-risk scenario into a baseline planning assumption for many market participants.
Frequently Asked Questions: Structural Gas Demand Destruction in the LNG Market
What caused the current structural demand destruction in the LNG market?
The Strait of Hormuz closure and strikes on Gulf energy infrastructure, specifically Qatar's Ras Laffan LNG complex, removed approximately 20% of global seaborne LNG volumes. Sustained high prices have driven coal substitution, demand curtailment, and accelerated renewable investment across key import markets.
How long does it take for LNG demand to recover after a major supply disruption?
According to GECF analysis, a rapid conflict resolution could produce a six to twelve month market normalisation window. Disruptions lasting longer than six months risk triggering permanent behavioural shifts as buyers establish alternative fuel sourcing, infrastructure commitments, and energy policy frameworks that do not depend on LNG.
Which countries are most vulnerable to LNG demand destruction?
Price-sensitive emerging markets without strategic reserve buffers, primarily Pakistan and several Southeast Asian economies, face the most immediate and involuntary demand destruction. China, despite its scale, has demonstrated voluntary demand management capacity. Japan and South Korea carry structural exposure through spot top-up requirements.
Can African LNG producers realistically replace Middle Eastern supply?
Not at the speed or scale required to address the current deficit. While Algeria, Nigeria, and Libya collectively hold significant untapped capacity, the upstream molecule constraint means that reserves in the ground cannot respond to spot price signals. Algeria's 200 bcm production target by 2030 requires $50 to $60 billion in investment and represents a decade-scale supply response to an immediate market need.
What happens to global LNG prices if demand destruction becomes permanent?
A scenario involving permanent demand destruction alongside 200-plus mtpa of new supply creates conditions for a bifurcated market: chronic oversupply in physical terms coexisting with elevated spot price volatility as geopolitical risk premiums persist. Long-term contract pricing would likely compress under the weight of the physical glut, undermining project economics for new capacity.
How does the 200 mtpa supply wave interact with falling demand?
It creates the structural oversupply paradox: new capacity sanctioned against pre-crisis demand growth assumptions enters a market where the demand floor has moved structurally lower. The resulting glut would be deeper and longer-lasting than pre-crisis analyst projections anticipated, with cascading consequences for contract renegotiation, project financing, and FID timelines.
This article is based on publicly available market data, reporting from Reuters and OilPrice.com, and statements made by Philip Mshelbila of the Gas Exporting Countries' Forum (GECF) at a Paris industry event. Import volume data cited is sourced from Kpler shipping intelligence as reported by Reuters. This article contains forward-looking analysis and scenario modelling that involves inherent uncertainty. It does not constitute financial or investment advice. Readers should conduct independent research before making any investment decisions.
Want to Identify Investment Opportunities Emerging From Global Energy Market Disruptions?
Discovery Alert's proprietary Discovery IQ model delivers real-time alerts on significant ASX mineral discoveries, instantly translating complex market data into actionable insights for investors navigating volatile commodity environments. Explore how historic discoveries have generated substantial returns by visiting Discovery Alert's dedicated discoveries page, and begin your 14-day free trial today to position yourself ahead of the market.