July 18, 2026
Why Geological Confidence Is the Most Underrated Variable in Lithium Project Valuation
Most market participants focus on lithium prices, battery demand forecasts, or EV adoption curves when evaluating junior mining stocks. Far fewer pay close attention to the internal mechanics of resource classification, despite the fact that a single category upgrade within a mineral resource estimate can fundamentally reshape a project's financing prospects, engineering pathway, and long-term valuation ceiling. Understanding how this process works, and what it means when a large-tonnage clay lithium deposit clears a critical confidence threshold, is essential context for evaluating what the Surge Battery Metals Nevada North lithium resource upgrade actually represents.
When big ASX news breaks, our subscribers know first
From Inferred to Investable: What NI 43-101 Resource Categories Actually Mean
Mineral resource estimates prepared under NI 43-101 standards are divided into three confidence tiers — and understanding mineral deposit tiers is essential context for evaluating what each classification actually means in practice:
- Inferred resources are defined by limited geological evidence and relatively sparse drilling. They can be included in scoping-level studies but carry too much uncertainty for detailed mine planning.
- Indicated resources are supported by closer drill spacing and sufficient geological continuity to allow reasonable assumptions about grade and tonnage, making them suitable for Pre-Feasibility Study inputs.
- Measured resources carry the highest level of confidence, derived from dense drilling grids and thorough sampling that allows mine planners to rely on the data without significant qualification.
The practical consequence of this tiered system is that projects heavily weighted toward inferred material face materially higher capital costs and lender scepticism. Institutional project financiers and offtake counterparties routinely apply minimum M&I thresholds before committing to feasibility-stage negotiations. A deposit that cannot demonstrate the majority of its planned mine material sits in the Measured and Indicated category effectively carries a structural financing discount, regardless of how attractive its headline tonnage or grade figures appear.
Nevada North Lithium Project: Core Asset Overview
The Nevada North Lithium Project (NNLP) is situated within the Nevada Basin, a geological setting that has emerged as one of the most consequential lithium-hosting environments in North America. The project operates under a joint venture structure, with Surge Battery Metals holding a 70.54% interest and Evolution Mining retaining the remaining 29.46%.
Evolution Mining's involvement extends beyond passive equity participation. The company has committed up to C$10 million specifically directed toward Pre-Feasibility Study execution, with an initial advance of CA$2.1 million deployed in April 2026. This type of structured funding commitment from a credible mining partner carries its own signalling value, as it reflects an independent technical assessment that the project merits continued capital investment.
Nevada's combination of established mining regulatory frameworks, existing regional infrastructure, and proximity to U.S. battery manufacturing corridors creates a jurisdictional context that is difficult to replicate elsewhere in the country.
The Updated MRE at a Glance: Key Metrics Summarised
The Surge Battery Metals Nevada North lithium resource upgrade delivers a materially improved picture of deposit scale and confidence:
| Resource Category | Tonnage (Mt) | Lithium Grade (ppm) | LCE (Mt) |
|---|---|---|---|
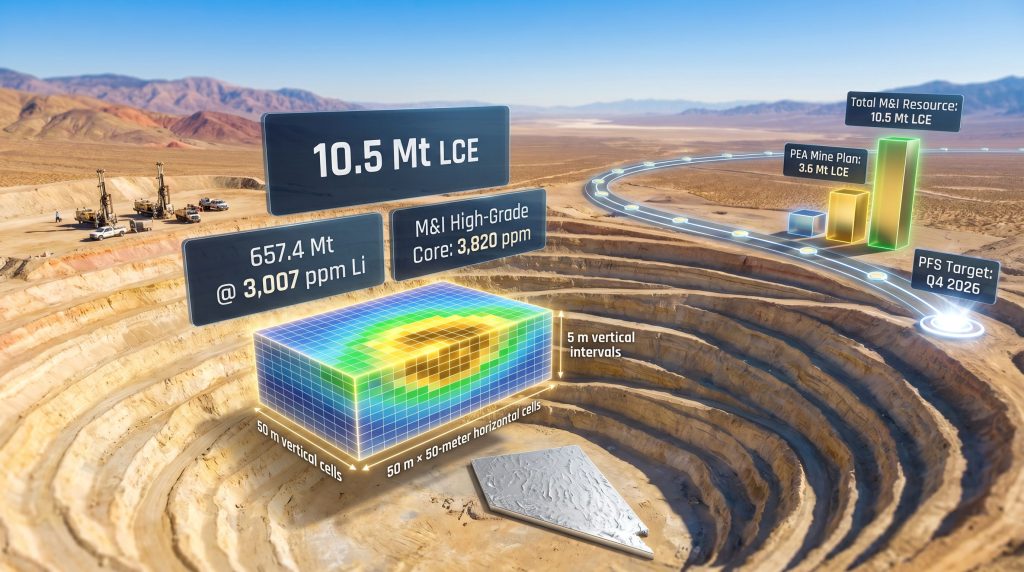
| Measured & Indicated (Total) | 657.4 | 3,007 | 10.5 |
| High-Grade Core (M&I Subset) | Subset of above | 3,820 | 6.7 |
| Inferred | Additional material | Not specified | 3.1 |
| PEA Mine Plan (Reference Only) | Subset of M&I | 4,016 | 3.6 |
The aggregate M&I resource of 10.5 million tonnes LCE across 657.4 million tonnes of material grading 3,007 ppm lithium establishes NNLP as a large-scale, commercially relevant clay lithium deposit. The high-grade core component, at 3,820 ppm lithium containing 6.7 Mt LCE, is particularly noteworthy because it demonstrates that elevated grades are not limited to a small, isolated zone but extend across a substantial portion of the deposit footprint.
The additional 3.1 Mt LCE in the inferred category preserves meaningful exploration upside without compromising the project's core development narrative, which now rests firmly on its M&I base.
Why 87% M&I Conversion Within the PEA Pit Shell Matters
One of the most technically significant figures embedded in this resource update is the confirmation that 87% of the material within the existing PEA pit shell now sits in the Measured and Indicated category.
This threshold is frequently cited by project financiers as a minimum confidence benchmark before committing capital to feasibility-stage work. A resource where the overwhelming majority of planned mine material carries high geological confidence is materially de-risked compared to projects that rely on inferred material to fill their mine schedules.
In practical terms, this conversion rate means:
- The geological assumptions underpinning the existing PEA mine plan are now supported by substantially better data.
- Pre-Feasibility Study engineers can build mine schedules with considerably less uncertainty about grade and tonnage continuity.
- Lenders and institutional investors reviewing the PFS will encounter a resource model that meets or exceeds standard due diligence thresholds for project financing conversations.
- The risk that mine plan assumptions will require material revision during PFS work is meaningfully lower than it would be in a deposit relying on a higher proportion of inferred material.
How the Resource Was Built: Drilling, Modelling, and Geostatistics Explained
The updated estimate did not emerge from reinterpreting existing data. It reflects a targeted 2025 drilling programs campaign consisting of nine drill holes totalling 4,634.5 feet (1,412.6 meters), designed with dual objectives: converting existing inferred material to higher-confidence categories through infill drilling, and testing deposit extensions through step-out holes.
Independent engineering firm RESPEC was responsible for resource estimation and model validation. The estimation process followed a structured methodology:
- Geological modelling involved constructing 3D representations of the lithium-bearing clay stratigraphic units, identifying lateral and vertical boundaries of mineralised zones.
- Statistical analysis examined the distribution of lithium grades within each key clay unit to understand grade variability and population characteristics before interpolation.
- Block model construction used 50-metre by 50-metre horizontal blocks with 5-metre vertical intervals, dimensions consistent with industry practice for large-tonnage clay systems where broad horizontal continuity is the primary estimation variable.
- Geostatistical interpolation applied variogram modelling and kriging methods to populate the block model with grade estimates while quantifying estimation uncertainty across the deposit footprint.
Furthermore, when interpreting drill results from a large-footprint clay system like NNLP, the selection of 50m x 50m x 5m block dimensions reflects a deliberate trade-off between capturing grade variability at a meaningful scale and maintaining computational efficiency. Smaller blocks would not materially improve estimation confidence given the broad spatial continuity typical of sediment-hosted clay lithium systems.
The next major ASX story will hit our subscribers first
Understanding Grade in Clay-Hosted Lithium Deposits: Why ppm Figures Carry More Weight Than They Appear
A lithium grade expressed in parts per million is less intuitive than the grams-per-tonne figures used in gold or silver deposits, but the underlying economics are directly analogous. For clay-hosted deposits specifically, grade drives several interconnected cost variables:
- Ore processing volume: Higher-grade material requires less total rock to be processed per unit of lithium recovered, directly reducing plant throughput requirements and capital intensity per tonne of LCE produced.
- Reagent consumption: Leaching and precipitation chemistry in lithium clay processing consumes reagents proportional to the volume of material processed rather than the lithium content alone. Higher grades therefore reduce reagent cost per tonne of LCE output.
- Tailings management: Lower-grade operations generate proportionally more tailings per unit of product, increasing storage, containment, and environmental compliance costs over the project life.
At 3,007 ppm average grade across the M&I resource, with core zones exceeding 3,820 ppm, NNLP occupies a favourable position relative to many U.S. clay lithium peers. For context, the Thacker Pass lithium mine, which is considered the benchmark for Nevada clay lithium viability, operates at reported grades in the 1,300 to 1,500 ppm range. NNLP's grades being roughly double this benchmark carries meaningful implications for processing economics, though direct comparisons must account for differences in mineralogy, processing chemistry, and deposit geometry.
| Project | Location | Reported Grade (ppm Li) | Development Stage |
|---|---|---|---|
| Nevada North (NNLP) | Nevada, USA | 3,007-3,820 (M&I) | PFS Stage (Q4 2026 target) |
| Thacker Pass | Nevada, USA | ~1,300-1,500 | Construction Stage |
The Scale Gap Between PEA Mine Plan and Total M&I Resource
One of the more strategically important dimensions of this update is the size of the gap between what the existing PEA mine plan actually uses and what the broader M&I resource now contains.
The PEA mine plan draws on approximately 3.6 Mt LCE grading 4,016 ppm lithium. The updated M&I resource stands at 10.5 Mt LCE. Consequently, the current mine concept utilises roughly 34% of the total M&I resource base, leaving approximately 6.9 Mt LCE of high-confidence material outside the planned mine footprint.
This gap can be interpreted through three distinct strategic lenses:
- Extended mine life: Maintaining the same annual production throughput as the PEA envisions but extending operations across additional M&I material could significantly lengthen mine life beyond the original study's modelled duration.
- Production scale-up: A larger processing facility designed to access more of the M&I resource per year could increase annual LCE output, potentially improving fixed-cost absorption and overall project economics.
- Phased development: Staging capital deployment across multiple development phases reduces upfront financing requirements and allows the project to generate cash flow from initial operations before committing to expansion capital.
The PEA's headline financial metrics provide the foundation against which PFS improvements will be measured:
| Economic Metric | PEA Estimate |
|---|---|
| After-Tax NPV (8% discount rate) | US$9.17 billion |
| After-Tax IRR | 22.8% |
| Estimated Operating Cost | ~US$5,243 per tonne LCE |
These figures positioned NNLP as one of the more closely monitored U.S. clay lithium projects prior to this resource upgrade. The expanded M&I base creates a reasonable basis for expecting PFS financial modelling to reflect an improved or extended project profile. However, this remains subject to the outcomes of detailed engineering work, metallurgical test programmes, and updated cost estimation. Readers should not treat PEA-stage economics as reliable forecasts of actual project returns.
Three Identified Pathways for Resource Expansion Beyond the Current MRE
The current 10.5 Mt LCE M&I figure represents a development-stage baseline rather than the project's ultimate resource ceiling. Three distinct growth vectors have been identified through geological analysis:
1. Infill Drilling in Lower-Density Zones
Areas with wider existing drill spacing remain candidates for grade confidence improvement. Historical infill results at NNLP have demonstrated grade uplift when drill density increases, suggesting that tighter infill in currently underdrilled sectors could convert additional material from inferred to indicated classification. In addition, this approach could reveal higher local grade estimates in zones that are currently undercharacterised.
2. Southern and Eastern Deposit Extensions
High-grade zones grading above 3,000 ppm lithium remain geologically open to the south and east of the basin. The deposit has not been closed in these directions, meaning step-out drilling could define additional M&I tonnage not yet captured in the resource model. According to recent resource upgrade announcements, these open extensions represent some of the most compelling near-term exploration targets on the project.
3. Near-Surface Northeastern Targets
New high-resolution topographic survey work has revealed shallow lithium-bearing areas in the northeastern sector of the project. Near-surface targets carry operational significance because reduced strip ratios lower mining costs per tonne processed, potentially contributing economical incremental tonnage without proportional increases in capital expenditure.
Furthermore, the combination of open deposit extensions in multiple directions and near-surface targets identified through geophysical survey work suggests the current 10.5 Mt LCE M&I figure represents a floor rather than a ceiling for NNLP's ultimate resource potential. This remains speculative at this stage and is dependent on the outcomes of future drilling work.
The Development Pathway: From Resource Upgrade to Pre-Feasibility Study
The Q4 2026 PFS target represents the next critical milestone on NNLP's development timeline. A definitive feasibility study for a clay lithium project of this scale must address several interconnected technical workstreams:
- Integration of the updated resource model into mine scheduling and optimisation software to define pit phases and production sequences.
- Metallurgical recovery testing on representative ore samples from across the deposit to establish processing flowsheet design parameters.
- Processing plant configuration design and capital cost estimation, incorporating equipment selection and infrastructure requirements.
- Site infrastructure assessment covering water supply, power connectivity, access road requirements, and tailings management design.
- Environmental baseline data collection to support future permitting applications.
- Financial modelling incorporating updated capital and operating cost estimates against current and forecast lithium price scenarios.
Evolution Mining's C$10 million JV funding commitment is specifically allocated to PFS execution, removing the near-term capital uncertainty that often constrains junior mining companies at this development stage. Moreover, the CA$2.1 million advance already deployed in April 2026 signals active engagement rather than passive funding commitment.
Notably, recent beneficiation test work on Nevada North Project samples achieved a 25% lithium grade increase, providing additional technical validation of the deposit's processing potential ahead of the formal PFS process.
What Thacker Pass Means for Nevada Clay Lithium Credibility
The progress of Lithium Americas' Thacker Pass project carries broader significance for the Nevada clay lithium development landscape. Thacker Pass is advancing toward production, establishing a real-world proof of concept for large-scale clay-hosted lithium extraction in Nevada, and General Motors committed approximately US$625 million to support the project in what represents one of the largest automaker investments ever made directly into a U.S. lithium development asset.
This regional validation matters for adjacent development-stage projects in several ways. Processing knowledge accumulated during Thacker Pass construction and commissioning becomes accessible to regional peers. Furthermore, workforce development in Nevada's lithium sector reduces skilled labour risk for future projects, whilst infrastructure investment in access, power, and water systems often creates positive spillover effects for nearby operations.
Importantly, this regional momentum reflects industry-level validation of Nevada clay lithium as a commercial proposition, not project-specific support or endorsement of NNLP's development timeline. Each project must independently demonstrate its technical and economic viability through its own engineering and permitting processes.
Key Takeaways for Understanding the NNLP Resource Upgrade
The Surge Battery Metals Nevada North lithium resource upgrade is most accurately understood not as a tonnage event but as a confidence event. The numbers matter less than what they enable:
- The shift to 10.5 Mt LCE in the M&I category across 657.4 Mt grading 3,007 ppm lithium moves NNLP from exploration-stage to development-stage geological maturity.
- The 87% M&I conversion within the PEA pit shell directly addresses the primary geological risk factor that project financiers apply to clay lithium assets at this stage.
- The ~3x gap between PEA mine plan requirements (3.6 Mt LCE) and total M&I resource (10.5 Mt LCE) creates substantial optionality for mine design evolution in the PFS.
- High-grade core zones exceeding 3,820 ppm lithium differentiate NNLP within the U.S. clay lithium peer group and carry direct implications for processing economics.
- The Q4 2026 PFS completion target, backed by Evolution Mining's funding, represents the next de-risking milestone that the market will use to reassess project maturity.
This article is informational in nature and does not constitute financial or investment advice. Mineral resource estimates, PEA economics, and development timelines are subject to material uncertainty. Investors should conduct their own due diligence, review all relevant regulatory filings, and consider the significant risks associated with early-stage mineral development projects before making any investment decisions.
Want to Catch the Next Major Mineral Discovery the Moment It Hits the ASX?
Discovery Alert's proprietary Discovery IQ model scans ASX announcements in real time, instantly identifying significant mineral discoveries and translating complex geological data into actionable investment insights — explore historic discoveries and their returns to understand the potential scale of opportunity, then start your 14-day free trial at Discovery Alert to position yourself ahead of the broader market.