July 28, 2026
Why Asia's Scrap Bellwether Is Sending a Warning Signal
Electric arc furnace steelmaking has reshaped the global ferrous metals trade over the past three decades. Unlike blast furnace-based production, EAF technology relies almost entirely on recycled steel scrap as its primary feedstock, making EAF-dominated steel industries acutely sensitive to two variables: the price and availability of seaborne scrap, and the health of downstream steel demand. No market in Asia illustrates this dynamic more clearly than Taiwan.
Taiwan's steel sector operates almost entirely on the EAF model, meaning it imports virtually all of its ferrous scrap from international markets rather than producing iron ore-based hot metal domestically. This structural dependency makes Taiwan one of the most transparent windows into the broader health of Asian scrap trade flows. When Taiwanese mills buy aggressively, it signals confidence in downstream demand. When they pull back, it is a reliable leading indicator that something more fundamental has shifted in regional steel consumption. The data for the first half of 2026 tells a story worth examining carefully.
When big ASX news breaks, our subscribers know first
Taiwan Scrap Imports Drop in January-June: The Numbers Behind the Decline
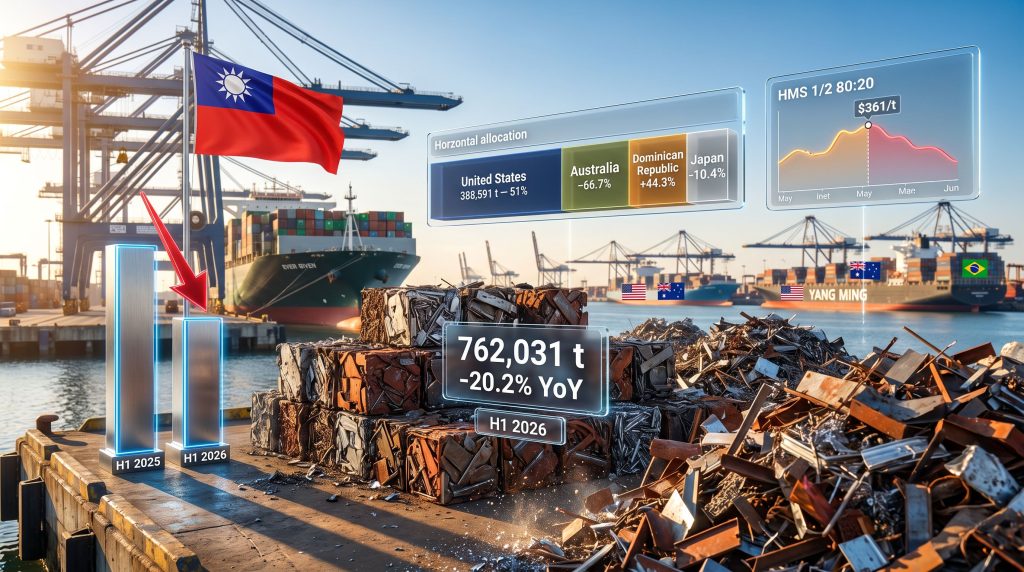
Taiwan scrap imports drop in January-June 2026 is not a minor statistical footnote — it represents a 20.2% year-on-year contraction, reaching 762,031 tonnes against an estimated 952,000 tonnes recorded in the same window of 2025. That is a contraction of roughly 190,000 tonnes across six months, which in seaborne scrap terms represents a meaningful withdrawal from an already supply-sensitive market.
What makes the data more striking is that the decline in scrap imports did not occur in isolation. Taiwan's semi-finished steel imports fell by a parallel 22% year-on-year to 1.35 million tonnes in H1 2026. The co-movement of these two indicators matters because it rules out the possibility that mills were simply substituting imported billets for scrap. Both raw material categories contracted simultaneously, pointing to a single root cause: Taiwanese steelmakers reduced output because finished steel demand was insufficient to justify maintaining elevated production rates.
The simultaneous contraction in both ferrous scrap and semi-finished steel imports confirms that the primary driver is reduced steelmaking activity across the board, not a raw material substitution effect operating within the supply chain.
H1 2026 Ferrous Scrap Import Summary
| Metric | H1 2026 | H1 2025 (Est.) | YoY Change |
|---|---|---|---|
| Total ferrous scrap imports | 762,031 t | ~952,000 t | -20.2% |
| Semi-finished steel imports | 1.35 mn t | ~1.73 mn t | -22.0% |
| June scrap imports | 158,704 t | ~157,600 t | +0.7% |
| June vs. May (MoM) | 158,704 t | 141,700 t (May est.) | +12.0% |
Source: Taiwan customs data
The HMS 1/2 80:20 Benchmark: A Pricing Story in Three Acts
To fully understand what drove procurement behaviour in H1 2026, it is necessary to understand how the key benchmark price for seaborne scrap traded across the period.
HMS 1/2 80:20 (Heavy Melting Scrap, grades 1 and 2 in an 80:20 ratio) is the standard containerised ferrous scrap grade most widely used for price benchmarking in Asian seaborne trade. It represents a blended product of structurally heavier industrial and demolition scrap, and its price assessment serves as the primary reference point for Taiwanese mill procurement decisions. The grade specification matters because quality consistency directly affects furnace yield and melt chemistry, making the benchmark both a pricing and a quality reference.
The price trajectory in H1 2026 unfolded in three distinct phases:
-
January through mid-May: The containerised HMS 1/2 80:20 import price climbed progressively, rising approximately $64 per tonne to reach $361/t by 19 May 2026. During this phase, improving market sentiment encouraged Taiwanese mills to engage more actively in the seaborne market, with some buyers advancing procurement to capture volumes before prices moved higher.
-
Mid-May: The price peaked at $361/t, a level that began to act as a demand ceiling. At this price point, mill margins on finished long steel products were insufficient to justify further aggressive procurement, particularly given weak downstream demand from construction and manufacturing sectors.
-
Late May onward: Prices began retreating, removing the urgency for forward buying. Mills that had purchased at or near the peak found themselves managing margin pressure as finished steel values failed to recover in tandem.
Price momentum in seaborne scrap can temporarily stimulate procurement activity, but it cannot sustain volume growth when the underlying steel demand fundamentals are structurally weak. The H1 2026 trajectory illustrated this ceiling effect with precision.
Country-Level Supply Shifts: Who Won and Who Lost Ground?
The composition of Taiwan's scrap import mix changed materially during H1 2026, with established suppliers losing market share to emerging Atlantic Basin and South American origins. This geographic rotation is one of the most analytically significant aspects of the period.
Taiwan Ferrous Scrap Imports by Country of Origin
| Origin | June 2026 (t) | MoM Change | YoY Change | H1 2026 (t) | YoY Change |
|---|---|---|---|---|---|
| United States | 79,525 | +11.6% | -26.8% | 388,591 | -21.0% |
| Japan | 13,740 | +42.0% | +13.0% | 46,446 | -10.4% |
| Dominican Republic | 11,984 | -3.1% | +153.6% | 46,920 | +44.3% |
| Australia | 5,242 | -57.0% | -64.9% | 79,261 | -66.7% |
| Others | 48,213 | +33.0% | +112.0% | 200,813 | +42.9% |
| Total | 158,704 | +12.0% | +0.7% | 762,031 | -20.2% |
Source: Taiwan customs data
United States: Top Supplier, Diminished Volumes
The US retained its position as Taiwan's largest single ferrous scrap supplier in H1 2026, contributing 388,591 tonnes across the period, equivalent to approximately 51% of total imports. However, this dominance came with a significant asterisk: volumes fell by 21% year-on-year, reflecting both the reduced overall demand environment and the impact of elevated US containerised scrap pricing during the January-to-May price run-up.
The competitiveness of US-origin material in Taiwanese containerised scrap trade is influenced by several factors that are not always visible in headline price data. Furthermore, these include vessel freight rates on the transpacific route, container availability at US export ports, and the quality premium or discount assigned to specific US shredded or HMS grades relative to Japanese or Australian alternatives. When the HMS 1/2 80:20 price was rising aggressively through mid-May, the relative attractiveness of US material versus alternative origins narrowed, contributing to the volume shortfall.
Japan: Pricing Disadvantage Creates a Structural Opening for Rivals
Japan has historically been a premium-quality, geographically proximate ferrous scrap source for Taiwanese mills. Japanese scrap benefits from a reputation for high quality and consistency, partly because Japan's advanced industrial economy generates significant volumes of clean manufacturing scrap with predictable chemical specifications. This quality advantage typically commands a price premium in Asian seaborne markets.
In H1 2026, however, elevated Japanese domestic scrap collection prices made it difficult for Japanese exporters to compete against Atlantic Basin and South American origins on a delivered-cost basis into Taiwan. H1 imports from Japan fell 10.4% year-on-year to 46,446 tonnes, with June showing a month-on-month recovery of 42% to 13,740 tonnes that reflected tactical restocking rather than any structural improvement in Japan's competitive position.
A key dynamic that is often underappreciated in scrap market analysis is that Japanese domestic scrap prices are heavily influenced by the procurement competition between Japanese EAF mills and export traders. When domestic Japanese mills are active and willing to pay premium prices, export availability tightens and delivered costs into Taiwan rise, eroding Japan's traditional geographic advantage. This internal competition within Japan's scrap ecosystem was a contributing factor to Taiwan's reduced Japanese procurement in H1 2026.
Dominican Republic and South American Origins: The Supply Substitution Effect
The most structurally significant shift in Taiwan's H1 2026 import mix was the surge in procurement from non-traditional origins. The Dominican Republic recorded a 153.6% year-on-year increase in June deliveries and a 44.3% rise across H1 2026 to 46,920 tonnes, while the aggregate "others" category expanded by 42.9% to 200,813 tonnes, collectively accounting for a growing share of Taiwan's total scrap supply.
This substitution effect reflects a broader reconfiguration underway in global scrap trade flows. South American scrap exporters, including operators in the Dominican Republic and other Caribbean Basin nations, have developed the logistical infrastructure to supply containerised scrap into Asian markets competitively. Their pricing relative to Japanese and Australian origins improved materially when traditional supplier pricing moved higher, creating an opportunistic opening that Taiwanese mills capitalised on.
The rapid market share gain by South American origins in Taiwan's import mix should not be dismissed as a one-off event. If Japanese scrap pricing remains structurally elevated relative to Atlantic Basin alternatives, the geographic diversification of Taiwan's supply base could become a lasting feature of the market rather than a temporary substitution.
Australia: The Steepest Decline Among Major Suppliers
Australian ferrous scrap exports to Taiwan collapsed by 66.7% year-on-year in H1 2026, falling to just 79,261 tonnes. The June figure of 5,242 tonnes, representing a 57% month-on-month decline and a 64.9% year-on-year contraction, underscores how significantly Australia's position in Taiwan's supply hierarchy has deteriorated.
Several converging factors likely explain this outcome. Pacific trade route freight economics, which must be absorbed by Australian exporters competing against lower-logistics-cost Atlantic Basin origins, represent a persistent structural disadvantage. Additionally, Australia's domestic scrap generation capacity is constrained by the relatively small size of the country's industrial and manufacturing base relative to its land area, limiting export volume potential compared to the US or Japan.
The depth of the H1 2026 decline suggests that Australia's position in the Taiwan trade may require a significant correction in competing origin prices before it can recover meaningful market share in the near term.
Four Structural Forces Driving the Demand Compression
Understanding the H1 2026 Taiwan scrap import contraction requires looking beyond individual supply chain dynamics to the multiple demand-side forces operating simultaneously.
1. Downstream Steel Demand Weakness
Taiwan's EAF mills produce predominantly long steel products such as rebar and structural sections, which are primary inputs for the construction sector. With Taiwan's construction activity subdued throughout the period, demand for these finished steel products remained insufficient to justify elevated production rates, directly suppressing scrap intake requirements.
2. Chinese Steel Export Pressure
An underappreciated structural driver of Taiwan's reduced steelmaking activity is the ongoing pressure from Chinese finished steel exports across Asian markets. The China steel outlook remains a critical variable here, as Chinese producers operating with significant installed capacity have periodically redirected volumes offshore, compressing regional steel prices. For Taiwanese mills, this creates a margin squeeze that reduces the economic case for maintaining full production rates and associated scrap inventories.
Furthermore, the broader China steel market challenges have created ripple effects throughout Asia, as excess capacity and sluggish domestic demand continue to drive elevated export volumes that undercut regional competitors. Consequently, mills in markets like Taiwan face sustained pressure on finished steel margins that is not easily resolved in the short term.
3. The Electricity Restriction Seasonal Factor
A calendar feature of Taiwan's steelmaking market that receives limited attention in mainstream commodity analysis is the summer electricity restriction period. Taiwan's grid management framework imposes usage constraints during peak summer demand months, directly limiting EAF operating windows. This structural seasonal suppressor acts as a recurring Q3 demand ceiling for scrap, amplifying any cyclical weakness already present in the market.
Market participants active in the Taiwan scrap trade have anticipated lower July import volumes specifically because of this electricity-related procurement slowdown.
4. Seaborne Price Volatility Discouraging Forward Buying
The sharp HMS 1/2 80:20 price run-up through mid-May followed by a late-May reversal created an environment that is psychologically and commercially challenging for procurement teams. Mills that committed to volumes near the $361/t peak then watched prices retreat while finished steel values failed to follow the scrap price higher. This sequence tends to produce risk aversion in subsequent procurement cycles, shifting buyer behaviour toward shorter-term spot purchasing rather than advance contracting.
In addition, the influence of US tariffs and iron ore dynamics has added further uncertainty to Asian steel feedstock markets, with the broader effects of tariffs on iron ore markets creating unpredictable cost pressures that complicate procurement planning for regional mills.
The June Rebound: Restocking, Not Recovery
June 2026 imports of 158,704 tonnes represented a 12% month-on-month increase from May, a figure that might superficially suggest a demand turnaround. However, a more rigorous reading of the data reveals otherwise.
The year-on-year gain in June was just 0.7%, measured against a June 2025 baseline that was itself part of a weakening trend. The month-on-month recovery reflects a cyclical pattern well understood by traders active in Asian EAF markets: after extended periods of reduced purchasing, mills periodically re-enter the seaborne market for inventory replenishment driven by operational necessity rather than strategic demand optimism. This tactical restocking behaviour is distinct from genuine demand recovery and should not be read as a turning point.
The June semi-finished steel import figure of 360,000 tonnes (a 36% month-on-month increase) similarly reflects restock mechanics rather than fundamental improvement. Both categories moved higher in June for the same underlying reason: minimum inventory thresholds were approached following months of reduced procurement.
The next major ASX story will hit our subscribers first
H2 2026 Outlook: Navigating a Cautious Market
The forward demand picture for Taiwan's ferrous scrap market contains more headwinds than tailwinds as the second half of 2026 unfolds. Indeed, the global crude steel outlook suggests that overcapacity pressures are unlikely to ease meaningfully in the near term, reinforcing the cautious procurement stance adopted by Taiwanese mills.
Scenario Framework for H2 2026
| Scenario | Key Trigger Conditions | Near-Term Probability |
|---|---|---|
| Moderate Recovery | Downstream steel demand stabilises; scrap prices soften further to incentivise restocking | Medium |
| Continued Weakness | Electricity restrictions persist; Chinese steel export pressure maintained; weak construction | Medium-High |
| Sharp Rebound | Infrastructure policy stimulus in Taiwan; significant scrap price correction attracting opportunistic buying | Low |
The combination of post-May price weakness, summer electricity restrictions, and subdued finished steel consumption creates a challenging backdrop for Q3 procurement. Mills are broadly expected to maintain needs-based spot purchasing rather than rebuilding strategic inventory positions until market conditions improve materially.
Supply Origin Dynamics to Monitor
-
Dominican Republic and South American origins are well-positioned to consolidate their expanded market share if pricing competitiveness relative to Japan and Australia is maintained
-
Japan would require a meaningful correction in domestic scrap collection prices before it could recapture lost Taiwanese market share in a competitive way
-
Australia faces a structurally challenged path back to prior volume levels in the near term, given the depth of the H1 2026 decline and persistent logistical cost pressures
-
United States remains the dominant supplier by volume but may need further price softening to stimulate volume recovery toward prior-year levels
Frequently Asked Questions: Taiwan Ferrous Scrap Import Decline
What caused Taiwan scrap imports to drop in January-June 2026?
The primary driver was a broad-based reduction in Taiwanese steelmaking output caused by weak domestic construction and manufacturing demand. This suppressed mill utilisation rates and reduced feedstock procurement requirements across both scrap and semi-finished steel categories.
Which country supplies the most scrap to Taiwan?
The United States remains the largest single supplier, contributing 388,591 tonnes in H1 2026 (approximately 51% of total imports), despite recording a 21% year-on-year volume decline.
Why did Australian scrap exports to Taiwan collapse so sharply?
Australian volumes fell by 66.7% year-on-year to 79,261 tonnes in H1 2026, reflecting a combination of pricing competitiveness challenges relative to Atlantic Basin origins, unfavourable Pacific route freight economics, and constrained domestic scrap generation capacity.
What is driving the rise of South American scrap in Taiwan's supply mix?
Competitive pricing relative to Japanese and Australian alternatives, combined with improved logistical infrastructure for containerised scrap shipments from South American origins, allowed suppliers including the Dominican Republic to capture market share vacated by higher-priced traditional suppliers.
Will Taiwan scrap imports recover in the second half of 2026?
Near-term conditions point to continued softness through Q3, driven by summer electricity restrictions, post-May price weakness, and subdued downstream steel demand. A meaningful recovery would likely require an improvement in finished steel consumption combined with a further normalisation of seaborne scrap prices.
Why does Taiwan's electricity restriction period matter for scrap markets?
Taiwan's grid management framework limits industrial electricity consumption during peak summer demand months, directly constraining EAF operating hours. Since EAF furnaces are the sole steelmaking technology used in Taiwan's steel industry, reduced operating windows translate directly into lower scrap consumption requirements, creating a recurring and predictable seasonal demand suppressor during Q3 each year.
Disclaimer: This article contains forward-looking assessments and scenario analysis based on available market data and publicly reported trade flows. It is intended for informational purposes only and does not constitute investment advice. Commodity market conditions can change rapidly, and readers should consult independent professional advisers before making procurement or investment decisions based on the analysis presented here.
Want to Track the ASX Mining Stocks Most Exposed to Shifting Commodity Trends?
When structural shifts in global steel and ferrous scrap markets create ripple effects across the resources sector, identifying which ASX-listed companies stand to benefit — or face headwinds — requires real-time intelligence. Discovery Alert's proprietary Discovery IQ model instantly scans ASX announcements to surface significant mineral discoveries and actionable opportunities, ensuring subscribers are positioned ahead of the broader market. Explore historic discoveries and their market returns, then begin a 14-day free trial to gain an immediate edge on emerging opportunities.