June 25, 2026
Understanding the Tanker-Crude Price Connection
Maritime freight dynamics create direct pathways between shipping costs and crude oil market positioning. When tanker charter rates decline, refineries across Asia and Europe can access American crude at more competitive total delivered costs, triggering immediate shifts in procurement strategies that ripple through global energy markets.
The mechanics operate through three primary channels. First, basis arbitrage calculations adjust as U.S. crude becomes more attractive against Russian, Middle Eastern, and African alternatives when freight costs decrease. Second, refineries optimize their crude procurement through total landed cost analysis, evaluating the sum of crude purchase price, transportation, insurance, and financing costs. Finally, demand elasticity responses occur as Asian and European refiners modify their crude slates based on updated economic calculations.
Recent market data reveals this relationship in action. When VLCC rates decline by approximately $50,000 per day, the per-barrel economics improve by roughly $0.30-0.45 per barrel depending on voyage length, since a standard VLCC carries 13-15 million barrels. This seemingly modest adjustment can determine whether American crude wins contracts against competing supply sources.
The delivered cost arbitrage impact extends beyond simple transportation savings. Chinese independent refineries, Indian state-owned refiners, and European processing facilities all incorporate freight rate fluctuations into their monthly and quarterly crude purchasing decisions, creating sustained demand shifts when shipping economics favor particular supply sources.
When big ASX news breaks, our subscribers know first
Current Freight Rate Analysis: Temporary Relief or Market Correction?
January 2026 tanker markets demonstrate significant rate compression across key U.S. export corridors. The U.S. Gulf Coast to Asia shipping route, historically expensive due to distance factors, has experienced notable cost reductions, while transatlantic routes to European markets show similar improvements. Furthermore, the oil price rally has intensified these shipping dynamics.
Current Shipping Route Performance:
| Route | Rate Decline | Impact on Competitiveness |
|---|---|---|
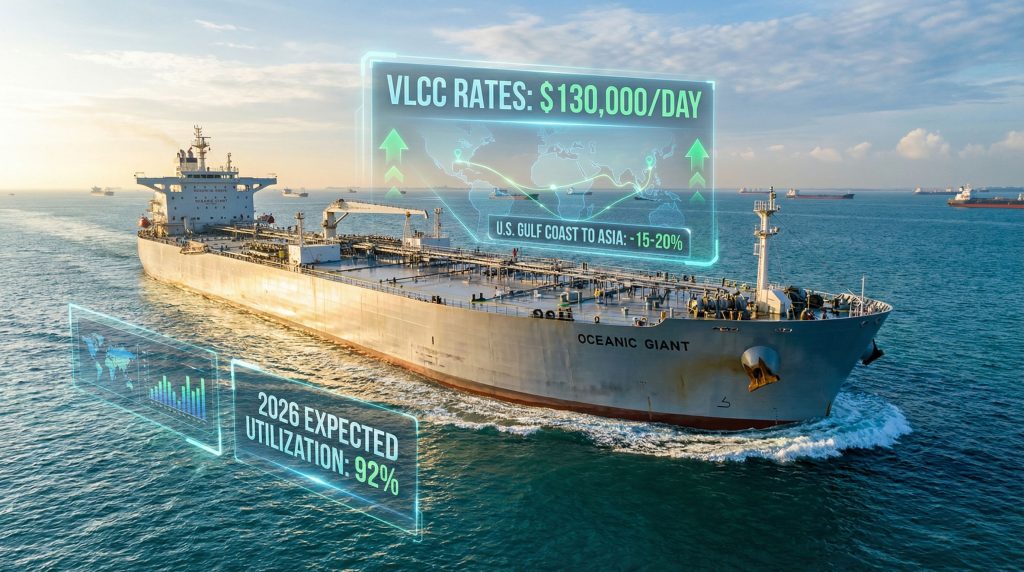
| U.S. Gulf Coast to Asia | 15-20% from December peaks | Enhanced WTI export margins |
| U.S. Gulf Coast to Europe | 12-18% from recent highs | Improved Brent-WTI arbitrage |
| U.S. West Coast to Asia | 10-15% from Q4 2025 levels | Better Alaska North Slope positioning |
Market data from Lloyd's List documented a dramatic 20% single-day drop in VLCC rates between December 19-22, 2025, bringing rates to $83,882 per day. However, these levels remained at their highest since the spring 2020 floating storage boom, indicating that even this relief maintains elevated historical comparisons.
The year-to-date rate surge of 467% according to Bloomberg estimates reflects extreme market tightness. This figure, based on Baltic Exchange and Spark Commodities data, demonstrates how constrained tanker availability drove rates to unprecedented levels throughout 2025.
Technical Factors Behind Rate Volatility
Several operational dynamics explain the current freight environment. Seasonal demand patterns during November-January typically reduce shipping requirements as Asian refineries conduct maintenance and reduce crude imports. This creates temporary vessel availability without fundamental fleet expansion.
Rate compression mechanics operate when idle vessels prompt owners to reduce charter costs to secure cargo. The Baltic Exchange Tanker Route indexes reflect these daily bid-ask spreads, with lower fleet utilization translating directly into downward rate pressure.
The phenomenon of maiden voyage anomalies provides stark evidence of previous market extremes. Six new Very Large Crude Carriers made empty maiden journeys in 2025 rather than loading profitable gasoline cargoes, indicating spot rates exceeded $120,000+ per day. Standard industry practice involves loading gasoline on maiden voyages, making empty repositioning economically justified only by exceptionally high crude rates at destination ports.
Why Tanker Market Fundamentals Favor Higher Rates in 2026
Structural constraints across the global tanker fleet create sustained upward pressure on freight rates despite temporary seasonal relief. Fleet utilization projections indicate 2026 supertanker utilization will reach 92%, the highest level in seven years, compared to 89.5% in 2025. In addition, oil price movements continue to influence shipping demand patterns.
Fleet Capacity Constraints:
- 2026 Expected Utilization: 92% (seven-year high)
- 2025 Average Utilization: 89.5%
- Vessels Over 15 Years: 44% of global fleet
- Sanctioned Vessels (15+ years): 18% of aged fleet
Fleet Age Demographics Impact
Aging fleet dynamics compound availability constraints. Oil companies increasingly reject vessels exceeding 15 years due to stricter safety requirements and corporate procurement policies. With 44% of the global tanker fleet aged 15 years or older, this creates a "cliff effect" where vessel utilisation drops sharply past the 15-year threshold.
Of vessels in the 15+ year category, 18% operate under sanctions according to tanker major Frontline, effectively removing approximately 7.92% of the total global fleet from commercial circulation. This dual impact of aging and sanctions creates artificial scarcity supporting elevated rates.
Sanctions-Related Vessel Removal Process
The mechanics of sanctions enforcement directly reduce available tonnage. When the Office of Foreign Assets Control (OFAC) designates specific vessels, they cannot accept cargoes destined for U.S. markets or traded by U.S. entities. This removes vessels from commercial circulation permanently.
Recent enforcement actions intensified these constraints. The capture of the Russian-flagged tanker "Bella 1" in the North Atlantic during the first week of January 2026 demonstrates escalating maritime compliance risks. Such actions reduce effective fleet capacity while increasing operational costs for remaining vessels through enhanced due diligence and routing restrictions.
U.S. Crude Grade Performance Under Changing Freight Dynamics
American crude grades respond differently to freight rate changes based on their quality specifications and pricing structures. Light, sweet U.S. crude grades benefit disproportionately from improved shipping economics due to their premium pricing versus heavier, sour alternatives. However, global tariff impacts continue to shape export competitiveness.
When freight costs decline, the total delivered cost advantage becomes more pronounced for premium grades. Refineries can justify paying higher wellhead prices for light, sweet crudes when transportation savings offset the premium, creating sustained demand for grades like West Texas Intermediate and Louisiana Light Sweet.
Conversely, higher-sulfur U.S. crude grades face additional competitive pressure from potential Venezuelan crude market re-entry. This creates a bifurcated market where tanker rate relief boosts U.S. crude competitiveness for premium grades while challenging lower-quality barrels that must compete against both transportation costs and alternative heavy crude supplies.
Regional Supply Growth Impact
OPEC+ export expansion drives structural tanker demand increases as additional crude production requires maritime transport to reach global markets. Similarly, U.S. production growth creates sustained export cargo demand, establishing a fundamental floor for tanker services.
This combination of supply growth from multiple regions ensures sustained competition for available vessel capacity, supporting elevated freight rates even during periods of temporary market softness.
Technical Analysis: Market Structure and Rate Sustainability
Very Large Crude Carrier (VLCC) economics demonstrate the extremes of current market conditions. Daily charter rates reaching $130,000 per day represent significant premiums over historical averages, with even moderated rates remaining substantially above 2025 levels.
The utilisation rate calculation provides insight into market tightness. At 92% utilisation, only 8% of the available fleet sits idle, constraining downward rate flexibility. Historical comparisons show this approaches 2019 levels, before the 2020 floating storage boom temporarily inflated utilisation rates. Furthermore, falling tanker rates temporarily boost crude export competitiveness.
New Build Delivery Constraints
Fleet replacement dynamics indicate continued capacity constraints. Limited new tanker construction relative to retirement rates suggests ongoing pressure on available tonnage. Shipyard delivery schedules show insufficient new vessels to offset both aging fleet retirements and sanctions-related removals.
Vessel removal calculations quantify the supply constraint. With approximately 700-750 VLCCs globally, the estimated 20-30 vessels under Russian, Iranian, or Venezuelan restrictions represent roughly 3-4% of VLCC capacity directly removed from commercial service.
Regional Market Dynamics and Compliance Costs
Insurance premium adjustments add 15-25% to operational costs for sanctions-compliant vessels through enhanced due diligence requirements and elevated geopolitical risk assessments. These costs ultimately translate into higher charter rates even for compliant operations.
Routing modifications to avoid restricted areas increase voyage lengths and fuel consumption, adding operational expenses that vessel owners recover through higher day rates. The cumulative effect of compliance costs creates a structural floor beneath freight rates. Moreover, US‑China trade war effects continue to complicate shipping routes.
Market Psychology and Price Sensitivity
The relationship between tanker rates and crude demand exhibits clear price elasticity thresholds. When VLCC rates exceed $150,000 per day for extended periods, U.S. crude export economics become challenged, though specific thresholds vary by crude grade and destination market pricing.
Demand elasticity responses create natural market balancing mechanisms. Sustained high freight costs eventually dampen oil demand by increasing delivered prices to end consumers, though this process typically requires several months to manifest fully.
The next major ASX story will hit our subscribers first
Strategic Implications for Energy Markets
Rate transmission timelines typically manifest within 2-4 weeks as traders adjust arbitrage calculations and refiners modify procurement strategies based on updated delivered cost economics. This relatively quick adjustment period means tanker rate relief boosts U.S. crude competitiveness almost immediately.
American crude producers must navigate freight rate volatility through strategic shipping partnerships and flexible marketing arrangements. Long-term charter agreements provide cost certainty but limit opportunistic benefits during periods of market softness, requiring careful balance between risk management and profit optimisation. Additionally, US tariffs and inflation add complexity to export planning.
The forward curve expectations from shipping derivatives markets suggest sustained elevation in freight rates throughout 2026, despite periodic relief periods. This indicates that current rate moderation represents temporary seasonal adjustment rather than fundamental market correction.
Investment and Market Strategy Considerations
Arbitrage window identification becomes crucial for crude oil traders and refineries seeking to optimise procurement costs. The timing of tanker charter bookings relative to crude purchase commitments can significantly impact profitability.
Regional refinery sourcing strategies must incorporate freight rate volatility into medium-term planning. European and Asian refineries increasingly evaluate crude procurement on total delivered cost basis rather than simple wellhead pricing, creating opportunities for American crude when shipping economics align favourably.
Outlook: Balancing Freight Costs and Market Fundamentals
Current tanker rate relief provides temporary competitive advantages for U.S. crude exports, but underlying market fundamentals suggest this benefit may prove short-lived. The combination of fleet utilisation approaching 92%, ongoing sanctions enforcement, and aging fleet constraints supports elevated shipping rates throughout 2026.
Seasonal demand recovery expected in February and March will likely reverse recent rate moderation as Asian refineries return from maintenance and increase crude imports for spring refining campaigns. This seasonal upturn, combined with structural fleet constraints, points toward renewed rate pressure.
The sanctions enforcement trajectory remains a critical variable. Additional vessel designations or intensified compliance requirements could further tighten available capacity, supporting higher rates despite periodic demand fluctuations.
Disclaimer: This analysis involves forecasts and market projections that inherently contain uncertainty. Tanker rate movements depend on multiple variables including geopolitical developments, seasonal demand patterns, and regulatory changes that may not unfold as anticipated. Readers should conduct independent analysis before making investment or operational decisions based on freight market projections.
Successful navigation of volatile freight markets requires understanding both immediate cost impacts and longer-term structural constraints. While tanker rate relief boosts U.S. crude competitiveness temporarily, the fundamental supply-demand imbalance in shipping capacity suggests elevated rates will persist as the dominant market theme throughout 2026.
Looking for Investment Opportunities in Energy Markets?
Discovery Alert's proprietary Discovery IQ model delivers real-time alerts on significant ASX mineral discoveries, including energy and resource companies that could benefit from shifting global commodity dynamics. With tanker rates and crude oil markets creating new arbitrage opportunities, subscribers gain immediate insights into actionable trading prospects across the energy sector, positioning themselves ahead of broader market movements through Discovery Alert's comprehensive discoveries platform.