July 17, 2026
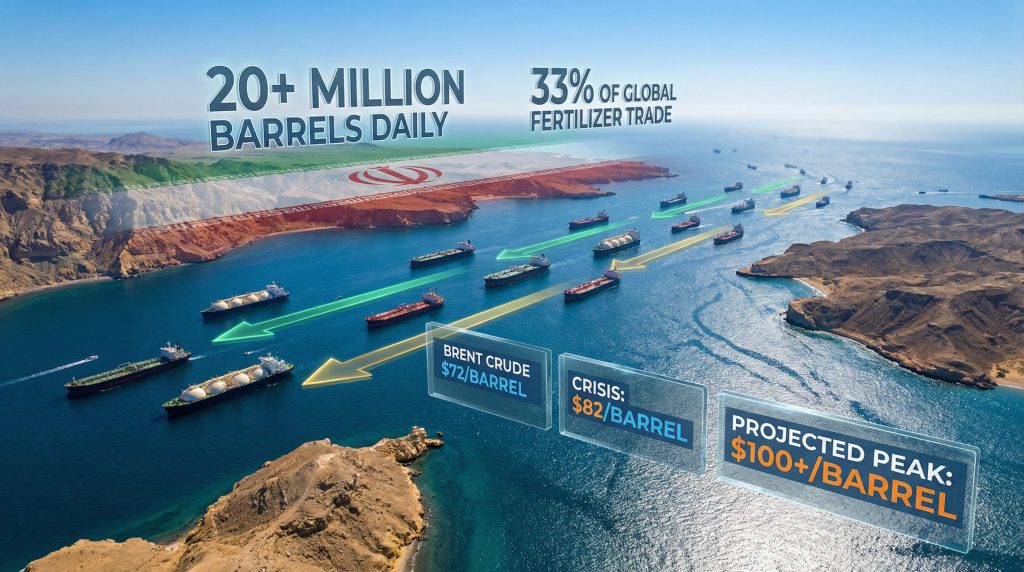
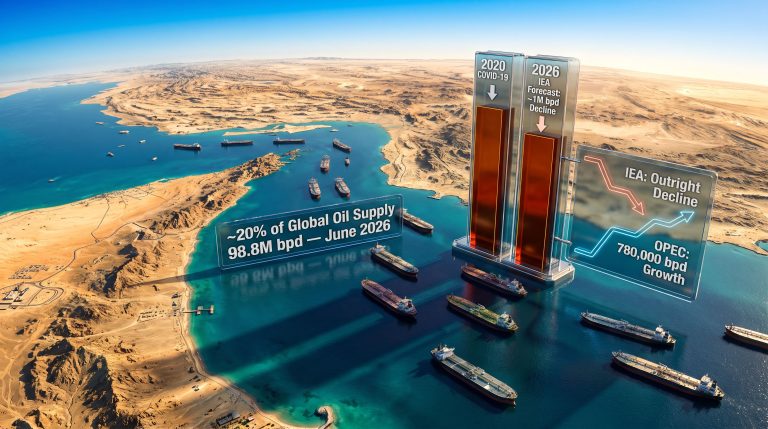
The global energy infrastructure remains critically vulnerable to disruptions in key maritime passages, with tanker traffic disruption Strait of Hormuz representing the most significant threat to worldwide petroleum supply chains. This narrow waterway facilitates approximately 20-21 million barrels per day of crude oil and petroleum products, creating cascading risks throughout interconnected energy markets when operational constraints emerge.
Geographic Bottlenecks: Understanding Critical Maritime Passages
Physical Infrastructure and Navigational Constraints
The world's energy security hinges on several narrow maritime corridors, with the Strait of Hormuz representing the most critical chokepoint in global energy transport. This 54-nautical-mile waterway between Iran and Oman facilitates the movement of approximately 20-21 million barrels per day of crude oil and petroleum products, accounting for roughly 21% of global petroleum trade according to the U.S. Energy Information Administration.
Furthermore, the physical constraints of these waterways create inherent vulnerabilities:
- Narrow shipping lanes: Only two 2-nautical-mile-wide channels separated by a buffer zone
- Deep-draft vessel requirements: VLCCs (Very Large Crude Carriers) require precise navigation
- Traffic density: Approximately 15,000-20,000 vessel transits annually
- Limited maneuvering space: Restricted ability to avoid potential threats
Regional Export Dependencies and Alternative Route Limitations
Qatar's position as a major LNG exporter demonstrates the concentrated risk in regional energy infrastructure. The country's Ras Laffan facility processes 10-12% of global LNG trade through Hormuz, according to the International Gas Union. When tanker traffic disruption occurs in the Strait of Hormuz, these volumes must seek alternative routes with significantly higher costs and extended transit times.
Alternative routing analysis reveals severe capacity constraints:
| Route Option | Additional Transit Time | Capacity Limitations |
|---|---|---|
| Cape of Good Hope | 14-21 days | Limited VLCC availability |
| Saudi East-West Pipeline | N/A | 5 million bpd maximum |
| UAE Abu Dhabi Pipeline | N/A | 1.5 million bpd capacity |
In addition, the fertilizer trade adds another layer of complexity, with 33% of global seaborne fertilizer movements transiting through Hormuz, connecting Gulf producers to Asian and European agricultural markets. This dependency creates food security implications that extend far beyond energy considerations.
When big ASX news breaks, our subscribers know first
Crisis Escalation: From Risk Assessment to Operational Shutdown
Military Action Thresholds and Market Response Patterns
Historical analysis reveals predictable escalation patterns in maritime chokepoint disruptions. The transition from elevated risk to operational shutdown follows established timelines based on insurance market dynamics and shipping company risk tolerance levels. Current trade war oil impact assessments highlight similar vulnerability patterns across global supply chains.
Key escalation thresholds include:
- 24-48 hours: Insurance war risk premiums increase 10-100 times baseline rates
- 72 hours: Sustained military action triggers structural supply chain adjustments
- One week: Alternative routing protocols fully activated across major shipping lines
During the Iran-Iraq War's "Tanker War" period (1980-1988), approximately 430 merchant vessels were attacked over eight years. Insurance costs for Gulf tankers increased roughly 10-fold, while daily crude production from the region declined from 5 million bpd to approximately 2-2.5 million bpd during peak conflict periods.
Insurance Market Dynamics and Coverage Suspension
War risk insurance represents the critical mechanism through which geopolitical tensions translate into operational shipping decisions. Standard insurance for Hormuz transits typically costs $500-800 per $100,000 of vessel value. During crisis events, these premiums can spike to $5,000-8,000+, effectively pricing out commercial operations.
The insurance industry's role in chokepoint vulnerability extends beyond simple cost calculations. When Protection & Indemnity clubs suspend coverage entirely, commercial shipping becomes operationally impossible regardless of cargo value or strategic importance.
Shipping company decision-making protocols typically trigger rerouting when:
- Insurance premiums exceed 2-3% of transit value
- Two or more incidents occur within 48-hour windows
- Maritime authorities issue formal war risk warnings
- Vessel tracking shows >50% traffic reduction through affected waterways
Energy Market Price Discovery During Supply Disruptions
Immediate Volatility and Structural Repricing Phases
Energy markets exhibit distinct behavioural patterns during supply route disruptions, characterised by two sequential phases of price adjustment. The immediate volatility phase occurs within 15-30 minutes of major incidents, driven by algorithmic trading and position adjustments. Comprehensive oil price rally analysis demonstrates how market mechanisms respond to supply constraints.
Historical crisis response data shows consistent patterns:
- Initial reaction (2-4 hours): 5-15% price spikes
- Secondary adjustment (4-24 hours): Additional 3-8% movements
- Stabilisation phase (24-72 hours): Duration-based repricing
The September 2019 Saudi Aramco attacks provide a clear example: Brent crude spiked from approximately $60 to $71 per barrel (+18%) in a single trading session. However, according to reports from major news outlets, this represented the largest single-day percentage move in years according to EIA data.
Forward Curve Dynamics and Storage Economics
During supply disruptions, crude oil forward curves typically steepen as markets price in temporary shortage conditions and eventual normalisation. 30-day implied volatility increases 50-150% during crisis events, fundamentally altering options pricing and hedging strategies.
Contango premium impacts during crises:
- Near-month vs. distant-month spreads increase 50-200%
- Floating storage becomes economically attractive
- Strategic petroleum reserve releases target near-term supply gaps
- Storage facility utilisation accelerates rapidly
Natural gas markets show delayed but correlated responses, with European TTF prices exhibiting 30-60 day correlation with crude disruptions. For instance, US natural gas forecast models incorporate similar supply shock variables. LNG spot markets demonstrate stronger correlation (60-80%) within 7-14 day windows following supply shocks.
Strategic Petroleum Reserve Deployment and Coordination
Reserve Release Mechanisms and Market Impact
The U.S. Strategic Petroleum Reserve maintains approximately 714 million barrels of capacity, typically held at 60-75% utilisation. Emergency release protocols require presidential authorisation and can deliver up to 4.4 million bpd for approximately 60 days maximum sustainable rate.
Critical timing considerations for reserve effectiveness:
- Release authorisation to market delivery: 13-30 day timeline
- Optimal deployment window: Within first 7-10 days of crisis
- Coordination requirements: Multi-national synchronisation enhances impact
- Market confidence factors: Temporary vs. permanent disruption assessment
The April 2022 response to Ukraine conflict tensions demonstrated large-scale coordination, with the U.S. announcing a 180 million barrel release over six months. International Energy Agency member nations collectively maintain 1.5-1.6 billion barrels across government and industry-mandated stocks.
Reserve Quality Mix and Distribution Challenges
SPR crude typically consists of light, sweet crude similar to WTI specifications. During disruptions affecting Middle Eastern heavy crude supplies, quality mismatches can limit reserve effectiveness. Distribution from SPR storage sites to refineries optimised for different crude grades creates additional logistical complexities.
Reserve deployment strategy considerations:
- Crude quality matching with refinery configurations
- Regional distribution network capacity constraints
- Coordination with allied nation reserve systems
- Market timing to maximise price stabilisation impact
Alternative Route Analysis: Capacity and Economic Constraints
Cape of Good Hope Routing Economics
When primary chokepoints become inaccessible, energy flows must redirect through significantly longer alternative routes. Cape of Good Hope routing adds 14-21 days to most Asia-Europe energy transport, fundamentally altering supply chain economics and inventory requirements.
Additional costs and constraints include:
- Vessel repositioning: 30-50% increase in total transport costs
- Schedule reliability: Reduced predictability for delivery timing
- Port congestion: Concentration at alternative facilities
- Insurance adjustments: Modified coverage for extended routes
Pipeline Bypass Infrastructure Utilisation
Regional pipeline systems provide partial alternatives to maritime transport, though capacity limitations restrict their effectiveness during major disruptions. Saudi Arabia's East-West Pipeline can handle approximately 5 million bpd, while the UAE's Abu Dhabi Crude Oil Pipeline to Fujairah provides 1.5 million bpd capacity.
Pipeline utilisation analysis:
- Current utilisation rates: Both systems already partially utilised
- Spare capacity availability: Limited incremental throughput possible
- Infrastructure constraints: Pumping stations and terminal facilities
- Strategic reserve integration: Connection with storage systems
Regional Storage Infrastructure Under Supply Stress
Gulf State Storage Capacity and Fill Rate Analysis
Regional storage infrastructure faces rapid utilisation during export route disruptions. Saudi Arabia currently holds approximately 82 million barrels in onshore storage, representing 56% of total capacity according to Kayrros analysis. With production of 10 million bpd and typical exports of 7 million bpd, remaining storage capacity could reach maximum utilisation within 10 days of complete export blockage.
Regional storage capacity breakdown:
| Country | Current Storage | Capacity Utilisation | Days to Full |
|---|---|---|---|
| Saudi Arabia | 82 million bbls | 56% | ~10 days |
| UAE | 34 million bbls | >40% | ~12 days |
| Kuwait | 28 million bbls | >40% | ~14 days |
Floating Storage Options and VLCC Availability
When onshore storage approaches capacity, floating storage using VLCCs becomes economically attractive. Global VLCC availability fluctuates based on existing charter commitments and positioning relative to affected regions.
Floating storage considerations:
- VLCC daily charter rates: Increase 200-500% during storage demand surges
- Positioning costs: Vessel repositioning from other trade routes
- Storage duration economics: Contango premiums vs. holding costs
- Discharge facility access: Port infrastructure for eventual unloading
The next major ASX story will hit our subscribers first
Manufacturing and Industrial Supply Chain Impacts
Petrochemical Feedstock Disruption Cascades
Energy transport disruptions create cascading effects throughout industrial supply chains dependent on Gulf-sourced feedstocks. Petrochemical production facilities globally maintain 30-60 day feedstock inventories, creating vulnerability windows during extended disruptions.
Critical industrial dependencies:
- Ammonia and urea production: 33% of global trade through Hormuz
- Ethylene and propylene: Key plastics industry inputs
- Methanol: Chemical industry and fuel applications
- Sulfur: Fertiliser production and industrial processes
Agricultural Sector Vulnerability Through Fertiliser Shortages
The intersection of energy and food security becomes apparent during maritime chokepoint disruptions. Fertiliser supply interruptions affect agricultural productivity with seasonal timing criticality, as planting and growing seasons cannot be easily delayed.
Agricultural impact timeline:
- Immediate: Fertiliser price spikes and availability concerns
- 30-60 days: Planting season decision impacts
- 90-180 days: Crop yield implications begin materialising
- Annual cycle: Full harvest impact assessment
Shipping Company Adaptive Strategies
Fleet Management During Extended Crises
Major container and tanker operators maintain sophisticated risk management protocols for navigating extended disruptions. Fleet positioning strategies balance cargo delivery obligations with crew safety and vessel protection considerations.
Adaptive strategies include:
- Vessel positioning: Strategic waiting areas outside affected zones
- Charter rate adjustments: Dynamic pricing reflecting elevated risks
- Crew compensation: Hazard pay and rotation policies
- Insurance negotiations: Coverage modifications and deductibles
Technology Solutions for High-Risk Navigation
Electronic warfare capabilities in modern conflicts can degrade navigation and communication systems critical for safe maritime operations. Consequently, analysis from shipping industry sources indicates AIS tracking limitations, GPS accuracy degradation, and VHF radio interference create compound navigation challenges.
Technology adaptation measures:
- Backup navigation systems: Inertial and celestial navigation capabilities
- Communication redundancy: Satellite-based alternatives to VHF systems
- Enhanced lookout procedures: Visual and radar-based collision avoidance
- Port coordination protocols: Alternative check-in and traffic management
Historical Crisis Precedents and Response Evolution
Iran-Iraq War Shipping Disruption Lessons
The 1980s Tanker War provides the most comprehensive historical precedent for sustained maritime chokepoint disruption. Insurance market evolution since this period has created more sensitive response mechanisms, with coverage suspension occurring more rapidly than in previous decades.
Key lessons from historical precedents:
- Duration expectations: Markets initially underestimate conflict persistence
- Insurance market memory: Premium structures reflect previous loss experiences
- International intervention: Naval escort effectiveness and limitations
- Economic adaptation: Alternative supply chain development over time
Comparative Chokepoint Analysis
Other critical waterways provide comparative context for understanding disruption dynamics. The Suez Canal's 2021 blockage demonstrated rapid supply chain adjustment capabilities, though energy transport represents higher stakes than general containerised cargo. Current crude oil market update analyses incorporate lessons from multiple chokepoint scenarios.
Chokepoint comparison framework:
- Suez Canal: 12% of global trade, alternative routes available
- Malacca Strait: 25% of traded goods, longer alternative routes
- Panama Canal: Limited energy impact, capacity constraint focus
- Strait of Hormuz: 20% of petroleum trade, limited alternatives
Investment Strategy Frameworks During Energy Crises
Energy Sector Valuation During Supply Constraints
Supply disruptions create asymmetric value impacts across energy sector segments. Upstream producers benefit from price premiums while maintaining production, refining margins expand due to product shortages, and transportation companies experience both opportunity and operational challenges.
Sector-specific investment implications:
- Upstream producers: Margin expansion with continued production capability
- Refining operations: Crack spread widening during product shortages
- Pipeline operators: Strategic value enhancement as alternative routes
- Tanker companies: Charter rate spikes offset by utilisation concerns
Commodity Trading Strategy Development
Professional commodity trading during supply disruptions requires sophisticated understanding of storage economics, forward curve dynamics, and cross-commodity relationships. Contango vs. backwardation patterns shift rapidly as market participants reassess supply duration expectations.
Trading strategy considerations:
- Storage play profitability: Contango premiums vs. holding costs
- Cross-commodity arbitrage: Crude oil vs. refined products vs. natural gas
- Geographic arbitrage: Regional price differentials and transport costs
- Options strategies: Volatility expansion and skew adjustments
Long-Term Structural Market Evolution
Permanent Trade Route Diversification Trends
Extended disruptions catalyse permanent changes in global energy trade patterns. Infrastructure investments in alternative export routes, strategic partnership developments, and supply chain redundancy building create lasting market structural shifts. The OPEC production outlook reflects these evolving strategic considerations.
Structural change indicators:
- Pipeline capacity expansion: Bypass route development
- Port infrastructure investment: Alternative loading facilities
- Strategic partnership formation: Supplier diversification agreements
- Technology deployment: Enhanced navigation and safety systems
Risk Pricing Evolution in Energy Markets
Insurance market structural changes following major disruptions create permanent risk premium adjustments. Energy contract terms adapt to incorporate force majeure considerations, and international maritime law development addresses modern conflict scenarios.
Market structure evolution:
- Insurance underwriting: Enhanced risk assessment methodologies
- Contract standardisation: Force majeure clause refinement
- Regulatory framework: International cooperation mechanisms
- Technology integration: Real-time risk monitoring systems
Strategic Scenario Planning Applications
Probability-Weighted Outcome Modeling
Strategic scenario planning requires quantitative frameworks for assessing disruption probabilities and impact magnitudes. Short-term resolution scenarios (1-4 weeks) carry different investment and operational implications than extended disruption frameworks (1-6 months) or permanent trade route alterations.
Scenario probability assessment:
- Short-term resolution (1-4 weeks): 40-60% probability in typical conflicts
- Extended disruption (1-6 months): 20-30% probability, higher economic impact
- Permanent alteration: <10% probability, fundamental market restructuring
Preparedness Framework Development
Organisations across energy, manufacturing, and financial sectors benefit from systematic preparedness frameworks addressing chokepoint disruption scenarios. Early warning systems, multi-stakeholder coordination protocols, and adaptive capacity building create competitive advantages during crisis periods.
Framework development elements:
- Risk monitoring systems: Real-time geopolitical and operational tracking
- Response protocol standardisation: Predetermined decision trees and authorities
- Stakeholder coordination: Government, industry, and international partnerships
- Adaptive capacity: Flexible operations and alternative strategy preparation
However, tanker traffic disruption Strait of Hormuz scenarios require continuous monitoring and adaptive planning across all stakeholder groups. The interconnected nature of global energy systems means that disruption preparedness extends beyond immediate operational considerations to encompass strategic positioning for long-term market evolution.
Disclaimer: This analysis is for educational purposes and should not be considered as investment advice. Energy market disruptions involve significant risks and uncertainties. Past performance does not guarantee future results. Readers should consult qualified professionals before making investment decisions.
Ready to Capitalise on Energy Market Disruptions?
Energy supply disruptions create exceptional opportunities for informed investors to profit from volatility and strategic positioning. Discovery Alert's proprietary Discovery IQ model delivers real-time alerts on significant ASX mineral discoveries, empowering subscribers to identify actionable opportunities in energy and resource sectors ahead of broader market movements. Begin your 14-day free trial today to gain immediate access to market-leading insights during these critical periods.