
July 15, 2026
The Macro Case for Hard Assets Is No Longer a Fringe View
When the architecture of global monetary systems begins to shift, commodity markets are often the first to register the strain. Across multiple economic cycles, the pattern has repeated: sovereign debt expands, real interest rates compress, currencies weaken, and tangible assets quietly begin repricing upward. The current environment is not merely echoing that pattern. According to macro strategist Tavi Costa, it is amplifying it to a degree that makes the Tavi Costa macro outlook on gold silver and oil one of the more consequential frameworks for investors navigating 2025 and beyond.
Understanding why that framework matters requires stepping back from individual price moves and examining the structural forces reshaping global capital flows at a foundational level. This global monetary shift has been building for years and is now reaching an inflection point that demands serious attention from investors across all asset classes.
When big ASX news breaks, our subscribers know first
Why the Dollar's Trajectory Is the Central Variable for Commodities
The Debt Servicing Trap and Its Implications
The conversation around U.S. fiscal sustainability has intensified as debt servicing costs have climbed to approximately 5% of GDP, a level that has historically crowded out productive government expenditure. This is not simply a budget allocation problem. When an increasing share of government revenue is absorbed by interest payments, the remaining capital available for infrastructure, defence, and growth-oriented spending shrinks accordingly.
Costa frames this as a structural constraint rather than a cyclical inconvenience. The comparison to European economies is illustrative. Most eurozone members, excluding Italy, are servicing sovereign debt at roughly 1 to 2% of GDP, providing marginally more policy flexibility. Japan sits in a separate category entirely, having suppressed yields through aggressive yield curve control, which has transferred the stress directly into the yen rather than the bond market.
The table below summarises the comparative debt servicing landscape across major economies in 2025:
| Economy | Debt Service as % of GDP (Est. 2025) | Primary Risk |
|---|---|---|
| United States | ~5% | Fiscal crowding out, dollar debasement |
| European Average (ex-Italy) | ~1-2% | Limited but moderate policy room |
| Japan | Near-zero (yield-controlled) | Currency depreciation pressure |
Why Rate Hikes Are a Structural Bluff
Costa's position is direct: any meaningful tightening cycle in the current debt environment is structurally implausible. The system simply cannot tolerate the compounding cost of higher rates when debt servicing already consumes this proportion of economic output. In his view, the Federal Reserve's hawkish signalling has outpaced what the underlying leverage in the financial system can absorb, and the more probable outcome is rate cuts rather than sustained hikes.
This is not a contrarian bet made in isolation. It is grounded in the observation that the entire interest rate curve moved too far, too fast, and that the velocity of that move creates conditions for a reversal. Costa has described the hawkish policy stance from central banks as a form of communication that the market will eventually price through, at which point assets that were oversold during the tightening narrative will reassert themselves.
The biggest tailwind for metals and commodities is not a single catalyst. It is the eventual acknowledgment that the debt burden makes sustained tightening a political and fiscal impossibility.
The Dollar's Technical Position and Its Commodity Implications
Beyond fiscal arithmetic, the U.S. dollar index has been approaching a critical long-term technical support level. A sustained breach of that level would represent a generational breakdown in dollar strength, the kind of move that has historically been associated with explosive repricing across commodity markets. Costa views recent dollar strength driven by geopolitical factors, including Middle East tensions and trade flow disruptions, as temporary rather than structural.
This distinction matters enormously. If dollar strength is event-driven rather than fundamentally supported, the reversal can be sharp and its impact on commodity prices equally rapid.
Gold Price Outlook: Structural Demand, Miner Signals, and Long-Term Targets
Central Banks Are Rewriting the Reserve Asset Playbook
Central bank gold demand has shifted from a periodic phenomenon to a sustained institutional trend. For the first time since 1996, global central bank gold holdings have exceeded Treasury holdings, a development that signals a fundamental reassessment of what constitutes a reliable reserve asset in an era of record sovereign debt and dollar weaponisation through sanctions.
This institutional buying creates a structural demand floor beneath spot gold prices that did not exist in prior cycles. Even during periods of dollar strength and elevated nominal interest rates, gold has demonstrated the capacity to hold key technical levels, which itself is a signal of underlying demand resilience.
The Gold Miners Divergence: A Leading Indicator
One of the more nuanced observations from Costa's analysis concerns the behaviour of gold mining equities relative to the underlying metal. During a period when gold prices pulled back approximately 8% from recent peaks, the gold miners-to-gold ratio actually rose by roughly 30%. This divergence is significant.
Gold miners carry operational leverage to the gold price, meaning they should logically decline faster than the metal during a selloff. When they do not, it indicates that institutional capital is actively rotating into the mining sector, pricing in a resumption of the uptrend rather than a prolonged correction. Costa identifies this as one of the most reliable early signals that a breakout in the underlying metal is approaching.
Price Target Framework for Gold
| Timeframe | Price Scenario | Primary Driver |
|---|---|---|
| Near-term (already validated) | $2,900/oz threshold surpassed | Central bank demand, dollar weakness |
| Medium-term (2-3 years) | $4,500-$5,500/oz | Fed pivot, inflation reacceleration |
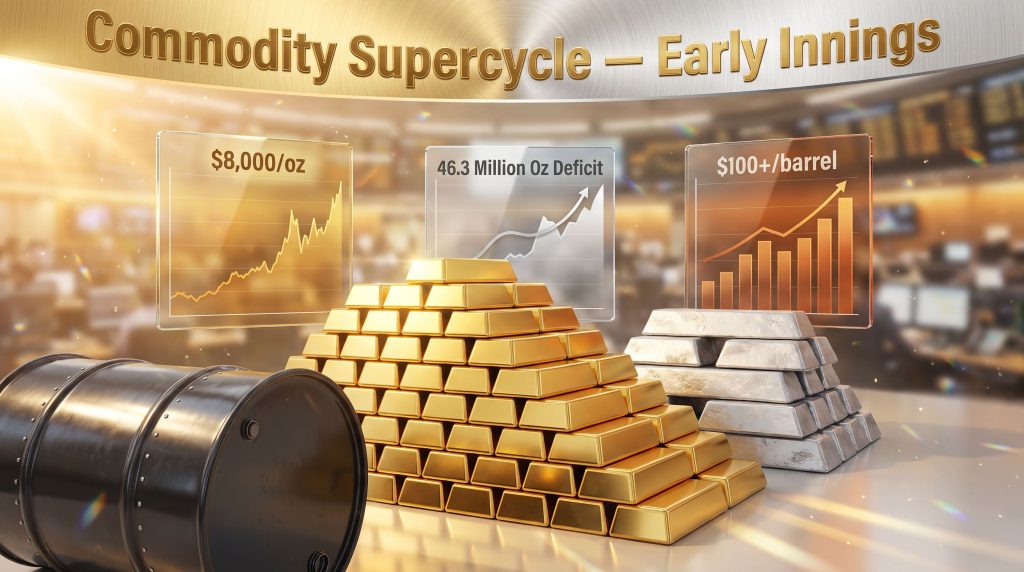
| Long-term bull case | $8,000/oz within two years | Dollar structural breakdown, reserve reallocation |
Costa's near-term thesis, which projected gold crossing $2,900 per ounce by the end of 2024, has already been validated. The longer-duration targets are predicated on a structural breakdown in the dollar and continued diversification away from Treasury holdings by sovereign wealth funds and central banks globally. Furthermore, Tavi Costa's bullish macro outlook for Canadian resource investors provides additional context on how these dynamics are playing out across North American mining markets.
Silver's Case Is Arguably More Compelling Than Gold's
Six Consecutive Annual Deficits and Counting
Silver's investment thesis rests on a different foundation than gold's. While gold is primarily a monetary metal, silver straddles two worlds simultaneously: monetary store of value and critical industrial input. That dual identity creates a demand profile that is both inelastic and growing.
The World Silver Survey 2026 projects a supply shortfall of approximately 46.3 million ounces for the current year, representing the sixth consecutive annual deficit. Solar panel manufacturing, electric vehicle components, advanced electronics, and high-frequency switching infrastructure all require silver in forms that cannot be easily substituted. Consequently, silver supply deficits are creating a structural demand engine that runs independently of investment sentiment.
The 45-Year Cup and Handle: A Technical Pattern With Generational Implications
On silver's long-term price chart, a rare 45-year cup and handle formation has developed. This is among the longest-duration versions of this technical pattern that analysts have identified in any liquid commodity market. When cup and handle formations of this magnitude resolve with a confirmed breakout, the measured move targets are typically very large, pointing in this case toward triple-digit silver prices.
Silver has already demonstrated the capacity for rapid repricing. It moved from approximately $25 to $30 per ounce to above $120 within a compressed timeframe before entering its current consolidation phase. Costa's perspective is that the level of $120 per ounce, whatever the precise peak figure, will be revisited and ultimately serve as support rather than resistance in the next major leg higher.
Costa is explicit that being invested in silver producers mining at $12 to $15 per ounce in all-in costs, against a spot price dramatically higher, represents an extraordinary margin environment that the market has not fully priced into mining equities.
Price Forecast Summary for Silver
| Scenario | Price Level | Timeframe |
|---|---|---|
| Conservative base case | $50/oz+ with authority | 12 months |
| Mid-cycle target | $80-$100/oz | 2-3 years |
| Bull case (supercycle peak) | $100-$200/oz+ | 3-5 years |
Silver is one of the few assets where both the technical setup and the fundamental supply deficit are simultaneously pointing in the same direction. That convergence is rare and historically has preceded significant price appreciation.
The Gold-to-Silver Ratio as a Contrarian Signal
The gold-to-silver ratio remains historically elevated, which on a relative basis implies that silver is significantly undervalued compared to gold. In prior commodity bull markets, silver has consistently outperformed gold during the later and more explosive phases of the cycle. If the current supercycle follows historical precedent, silver's outperformance relative to gold has not yet begun in earnest.
Oil: The Contrarian Opportunity Within the Hard Asset Complex
Why Energy May Be More Attractively Valued Than Gold Right Now
Costa makes a counterintuitive case for oil that deserves careful consideration. When oil is priced in gold terms rather than dollars, it has barely moved despite spot price volatility, suggesting that oil is structurally undervalued relative to other hard assets. The energy sector's weighting within the S&P 500 sits near historic lows, reflecting years of capital flight driven by ESG mandates, poor cycle returns, and investor fatigue.
That underweighting is precisely what makes it interesting. When institutional capital begins rotating back into energy, the reallocation can be disproportionately large relative to the sector's current size within major indices. For a deeper examination of how these dynamics are playing out, current oil price trends provide important context for understanding the near-term supply and demand picture.
Supply Dynamics: Rigs, Reserves, and Rerouted Flows
U.S. drilling activity has declined meaningfully from post-pandemic highs. Strategic Petroleum Reserve drawdowns have left emergency stockpiles at levels not seen since the 1980s and 1990s. These factors create a structural vulnerability in the event of future supply disruptions.
Costa offers an intellectually honest assessment of oil's recent behaviour. The price spike toward $120 per barrel followed by a retreat toward $70 was not purely driven by fundamental supply-demand shifts. A significant portion of oil flows that were assumed to be disrupted by Middle East tensions were rerouted through alternative channels at volumes that many analysts, including Costa himself, underestimated.
He acknowledges that his initial analysis, like that of most market participants, overestimated the impact of Strait of Hormuz disruptions because it did not adequately account for the volume of oil finding alternative routes. This kind of analytical transparency is rare and instructive for investors building their own commodity frameworks. In addition, his broader resource market analysis is detailed in this in-depth interview covering his full commodity thesis.
The AI Infrastructure Demand Wildcard
The accelerating build-out of artificial intelligence data centre infrastructure represents a demand variable that conventional commodity models have not fully incorporated. AI infrastructure is both capital-intensive and energy-intensive at a scale that creates persistent upward pressure on electricity consumption, cooling system requirements, and the construction materials that support both. This demand is structurally different from traditional cyclical energy consumption and compounds over time as AI adoption broadens.
Oil Price Scenarios
| Scenario | Price Target | Timeframe | Key Trigger |
|---|---|---|---|
| Base case recovery | $85-$95/barrel | 12-18 months | Dollar weakness, inventory draws |
| Bull case | $100+/barrel | 2-3 years | Supply shock, AI demand surge |
| Bear case (extended digestion) | $65-$75/barrel | 6-12 months | Demand softness, unofficial supply flows |
Navigating the Commodity Supercycle Through Rotational Thinking
Not All Resources Rise Together
One of the more sophisticated elements of Costa's analytical framework is the recognition that commodity bull cycles are rotational rather than simultaneous. Different resource classes move through phases of leadership and consolidation at different times, and identifying where each sits within that rotation is central to portfolio construction.
His current read of the rotation landscape is structured as follows:
- Precious metals (gold, silver, platinum group metals) have already experienced a significant first leg higher and are currently in a consolidation and bottoming phase.
- Energy (oil and natural gas) is in a base-building phase, historically representing the optimal accumulation window before the next institutional push.
- Copper is hovering near all-time highs, a technical configuration that has historically preceded breakout moves when sustained.
- Agriculture has been in a multi-year sideways consolidation that Costa views as compelling for early positioning, with the potential for an explosive move as the cycle progresses.
- Platinum group metals, concentrated in Russia and South Africa, carry elevated geopolitical and supply disruption risk, with platinum's move of nearly $1,000 within a single month illustrating the repricing potential when thin markets intersect with supply shocks.
The Commodity Rotation Matrix
| Commodity Class | Current Phase | Strategic Signal | Timeframe to Watch |
|---|---|---|---|
| Gold and Silver | Consolidation, bottoming | Accumulate on weakness | 6-18 months |
| Oil and Natural Gas | Base-building | Contrarian entry window | 12-24 months |
| Copper | Near all-time highs | Breakout watch | 6-12 months |
| Agriculture | Multi-year sideways | Early positioning | 12-36 months |
| Platinum Group Metals | Digesting prior spike | Selective exposure | 12-24 months |
A Channel Approach to Entry: Avoiding the Single-Price Anchoring Trap
Costa is emphatic that anchoring to a single price level as an entry trigger is one of the most common and costly mistakes investors make in commodity markets. The practical alternative is a channel approach: defining a realistic price range, then scaling into positions across that range rather than waiting for a precise level that may never be reached.
The risk is concrete. If an investor sets a silver entry target at $50 per ounce and the metal bottoms at $60 before moving to $200 over three years, the entire cycle is missed because of a rigid framework that commodity markets rarely respect. Metals in particular do not behave as cleanly as technical models predict, and the cost of being too precise is often the cost of missing the move entirely.
Commodity markets bottom as a process, not at a precise price point. Investors who wait for a specific number risk watching the entire cycle move without them. A flexible, range-based accumulation strategy is far more consistent with how these markets actually behave.
The next major ASX story will hit our subscribers first
How Investors Can Position for What Comes Next
Building a Hard Asset Portfolio With Operational Leverage
The practical implementation of the Tavi Costa macro outlook on gold silver and oil suggests a tiered approach to hard asset exposure:
- Core foundation: Physical gold and senior producers as the primary inflation hedge and dollar debasement play, offering direct exposure without operational complexity.
- Leveraged exposure through miners: Mining equities provide operational leverage to underlying commodity prices, where a 10% move in gold can translate to a 30 to 50% move in well-positioned producers, without the margin call risk associated with derivatives.
- Tactical contrarian bet: Energy equities and oil-linked instruments during the current base-building phase, positioned for asymmetric upside when institutional capital rotates back into the sector.
- Duration play: Agricultural commodity exposure as a longer-duration, lower-correlation position within a broader commodity basket, capitalising on the multi-year sideways consolidation that typically precedes explosive moves.
Risk Management Principles That Align With Supercycle Dynamics
- Avoid single-price anchoring as an entry trigger. Define a range and accumulate across it.
- Recognise that sentiment extremes, both bullish and bearish, are among the most reliable contrary indicators in commodity markets.
- A 6 to 12-month window following major commodity selloffs has historically represented one of the strongest risk-adjusted entry points across the asset class.
- Leverage through mining equities rather than debt instruments preserves upside while limiting the binary risk of margin-related forced exits.
The Tavi Costa macro outlook on gold silver and oil ultimately converges on one central conviction: the structural forces driving this commodity supercycle are not temporary. They are the product of decades of monetary policy decisions that cannot be unwound without significant repricing across hard assets. However, understanding the rotational nature of that repricing is what separates disciplined investors from those who arrive too early, anchor to the wrong price, and exit before the cycle matures.
Disclaimer: This article is intended for informational and educational purposes only and does not constitute financial advice. All price targets, forecasts, and scenarios discussed represent the analytical perspectives of Tavi Costa and should not be interpreted as investment recommendations. Commodity markets carry significant risk, and past performance of any asset class does not guarantee future results. Readers should conduct their own due diligence and consult a licensed financial adviser before making any investment decisions.
Want to Know Which ASX Mineral Discoveries Could Benefit From a Hard Asset Supercycle?
Discovery Alert's proprietary Discovery IQ model scans ASX announcements in real time, instantly identifying significant mineral discoveries across gold, silver, and energy commodities — translating complex data into actionable opportunities before the broader market reacts. Explore historic discoveries and their exceptional returns, then begin your 14-day free trial at Discovery Alert to position yourself ahead of the next major move.