
August 8, 2026
When Markets Confirm What Charts Already Knew
Experienced traders understand a fundamental truth that separates disciplined analysis from guesswork: price levels on a chart are not arbitrary lines drawn in hope. They represent the accumulated memory of the market itself, zones where buyers previously overwhelmed sellers, or where supply crushed demand. When price returns to those zones, both sides remember, and that psychological tension produces the most meaningful market signals available to a technical analyst.
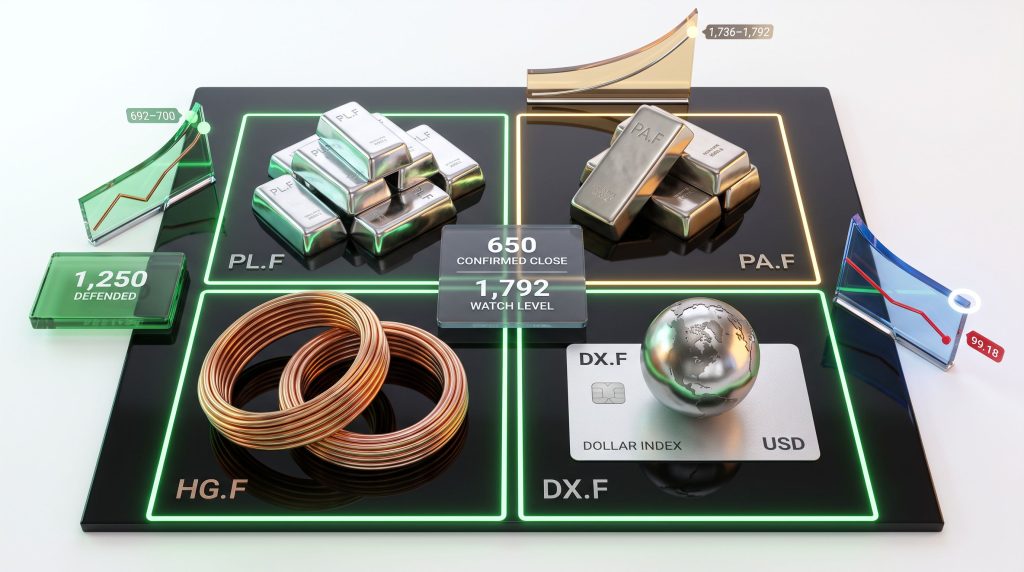
Right now, four of the most closely watched instruments in global markets — the U.S. Dollar Index, platinum, palladium, and copper — are simultaneously approaching or testing levels that carry precisely this kind of loaded historical significance. Understanding the technical analysis of dollar platinum palladium and copper at this juncture requires more than scanning a price feed. It demands a structured, multi-instrument framework that treats confirmation, not anticipation, as the governing principle.
When big ASX news breaks, our subscribers know first
The Technical Toolkit: How This Analysis Works
Before examining each market individually, it helps to understand the analytical vocabulary underpinning this framework. Several key concepts recur across all four instruments:
- Bearish gaps occur when a market opens substantially below the prior session's close, leaving an unfilled price zone on the chart. These gaps tend to act as resistance on subsequent rallies because participants who bought within that range are motivated to exit near breakeven.
- Daily close confirmation separates signal from noise. Intraday breaches of key levels are frequently reversed before settlement; only a daily close above or below a critical zone carries strategic weight.
- Fibonacci retracements and extensions provide mathematically derived reference points for probable support, resistance, and measured move targets. The 50%, 61.8%, and 161.8% levels are the most widely observed.
- Ascending and descending channels define the boundaries of trending price behaviour, with breaks above or below those boundaries signalling a potential trend acceleration or reversal.
"Confirmation is everything. A market can touch a resistance level a dozen times without triggering a signal. The signal only fires when price closes beyond it."
U.S. Dollar Index (DX.F): Sellers Hold Structure, But Support Has Not Broken
The 99.18-100.00 Battleground
The dollar index is currently compressed within a narrow decision zone, with the 99.18-99.85 range serving as the near-term battlefield. Despite three separate tests of the lower channel boundary and the 50% Fibonacci retracement level, neither has produced a clean breakdown. That persistence is notable, as repeated tests of a support level without penetration can gradually build buying pressure beneath the surface.
The psychological 100.00 level continues to function as the primary resistance ceiling. Above that, the 100.14-100.32 band — formed by the lower boundaries of prior July consolidation structures — represents a secondary resistance cluster. Until buyers reclaim 100.00 on a daily closing basis, that overhead zone remains effectively off-limits.
Momentum indicators are currently failing to generate fresh buy signals, meaning that even the rebounds the dollar has produced lack the technical follow-through needed to declare a trend reversal. Consequently, sellers retain the structural advantage. For further context on how the US dollar technical analysis interacts with metals pricing, it is worth examining the broader relationship between currency movement and commodity markets.
What Shifts the Outlook
| Scenario | Trigger Level | Projected Target |
|---|---|---|
| Bearish continuation | Daily close below 99.18 | 98.00 (head-and-shoulders target) |
| Range-bound / neutral | Price holds 99.18-99.85 | No directional bias |
| Bullish invalidation | Daily close above 100.00 | 102.00-102.50 |
A close below 99.18 would activate a head-and-shoulders pattern with a measured projection toward 98.00. Conversely, a sustained daily close back above 100.00 would neutralise the breakdown and reopen the path toward 102.00-102.10, with the 102.41-102.50 range as the broader upside objective.
The dollar's directional resolution carries macro implications. Because platinum, palladium, and copper are all priced in U.S. dollars on global exchanges, a sustained weakening of the greenback historically creates a tailwind for commodity prices by reducing the cost for non-dollar buyers. The dollar's current technical fragility is broadly constructive for the metals complex, though no directional bias should be assumed until the relevant trigger levels fire.
Platinum (PL.F): Breakout Confirmed, Gap Closure Still Pending
From Consolidation to Breakout
Platinum spent several weeks trapped inside a narrowing consolidation structure before delivering a confirmed breakout above 1,663, which simultaneously closed a prior bearish gap and triggered an exit from the orange consolidation pattern. The subsequent rally progressed almost precisely as the bullish scenario outlined in early July projected, reaching the upper boundary of the June 18 bearish gap zone at 1,736-1,792. The platinum and palladium dynamics currently unfolding reflect the kind of technically driven momentum that confirms pre-identified structural levels with notable precision.
What makes this level particularly significant is not just its current position as resistance, but the mechanism behind it. The gap at 1,736-1,792 represents a price range where sellers previously overwhelmed buyers with enough force to create a discontinuity in the chart. Until that gap is closed on a daily basis, it continues to function as an overhead supply zone.
The 1,792 Line: Why It Matters Most Right Now
Two separate bullish attempts have failed to close the upper boundary of the 1,736-1,792 gap. This is not a bearish development in itself, but it does mean the gap remains structurally active. Technical analysis treats unresolved gaps as open accounts, and until a daily close above 1,792 is recorded, the market has not yet settled that account.
A successful daily close above 1,792 would expose the next resistance cluster at 1,824-1,848, with the psychological 1,900 level as the broader upside objective.
| Timeframe | Trend Bias | Key Support | Key Resistance |
|---|---|---|---|
| Short-term | Mixed to neutral | 1,719 | 1,792 |
| Medium-term | Constructive / bullish | 1,553 | 1,824-1,848 |
| Long-term | Bullish (moving average support) | 1,226-1,298 | 1,900 |
Risk Parameters for Current Platinum Positions
Buyers maintain the technical advantage as long as platinum holds above the upper boundary of the green ascending channel. A daily close below 1,719 would weaken the bullish setup and redirect attention toward the 1,651-1,662 zone. RSI, stochastic, CCI, and Williams %R readings on shorter timeframes are currently mixed-to-bearish, while MACD remains on a buy signal.
This divergence between short-term momentum and the intermediate trend signal is worth monitoring closely. Furthermore, a review of broader precious metals market analysis suggests that platinum's gap resistance is not occurring in isolation but reflects wider supply and demand dynamics across the metals complex.
"For platinum bulls, a daily close above 1,792 is the single most important confirmation signal available right now. Without it, the bearish gap remains a ceiling rather than a launchpad."
Palladium (PA.F): Structural Floor Holds, Momentum Shifting to Buyers
The 1,250 Zone: Repeatedly Tested, Repeatedly Defended
Few price levels in the current commodity market have demonstrated the same consistent buyer conviction as the 1,250 area in palladium. Multiple tests of this zone have each resulted in a sustained recovery, signalling that market participants with meaningful capital are treating this level as a structural floor worth defending.
The most recent defence of 1,250 was particularly technically significant because buyers did not simply stabilise at support. They pushed price back above three distinct resistance barriers simultaneously:
- The upper boundary of the red declining channel
- The lower boundary of the green ascending channel
- The 1,324-1,363 bearish gap (now closed on a daily basis)
Closing the 1,324-1,363 gap is a meaningful development. It signals that the overhead supply accumulated in that price range has been absorbed, removing a layer of resistance that had been capping the recovery. In addition, independent analysis from Saxo Bank's technical review of platinum, palladium, and copper confirms that these gap dynamics are widely observed across institutional frameworks.
Key Levels for Palladium: A Full Map
| Level | Type | Significance |
|---|---|---|
| 1,250 | Support | Structural floor; repeatedly defended |
| 1,269-1,281 | Resistance (gap) | Must close to unlock higher targets |
| 1,310-1,325 | Support cluster | Secondary floor if 1,250 is breached |
| 1,388-1,430 | Resistance zone | Next upside target range |
| 1,430 | Primary upside target | Bullish scenario projection |
Downside Invalidation Thresholds
A daily close below 1,250 would reactivate bearish pressure toward 1,206, then 1,180, and potentially 1,156. Earlier analysis identified 950 as the level below which the entire recovery thesis would be neutralised. The palladium market remains technically active and confirmation above resistance is essential before treating the current rebound as a sustained directional trend rather than a corrective bounce within a larger structure.
Copper (HG.F): Textbook Breakout, Profit-Taking Creates Re-Entry Opportunity
How the Bullish Scenario Was Triggered
Copper's recent price action offers one of the clearest illustrations available of why daily closes matter more than intraday extremes. Despite volatile intraday sessions, buyers managed to close Friday's session above 650, simultaneously closing the prior bearish gap and invalidating the prevailing bearish scenario. That single closing price changed the technical structure of the market entirely.
Monday's session then opened with a fresh bullish gap in the 651-655 range. This gap absorbed selling pressure and confirmed that buyer commitment was not a temporary intraday anomaly but a sustained structural shift. The copper price rally that followed is consistent with this pattern of gap-driven momentum, where structurally confirmed breakouts tend to attract follow-through buying. Copper then broke above the orange consolidation structure, activating a bullish scenario that had been outlined weeks earlier.
Fibonacci Targets and Where Price Has Reached
The 161.8% Fibonacci extension at 675.43 was identified as the primary upside objective following the consolidation breakout. Copper subsequently reached a new high of 685.90, achieving both the minimum measured move from the consolidation and that first Fibonacci target. The next objective remains the 692-700 zone.
| Zone | Level | Type | Status |
|---|---|---|---|
| Bullish gap support | 651-655 | Active support | Intact |
| Key support cluster | 669-671 | Must hold for bullish bias | Active |
| First Fibonacci target | 675.43 (161.8% extension) | Upside objective | Achieved |
| Recent high | 685.90 | Measured move completion | Achieved |
| Next resistance | 692-700 | Primary remaining target | Pending |
Managing Risk After the Rally
Post-breakout rallies routinely produce profit-taking pullbacks. Copper's current modest retreat fits this pattern, and it does not negate the bullish structure as long as price holds above 669-671. That zone, formed by the previously broken resistance peaks, now functions as support.
A daily close below 669 would be the first concrete signal that a deeper correction is developing rather than a routine pause. Below that, the 644.50-651.00 bullish gap zone becomes the critical test. For a broader perspective on the copper price outlook beyond the near-term, longer-dated forecasts suggest that structural demand drivers remain intact even if short-term corrections deepen. If that area fails to hold, the corrective scenario gains significant structural credibility, with the 100-day moving average and the 0.618 Fibonacci retracement at 424.50 representing the deeper technical floor.
"Copper's bullish thesis remains intact above 669-671. Traders managing long positions should treat this zone as the primary risk reference level, not a secondary consideration."
The next major ASX story will hit our subscribers first
Cross-Asset Framework: How These Four Markets Connect
Dollar Direction as a Macro Signal for Metals
The interplay between the U.S. Dollar Index and commodity prices is not a coincidence of correlation. It is a structural feature of global commodity markets. Because platinum, palladium, and copper are all denominated in U.S. dollars, dollar weakness mechanically reduces the cost for buyers operating in other currencies, which tends to expand demand and support prices.
The dollar's current technical structure — with sellers in control and momentum failing to recover — provides a broadly constructive backdrop for the metals complex. A dollar break below 99.18 that activates the head-and-shoulders target of 98.00 would likely accelerate the bullish scenarios in copper, palladium, and potentially platinum.
Conversely, a dollar reclaim of 100.00 on a daily closing basis would create headwinds. Platinum's 1,736-1,792 gap would become harder to close, copper's 669-671 support would face greater pressure, and palladium's recovery path would narrow.
Ranking Current Technical Clarity Across Instruments
| Instrument | Current Bias | Confidence Level | Primary Risk Event |
|---|---|---|---|
| Copper (HG.F) | Bullish (conditional) | High | Daily close below 669 |
| Palladium (PA.F) | Bullish (conditional) | Moderate-High | Gap at 1,269-1,281 not yet closed |
| Platinum (PL.F) | Bullish (developing) | Moderate | Gap at 1,736-1,792 unresolved |
| U.S. Dollar (DX.F) | Bearish (sellers in control) | Moderate | Rebound above 100 invalidates |
Three Scenarios for the Next Directional Phase
- Scenario A (Dollar breaks below 99.18): Head-and-shoulders activates, projecting toward 98.00. USD weakness supports commodity appreciation. Copper's 692-700 target becomes more accessible, palladium's path to 1,430 accelerates, and platinum's gap closure at 1,792 becomes easier to achieve.
- Scenario B (Dollar reclaims 100.00): Bullish invalidation for the greenback creates headwinds across the metals complex. Platinum's gap resistance becomes stickier, copper's 669-671 zone faces more severe testing, and palladium's recovery loses momentum.
- Scenario C (Dollar remains range-bound between 99.18-99.85): No cross-market catalyst from currency direction; each commodity trades on its own individual technical setup without a macro tailwind or headwind from currency markets.
Practical Decision Framework: What to Watch and When
Consolidated Trigger Table for Active Market Participants
| Instrument | Bullish Trigger | Bearish Trigger | Primary Target |
|---|---|---|---|
| U.S. Dollar (DX.F) | Daily close above 100.00 | Daily close below 99.18 | 98.00 (bear) / 102.00-102.50 (bull) |
| Platinum (PL.F) | Daily close above 1,792 | Daily close below 1,719 | 1,824-1,848 then 1,900 |
| Palladium (PA.F) | Daily close above 1,281 | Daily close below 1,250 | 1,430 |
| Copper (HG.F) | Hold above 669-671 | Daily close below 669 | 692-700 |
The Underlying Principle That Ties This Framework Together
Across all four markets, one principle recurs without exception: daily close confirmation above or below key levels separates tradeable signal from intraday noise. The copper breakout above 650 demonstrated this precisely. Traders who waited for that closing confirmation rather than acting on intraday momentum captured the full measured move to 685.90 — a move of more than five percent from the trigger level.
The same discipline applies to platinum's 1,792, palladium's 1,281, and the dollar's 100.00. In each case, the level is already identified. Moreover, the gold-silver ratio insights currently visible across precious metals suggest that this confirmation-first approach is equally applicable to the broader complex, where ratio extremes often precede significant directional moves. The only remaining variable is whether the market chooses to confirm it.
The technical analysis of dollar platinum palladium and copper presented here does not attempt to predict outcomes. It maps the specific conditions under which each directional scenario becomes structurally probable, then requires the market itself to confirm or deny those conditions before capital is deployed. Patience and process, not prediction, define the edge.
Disclaimer: This article is intended for educational and informational purposes only and does not constitute financial or investment advice. All technical levels, price targets, and scenario projections discussed herein are based on chart-based analysis and are subject to change. Past performance of technical setups is not indicative of future results. Readers should conduct their own research and consult a qualified financial adviser before making any investment decisions.
Want to Spot the Next Major ASX Mineral Discovery Before the Broader Market Does?
While technical analysis of instruments like copper, platinum, and palladium can sharpen your market timing, Discovery Alert's proprietary Discovery IQ model delivers real-time alerts on significant ASX mineral discoveries — instantly translating complex data into actionable opportunities for both short-term traders and long-term investors. Explore historic discoveries and their returns to understand the potential, then begin your 14-day free trial at Discovery Alert and position yourself ahead of the market.