
June 28, 2026
The Invisible Engine Beneath Texas Rig Count and Upstream Hiring Numbers
Before any rig turns to the right or a single upstream hire is made, something far less visible determines the outcome: operator confidence. Capital deployment in oil and gas exploration is not merely a response to current prices but a forward-looking bet on demand stability, breakeven thresholds, and risk tolerance across a multi-year horizon. Understanding what Texas rig count and upstream hiring data actually signals requires looking beneath the surface statistics and into the behavioural and structural forces that precede them.
The convergence of Baker Hughes weekly rig data, Bureau of Labor Statistics employment figures, and Texas Comptroller tax receipts in early 2026 has created an unusually clear window into the health of the state's upstream sector. However, reading these three data streams in isolation produces an incomplete picture. The real story lies in how they interact, diverge, and occasionally contradict one another.
When big ASX news breaks, our subscribers know first
Why Texas Holds a Structural Advantage No Other State Can Replicate
Texas does not merely participate in U.S. upstream oil and gas activity; it anchors it. The state's dominance stems from a combination of factors that reinforce each other in ways that are genuinely difficult for competing basins to replicate at scale.
The Permian Basin alone accounts for a disproportionate share of U.S. oil output growth, with its stacked pay zones in the Midland and Delaware sub-basins offering operators the ability to drill multiple productive horizons from a single surface location. This geological density directly compresses per-barrel finding costs and improves full-cycle economics relative to single-zone plays elsewhere.
Furthermore, beyond geology, Texas benefits from:
- One of the most developed midstream pipeline and processing networks in the world, reducing takeaway constraints that have historically bottlenecked production in other basins
- The Eagle Ford Shale offering a distinct liquids-rich complement to Permian crude, providing geographic diversification within a single state
- A mature oilfield services ecosystem concentrated in Houston, Midland, Odessa, and Corpus Christi that keeps mobilisation costs lower and lead times shorter than in less-developed basins
- The Texas Railroad Commission's long-established permitting and production oversight framework, which provides regulatory consistency and reduces uncertainty for capital planning purposes
This layered infrastructure advantage is precisely why, when operator confidence rises nationally, Texas captures a disproportionate share of incremental rig activity. The most recent Baker Hughes weekly data illustrates this dynamic in unusually stark terms.
Decoding the Baker Hughes Data: What May 2026 Rig Numbers Actually Mean
The Baker Hughes weekly rig count is one of the most widely tracked leading indicators in the North American energy sector. However, its true value lies not in any single week's reading but in the direction and concentration of changes over time. Monitoring rig count trends alongside employment data provides a far more complete analytical framework.
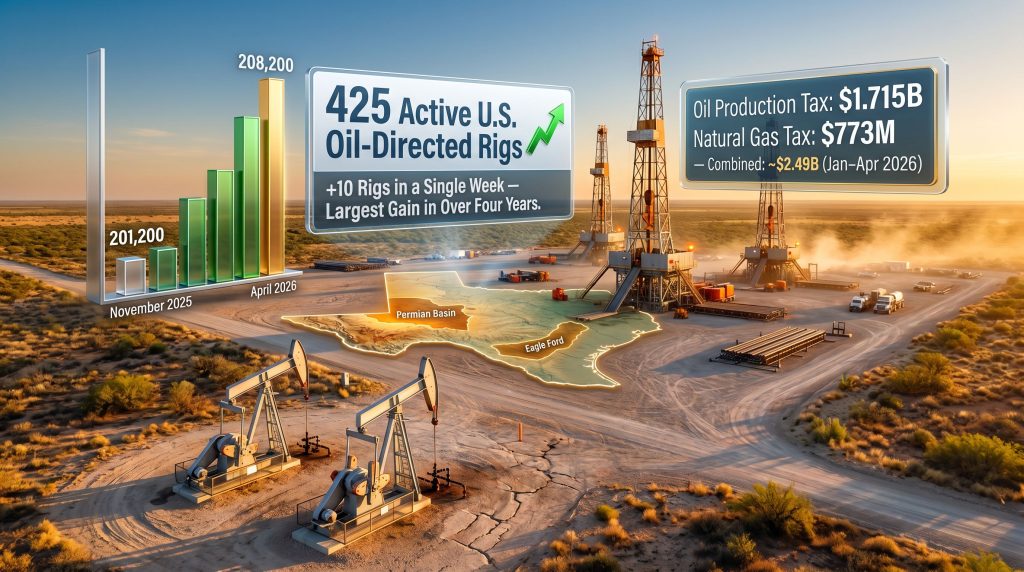
The week ending in late May 2026 produced a striking data point: all 10 of the net additions to U.S. oil-directed rigs were deployed in Texas, lifting the national oil-directed total to 425 active rigs. This represents the largest single-week gain in more than four years, a fact that carries more interpretive weight than the absolute rig count figure itself.
| Period | U.S. Oil-Directed Rigs | Texas Share | Key Driver |
|---|---|---|---|
| Q4 2025 | Declining | Majority | Softer prices, capex discipline |
| December 2025 | Modest rebound | Dominant | Price stabilisation |
| Full-Year 2025 | Essentially flat | ~65-70% | Efficiency-first operator strategy |
| May 2026 | 425 (up 10 week-on-week) | 100% of weekly gains | Demand signal improvement |
A 10-rig single-week addition is notable not because the number is enormous in absolute terms, but because it indicates that multiple operators simultaneously crossed the internal authorisation threshold to deploy capital. In practical terms, rig contracts are typically signed weeks or months before iron hits the ground, meaning that the rigs showing up in the May 2026 data represent decisions made during a period when confidence was already building.
The Baker Hughes rig count functions as a lagging confirmation of operator sentiment that was already shifting earlier in the quarter. A sudden multi-rig weekly jump, particularly concentrated in one state, suggests that a decision threshold was crossed simultaneously by multiple independent operators, which is a more meaningful signal than a gradual drift upward.
The fact that competing basins such as the Bakken and DJ Basin registered no net additions in the same week reinforces the thesis that Texas's cost structure and infrastructure density are attracting capital that might otherwise have been distributed more broadly across the Lower 48.
Texas Rig Count and Upstream Hiring: Reading Two Metrics That Don't Always Agree
One of the most important analytical distinctions in upstream labour economics is the decoupling of rig count from headcount. Through the 2015–2016 downcycle and its aftermath, the Texas upstream sector underwent a structural transformation in workforce utilisation that permanently altered the relationship between rigs turning and employees hired.
Modern pad drilling, where a single rig walks between multiple wellheads on a single surface pad without full demobilisation, reduces the crew hours required per well. Automated pipe handling systems, real-time downhole telemetry, and AI-driven efficiency tools have further compressed the labour content per rig per day. Consequently, today's 425-rig fleet operates with materially fewer workers per active rig than the same fleet count would have required in 2014.
Employment Trajectory: March Through April 2026
With that efficiency context established, the employment gains reported by TIPRO drawing on BLS Current Employment Statistics data take on a more nuanced character:
- March 2026: Texas upstream oil and natural gas employment grew by 1,800 jobs, representing the stronger of the two recent monthly gains
- April 2026: An additional 400 jobs were added, a moderation in pace but still directionally positive
- Two-month cumulative gain: 2,200 upstream positions added in the first half of the year
The deceleration from March to April warrants attention. It could reflect seasonal variation in activity scheduling, a lag between rig deployment decisions and associated service crew mobilisation, or simply the normal monthly noise in employment survey data. It does not, on current evidence, suggest a reversal of the upward trend.
The 2025 Employment Cycle as a Cautionary Reference Point
The 2025 calendar year provides a useful analytical baseline. According to reporting from the Texas Oil and Gas Association, Texas upstream employment reached 208,200 jobs in May 2025, representing a gain of approximately 2,200 positions month-over-month and roughly 5,000 year-over-year. That figure represented a multi-month high-water mark that did not hold through the year.
By November 2025, combined upstream employment had contracted by 3,500 jobs to approximately 201,200, coinciding with a period of softening rig activity and reduced job postings across the sector. A partial recovery to 203,400 jobs in December 2025 provided some stabilisation, but the full year ended essentially flat relative to its starting point.
The 2025 employment cycle demonstrates a pattern that has repeated across multiple Texas upstream cycles: rapid job growth during windows of price confidence, followed by disciplined contraction when market conditions shift. The asymmetry matters because hiring tends to accelerate faster than it decelerates, creating skill shortages at cycle peaks and talent displacement at troughs.
This historical context suggests that the 2,200 jobs added in March and April 2026 represent genuine momentum. However, they should be viewed against the possibility of the same late-cycle deceleration that characterised 2025 if global demand signals deteriorate.
The Fiscal Architecture: How Oil and Gas Tax Revenue Flows Through Texas
The economic significance of Texas upstream activity extends well beyond direct employment. The production tax revenue generated by oil and natural gas operations flows into state budget mechanisms that fund services consumed by all Texans, regardless of their proximity to producing regions.
| Revenue Category | Amount (January to April 2026) |
|---|---|
| Oil Production Tax Revenue | $1.715 billion |
| Natural Gas Production Tax Revenue | $773 million |
| Combined Total | ~$2.49 billion |
These figures, reported by TIPRO drawing on Texas Comptroller of Public Accounts data, represent just four months of collections. On an annualised basis, the implied run rate exceeds $7 billion in combined production tax revenue, a sum with meaningful implications for the state's ability to fund public education, higher education institutions, transportation infrastructure, and other essential services.
Beyond direct tax contributions, royalty payments flow to Texas landowners whose properties sit above producing formations. In the Permian Basin and Eagle Ford, where a significant proportion of mineral rights remain in private hands, production growth translates into direct household income for tens of thousands of landowners ranging from individual family farmers to institutional mineral rights holders.
This royalty payment channel is an often-underappreciated element of the upstream sector's community-level economic impact. It creates a diffuse but meaningful income distribution effect that extends the benefits of drilling activity far beyond the companies and workers directly involved in production operations.
Structural Demand Forces Underpinning Renewed Operator Confidence
The renewed willingness of Texas operators to commit rig capital in early 2026 does not exist in a vacuum. Several structural demand forces are converging to make the forward production economics more compelling than they appeared during the cautious capex environment of 2025.
Electricity Demand Growth as a Durable Production Signal
Texas is experiencing a sustained surge in electricity consumption driven by several compounding factors:
- AI and data centre infrastructure is expanding rapidly across Texas, with hyperscale facilities requiring baseload power that cannot be reliably supplied by intermittent generation sources alone
- Manufacturing reshoring linked to domestic industrial policy is bringing energy-intensive production back to U.S. soil, with Texas a preferred destination given its grid, labour, and regulatory environment
- Population growth continues to outpace most other U.S. states, adding residential and commercial electricity demand year after year
Each of these demand drivers has a long tail. Data centres are not decommissioned on short cycles, manufacturing facilities operate for decades, and population trends change slowly. Operators evaluating 10-year production profiles see this demand floor as providing downside protection that was absent in earlier cycles.
LNG Export Economics and Natural Gas Drilling Incentives
The LNG supply outlook has fundamentally altered the natural gas market structure in ways that support continued Texas drilling activity in gas-producing formations. As additional liquefaction capacity comes online along the Gulf Coast, the effective demand floor for U.S. natural gas rises, reducing the risk of the extreme price collapses that previously discouraged gas-directed drilling investment.
Texas natural gas production, much of it associated gas from oil-directed wells in the Permian Basin, benefits directly from this dynamic. Rising LNG offtake creates a structural backstop for gas prices that makes the full-cycle economics of Permian oil wells more robust, since associated gas revenue contributes to overall project returns.
The next major ASX story will hit our subscribers first
What Investors and Workforce Planners Should Watch in H2 2026
Leading Indicators Worth Monitoring
For those tracking the trajectory of Texas rig count and upstream hiring into the second half of 2026, the following data series provide the most actionable forward signals:
- Baker Hughes weekly rig count releases: Watch for sustained multi-week additions above the current 425-rig baseline rather than single-week spikes, which can reflect contract timing anomalies
- Monthly BLS CES upstream employment data: A return to March 2026's 1,800-job gain pace would confirm acceleration; plateauing near April's 400-job level would suggest consolidation
- Texas Comptroller production tax receipts: Monthly updates provide near-real-time insight into both production volumes and price realisations
- TIPRO job posting data: Forward-looking hiring intent signals that typically precede actual employment changes by four to eight weeks
Three Scenarios for H2 2026
Scenario A: Sustained Expansion
Oil prices hold comfortably above operator breakeven thresholds in the $55–65 per barrel range, the rig count continues climbing toward the 450 level, and monthly employment gains return to the 1,500–2,000 range consistent with the March 2026 pace. This scenario requires stable global demand and no major OPEC+ supply influence driving prices downward.
Scenario B: Plateau and Consolidation
After the initial burst of rig additions, activity stabilises as operators test whether demand signals hold. Employment gains moderate to the 300–500 per month range, and production grows incrementally using existing infrastructure rather than requiring aggressive new rig deployment.
Scenario C: Price-Driven Pullback
A deterioration in global demand signals or unexpected supply increases triggers a price correction that pushes marginal Permian economics below operator hurdle rates. In addition, oil market demand risks from geopolitical tensions could accelerate this outcome. Rig count erodes, hiring stalls, and employment drifts back toward the November 2025 low of approximately 201,200 positions.
This scenario analysis is forward-looking and speculative in nature. Actual outcomes will depend on global commodity markets, geopolitical developments, and operator-specific capital allocation decisions that cannot be predicted with certainty.
Frequently Asked Questions: Texas Rig Count and Upstream Hiring
What is the current Texas rig count in 2026?
As of late May 2026, Baker Hughes weekly data shows that all 10 of the most recent net additions to U.S. oil-directed rigs occurred in Texas, bringing the national oil-directed total to 425 active rigs. This represents the largest single-week increase in more than four years, according to World Oil's reporting on upstream employment and drilling activity.
How many upstream jobs did Texas add in early 2026?
Texas upstream oil and natural gas employment grew by 1,800 positions in March 2026 and a further 400 in April 2026, according to BLS Current Employment Statistics data cited by TIPRO. The two-month combined gain of 2,200 jobs reinforces a directional upward trend in sector hiring.
How much production tax revenue did Texas oil and gas generate in early 2026?
Between January and April 2026, oil production taxes generated more than $1.715 billion while natural gas production taxes contributed approximately $773 million, bringing the combined total to roughly $2.49 billion across just four months, per Texas Comptroller data cited by TIPRO.
Does a rising rig count automatically mean more upstream jobs?
Not proportionally. Efficiency improvements including pad drilling, automated pipe handling, and AI-assisted wellbore optimisation mean that each active rig today requires fewer crew-hours than an equivalent rig did in the 2012–2014 era. The rig count and employment are directionally correlated but no longer move on a near 1:1 basis.
What is TIPRO and why does it matter for Texas labour data?
The Texas Independent Producers and Royalty Owners Association compiles and publishes detailed upstream employment and workforce intelligence for Texas, drawing on BLS Current Employment Statistics and Texas Comptroller data. Its reporting provides more granular state-level detail than federal datasets alone, making it an essential reference for analysts tracking Texas upstream hiring trends.
Key Takeaways: Texas Upstream at a Structural Decision Point
The confluence of data emerging from Texas in the first half of 2026 tells a coherent but conditional story:
- The 10-rig weekly addition concentrated entirely in Texas is a genuine confidence signal, not statistical noise, representing simultaneous capital deployment decisions by multiple independent operators
- Upstream employment gains of 2,200 jobs across March and April are directionally positive but must be interpreted against the 2025 precedent of mid-year acceleration followed by late-year contraction
- $2.49 billion in combined production tax revenue over four months underscores the sector's foundational role in Texas public finance, with direct implications for education and infrastructure funding
- Structural demand forces including AI data centre buildout, LNG export expansion, and manufacturing reshoring are providing a more durable forward demand floor than existed in previous cycles
- No single metric captures the full picture: tracking Texas rig count and upstream hiring alongside tax revenue and job posting data simultaneously provides the most complete view of sector health
Further context on Texas upstream employment trends, rig count dynamics, and North American drilling activity is available through ongoing coverage published by World Oil at worldoil.com.
Want To Catch The Next Major Mineral Discovery Before The Market Does?
While Texas rig counts and upstream hiring data reveal where capital is flowing in oil and gas, Discovery Alert's proprietary Discovery IQ model scans ASX announcements in real time to identify significant mineral discoveries the moment they are made public — turning complex geological data into actionable insights for both traders and long-term investors. Explore historic discoveries and the returns they generated, then begin a 14-day free trial to position yourself ahead of the broader market.