July 16, 2026
The Hidden Architecture of Dual-Commodity Mining: Why Chrome and PGMs Tell Different Stories at the Same Time
Most commodity investors approach mining stocks by evaluating a single price signal. When platinum rises, platinum miners benefit. When chrome weakens, chrome producers suffer. This logic, while intuitive, completely misses the structural advantage embedded in dual-commodity producers operating on South Africa's Bushveld Complex, where chrome and platinum group metals are extracted from the same reef system simultaneously. Understanding how these two revenue streams interact, diverge, and compensate for one another is the starting point for any serious analysis of Tharisa chrome prices and PGM outlook dynamics heading into 2026 and beyond.
When big ASX news breaks, our subscribers know first
Why the Bushveld Complex Creates a Structurally Unique Mining Proposition
The Bushveld Complex is not simply a geological formation — it is one of the most mineralogically concentrated layered igneous intrusions on Earth. The chromitite layers embedded within the complex carry both chrome ore and PGM mineralisation in close geological association, meaning that efficient extraction of one commodity inherently produces the other as a co-product. This is not a by-product relationship in the conventional sense. Both chrome concentrate and PGMs contribute meaningfully to revenue, which fundamentally alters the economics of production compared to single-commodity miners.
The practical consequence is a natural revenue hedge. When PGM prices face cyclical pressure, chrome cash flows provide a floor under operating margins. When chrome prices soften, as they have in the period following Q3 FY2026, elevated PGM basket prices absorb the shortfall. Furthermore, pure-play PGM producers on the Bushveld, such as Northam Platinum, Sibanye-Stillwater, and Implats, carry no equivalent buffer. Their margin structures are entirely exposed to PGM price volatility, making mid-tier dual-commodity operators like Tharisa a differentiated proposition for investors seeking Bushveld exposure with built-in commodity diversification.
"The structural cost offset available to dual-commodity Bushveld operators is a feature rarely modelled correctly in sell-side research. Chrome revenues can subsidise PGM production costs during soft PGM markets, a margin buffer that single-commodity producers simply cannot replicate."
Tharisa Chrome Prices and PGM Outlook: Reading the Current Data
Chrome Concentrate Pricing: From Strength to Correction
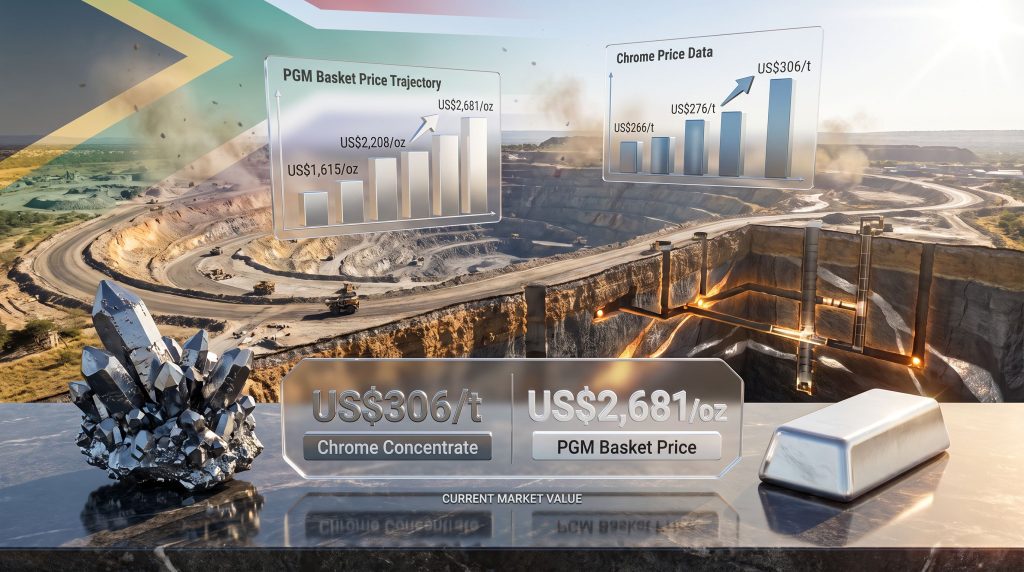
Chrome concentrate prices followed a broadly positive trajectory through the first three quarters of FY2026 before encountering near-term headwinds. The full-year FY2025 average of US$266 per tonne became the baseline from which prices climbed, reaching US$276/t in Q1 FY2026 and then accelerating to US$306/t during Q3 FY2026 — a 5.5% quarter-on-quarter increase that reflected robust Far East procurement activity.
However, prices softened following that peak, driven by a confluence of demand-side pressures rather than any structural supply deterioration. Examining PGM supply constraints alongside chrome dynamics reveals how interconnected these commodity stories truly are.
| Period | Average Chrome Price (US$/t) | Movement |
|---|---|---|
| FY2025 Full Year | US$266/t | Baseline |
| Q1 FY2026 | US$276/t | +3.8% |
| Q3 FY2026 | US$306/t | +5.5% vs. Q2 |
| Post-Q3 FY2026 | Below US$306/t | Correction phase |
Three distinct forces are compressing chrome prices in the near term, and understanding each one is critical to forming a view on the medium-term recovery thesis.
1. Stainless Steel Demand Contraction
Stainless steel consumes approximately 70 to 80% of global chrome ore demand, making it the dominant pricing determinant for metallurgical-grade chromite. Far East stainless steel demand has been running at approximately 2 million tonnes per month, a benchmark figure that market participants watch closely as an indicator of procurement urgency. The broader stainless steel market dynamics in 2025 provide important context here. When mill output targets soften even marginally, procurement managers reduce spot buying, creating immediate pricing pressure in the seaborne chrome market.
2. Middle East Geopolitical Disruption
The Middle East accounts for approximately 15% of global stainless steel consumption, a proportion large enough to move the needle on aggregate demand when procurement activity slows. Prolonged regional conflict has suppressed buying activity from this segment, consequently compounding the demand weakness already emerging from softening industrial output in other regions.
3. Post-Chinese New Year Procurement Cycle Dynamics
A less widely understood dynamic in chrome markets is the pronounced seasonality of Chinese procurement cycles. Following Chinese New Year, mill procurement managers typically enter a range-bound buying posture, waiting for clarity on demand conditions before committing to new chrome concentrate purchases. This inventory management behaviour creates a temporary demand vacuum in spot markets, amplifying price softness that might otherwise be modest.
The Ferrochrome Supply Diversion: The Medium-Term Structural Thesis
The most compelling and least widely appreciated element of the chrome price recovery argument is not on the demand side at all. A recently approved energy agreement between South African authorities and ferrochrome producers is expected to redirect a meaningful volume of raw chrome concentrate away from export markets by enabling domestic ferrochrome smelting to scale up.
As South African ferrochrome producers increase smelting capacity utilisation under improved energy cost structures, they consume more raw chromite ore domestically, leaving less available for direct export to Chinese buyers. The substitution effect is significant. Ferrochrome exports flowing to European and Chinese end users displace raw ore shipments, tightening the seaborne chromite market without any corresponding reduction in downstream stainless steel demand.
An analyst at Noah Capital has noted that as ferrochrome flows increase toward Europe and China, the volume of raw chromite ore available to Chinese import markets contracts, creating a structural tightening dynamic that demand-side analysis alone cannot explain.
Chrome Price Scenario Framework: 2026 to 2027
| Scenario | Key Assumptions | Projected Price Range |
|---|---|---|
| Bear Case | Deepening stainless steel contraction; prolonged Middle East conflict | US$240 to US$265/t |
| Base Case | Gradual demand recovery; partial ferrochrome supply diversion | US$270 to US$310/t |
| Bull Case | Stainless steel restocking cycle; full ferrochrome energy deal activation | US$315 to US$350/t |
"The medium-term chrome price thesis rests primarily on a supply-side variable — specifically the pace of South African ferrochrome capacity expansion — rather than a demand recovery story. This distinction is structurally underappreciated by the broader market."
PGM Prices: Structural Repricing or Cyclical Noise?
Dissecting the Basket Price Trajectory
PGM basket pricing has undergone what appears to be a structural repricing rather than a simple cyclical spike. The full-year FY2025 average of US$1,615/oz was followed by a Q1 FY2026 average of US$2,208/oz, representing a 13% quarter-on-quarter increase. The Q3 FY2026 average reached US$2,681/oz before experiencing an approximately 11% quarter-on-quarter decline.
The year-on-year magnitude of this re-rating is the key analytical signal. A single-quarter pullback within a broader uptrend does not constitute a structural reversal, particularly when the supply and demand fundamentals underpinning the repricing remain firmly intact. In addition, the platinum and palladium dynamics shaping 2025 offer valuable context for understanding this trajectory.
| Period | PGM Basket Price (US$/oz) | Primary Driver |
|---|---|---|
| FY2025 Full Year | US$1,615/oz | Surplus narrative; demand uncertainty |
| Q1 FY2026 | US$2,208/oz | Deficit recognition; supply constraint |
| Q3 FY2026 | US$2,681/oz | Elevated year-on-year; near-term correction |
| Forward Outlook | Constructive | Structural deficit deepening |
Five Structural Pillars Supporting the PGM Price Thesis
1. Multi-Year Platinum Supply Deficits
Platinum markets are entering what analysts project to be a fourth consecutive year of supply deficit in 2026. Structural deficits compound over time, progressively drawing down above-ground stocks and tightening the physical market in ways that take quarters rather than weeks to fully register in spot pricing.
2. Constrained South African Production Capacity
South Africa supplies approximately 70% of global platinum production, making domestic output constraints a global pricing variable rather than a regional concern. Underground mine transitions, shaft deepening requirements, and rising operating costs are all suppressing output growth across the sector. Tharisa's production increase strategy illustrates the capital intensity required simply to maintain, let alone grow, production levels in the current environment.
3. Automotive Demand Runway
Despite the long-term narrative around battery electric vehicles, internal combustion engine vehicle production remains the dominant near-term source of PGM demand for automotive catalytic converters. European legislative frameworks targeting 2035 for combustion engine phase-out define a multi-year demand runway that gives producers and investors meaningful forward visibility.
Crucially, hybrid vehicle proliferation is an underappreciated demand driver. Hybrids typically carry more PGMs per unit than pure ICE vehicles, meaning that the hybrid transition phase could actually increase aggregate catalytic converter PGM loadings before EVs achieve sufficient market penetration to reduce them.
4. Hydrogen and Industrial Demand Vectors
Platinum's role as a catalyst in hydrogen fuel cells creates a demand growth vector that scales directly with green hydrogen infrastructure investment. This demand source is non-cyclical in character, driven by capital allocation decisions rather than economic fluctuations in consumer spending. Beyond hydrogen, advanced electronics manufacturing, AI data centre thermal management systems, and precision industrial applications are creating incremental PGM demand outside traditional channels.
5. Investment and Precious Metal Demand
Rising institutional interest in precious metals as inflation hedges and portfolio diversifiers is supporting PGM investment demand at a structural level. Physical platinum ETF accumulation and futures positioning data reflect growing market conviction in the deficit thesis, adding a demand layer that was largely absent during the 2023 to 2024 price weakness period.
Tharisa's Capital Allocation: Deliberate Deployment, Not Distress
Two Projects Defining the Next Growth Phase
Tharisa Mine Underground Transition (North West Province, South Africa)
The shift from open-pit to underground mining is one of the most strategically significant transitions a mining company can undertake. Underground operations access deeper, higher-grade reef zones that are structurally inaccessible to surface mining methods. This is not simply a capacity expansion — it is a grade and resource quality improvement that reshapes the long-term cost and output profile of the operation.
The transition is partially funded through a dedicated US$80 million underground transition term loan, drawn down during Q3 FY2026, with a long-term production target of 2 million tonnes of chrome concentrate and 200,000 PGM ounces annually.
Karo Platinum (Zimbabwe)
The Karo Platinum greenfield development represents geographic diversification beyond South Africa, adding a second Bushveld-analogous jurisdiction to the production portfolio. Capital expenditure acceleration during Q3 FY2026 reflects active construction progress at the site. For further detail on Tharisa's commodity portfolio, including its chrome and PGM asset base, the company's own resources provide useful background.
Balance Sheet Signals: What the Numbers Actually Mean
| Metric | Q2 FY2026 | Q3 FY2026 | Interpretation |
|---|---|---|---|
| Gross Cash | US$184.3m | US$198.8m | Liquidity buffer improving |
| Total Debt | ~US$130m | US$188.1m | Planned leverage increase |
| Net Cash | US$54.7m | US$10.0m | Deliberate capex deployment |
| Annual Capex Budget | — | ~US$168m | Dual-project execution phase |
Total FY2026 capex, including sustaining capital, is set at approximately US$168 million. The net cash decline from US$54.7 million to US$10 million over Q3 FY2026 reflects the planned drawdown of the underground transition term loan combined with accelerated spend across both major projects.
Gross cash actually increased from US$184.3 million to US$198.8 million over the same period, a detail that contextualises the net cash movement as a leverage structure change rather than a cash burn problem.
"Investors evaluating the net cash decline in isolation risk misreading the signal. The relevant analytical question is whether the assets being created through capital deployment will generate returns that justify the leverage being taken on. A company executing a mine deepening and a greenfield development simultaneously will almost always show compressed net cash during the investment phase."
Production Performance: Q3 FY2026 Operational Divergence
Reading the PGM Recovery and Chrome Softening
PGM production increased to 39,600 ounces in Q3 FY2026, up from 34,300 ounces in Q2 — a 15.5% quarter-on-quarter improvement that reflects recovery from weather-related disruptions that had affected the prior period. Chrome output moved in the opposite direction, declining modestly to 393,800 tonnes from 404,000 tonnes, attributable to lower milled tonnes and a marginal recovery rate decline rather than any structural operational deterioration.
The increase in reef mining activity during Q3 is a positive leading indicator, suggesting the operation is re-establishing its production rhythm following the Q2 interruptions. Mining Weekly's coverage of Tharisa's higher PGM production targets provides further context on the company's forward guidance ambitions.
Full-Year FY2026 Production Guidance
| Commodity | FY2026 Guidance Range | Long-Term Target |
|---|---|---|
| PGM Output | 145,000 to 165,000 oz (6E basis) | 200,000 oz |
| Chrome Concentrate | 1.5 to 1.65 million tonnes | 2.0 million tonnes |
The next major ASX story will hit our subscribers first
Portfolio-Level Commodity Interaction: When One Leg Softens, the Other Carries
The analytical power of the dual-commodity model becomes most apparent when price cycles diverge. Near-term chrome price softness, occurring in a context where PGM prices remain at structurally elevated year-on-year levels, demonstrates exactly the hedging mechanism that makes Bushveld dual-commodity producers distinct. Furthermore, considering green steel pricing trends adds another important dimension to understanding where chrome demand is heading over the longer term.
| Market Phase | Chrome Price Behaviour | PGM Price Behaviour | Net Portfolio Effect |
|---|---|---|---|
| Stainless steel boom | Rising | Neutral to positive | Strongly positive |
| Auto demand weakness | Neutral | Negative | Partially hedged |
| Supply disruption (South Africa) | Tightening | Tightening | Strongly positive |
| Geopolitical demand shock | Negative | Mixed | Partially negative |
| Green energy transition | Structural demand growth | Positive (hydrogen) | Strongly positive |
An approximately 11% quarter-on-quarter PGM price decline, absorbed alongside chrome revenues still averaging well above the FY2025 full-year baseline, illustrates the margin buffer in practical terms. Investors modelling revenue sensitivity need to evaluate both commodities simultaneously rather than applying single-commodity valuation frameworks.
Frequently Asked Questions: Tharisa Chrome Prices and PGM Outlook
What is the current chrome concentrate price and where is it heading?
Chrome prices averaged US$306/t during Q3 FY2026 before softening due to weaker stainless steel demand and reduced procurement activity from the Middle East region. The medium-term outlook remains constructive, supported by South African ferrochrome expansion diverting raw chromite ore away from export markets and sustained Far East stainless steel demand benchmarked at approximately 2 million tonnes per month.
Why is PGM basket pricing described as constructive despite a recent quarterly decline?
The approximately 11% quarter-on-quarter decline should be evaluated against the significantly elevated year-on-year position. The FY2025 average of US$1,615/oz rising to a Q3 FY2026 average of US$2,681/oz represents a structural repricing that a single-quarter correction does not reverse. Multi-year platinum supply deficits, constrained South African mine output, and expanding industrial and automotive demand support the medium-term constructive view.
What is the significance of the underground mine transition for long-term investors?
The transition from open-pit to underground operations at the North West Province mine is a generational capital investment. Underground access to deeper reef zones improves both the grade quality and the resource life of the operation, repositioning the mine's long-term economics. The production targets of 200,000 PGM ounces and 2 million tonnes of chrome concentrate annually represent roughly a 25 to 35% increase above current guidance levels.
How does palladium fit into the broader PGM outlook?
Palladium occupies a more nuanced position within the PGM basket. Its concentration in petrol-engine catalytic converters makes its demand profile more sensitive to the pace of ICE-to-EV transition, particularly in the petrol-dominant markets of Europe, China, and the United States. Platinum, by contrast, benefits from both a diesel-catalytic and an emerging hydrogen fuel cell demand vector, giving it a broader structural support base than palladium at this point in the energy transition cycle.
Key Forward Indicators Worth Monitoring
For investors tracking the Tharisa chrome prices and PGM outlook thesis, five operational and market indicators will be most informative over the 12 to 24 month horizon:
- South African ferrochrome smelting capacity utilisation rates and the pace of the energy agreement's practical implementation
- Far East stainless steel production volumes relative to the 2 million tonnes per month benchmark level
- Underground mine development progress at the North West Province operation, including reef grade data as deeper zones are accessed
- Karo Platinum construction milestones and any revised first-production timeline announcements
- Platinum supply deficit data from industry bodies including the World Platinum Investment Council, which publishes quarterly supply and demand balance estimates
"The convergence of a supply-side tightening thesis in chrome and a multi-year deficit cycle in platinum creates a scenario where both legs of the dual-commodity model improve simultaneously. That outcome is not guaranteed, but the structural conditions for it are increasingly visible across the supply chain."
This article contains forward-looking statements, scenario projections, and commodity price analysis for informational purposes only. It does not constitute financial advice. Commodity markets are subject to significant volatility, and actual outcomes may differ materially from projections. Investors should conduct their own due diligence and consult a licensed financial adviser before making investment decisions.
Want to Capitalise on the Next Major Mineral Discovery Before the Broader Market?
Discovery Alert's proprietary Discovery IQ model instantly notifies subscribers of significant ASX mineral discoveries, transforming complex commodity data into clear, actionable investment insights — explore historic discoveries and their exceptional returns to understand the potential upside, then begin a 14-day free trial at Discovery Alert to secure a market-leading edge across the commodities driving tomorrow's mining sector.