June 17, 2026
When Chokepoints Become Profit Engines: The Hidden Mechanics of Crisis Trading
Few economic phenomena reveal the inner workings of global commodity markets quite like a major supply disruption. When the free flow of oil through a critical transit corridor is suddenly compromised, the financial consequences ripple outward in ways that most casual observers never fully appreciate. Price spikes make headlines. Shortages generate political debate. But quietly, operating at the intersection of logistics, finance, and geopolitical intelligence, a small group of physical commodity trading houses transforms that disorder into extraordinary profit.
Understanding how this works requires moving beyond the simple narrative of traders benefiting from rising oil prices. The reality is considerably more sophisticated, and the Trafigura profit surge after Hormuz closure offers a rare window into that machinery in full operation.
When big ASX news breaks, our subscribers know first
The Strait of Hormuz: Why 21 Miles of Water Can Reshape the Global Economy
The Strait of Hormuz sits at the mouth of the Persian Gulf, connecting the world's most oil-rich region to international markets. At its narrowest point, the waterway measures roughly 21 miles across, yet within that geography exist only two 2-mile-wide shipping lanes designated for tanker traffic, one inbound and one outbound. Through those narrow corridors, roughly 17 to 21 million barrels of crude oil and petroleum products have historically flowed each day, representing approximately 20 to 30 percent of all globally traded seaborne oil.
No other single transit point concentrates so much energy infrastructure risk in so confined a geographic space. The Panama Canal handles a fraction of the volume. The Suez Canal, while significant, serves a more diversified traffic mix. The Strait of Hormuz is categorically different: its disruption does not merely inconvenience global supply chains, it fractures them.
When transit through the Strait becomes unreliable, tankers must reroute around the Cape of Good Hope at the southern tip of Africa. That detour adds approximately 4,000 nautical miles to each voyage and extends transit times by 10 to 15 days. The compounding effects are severe:
- Freight costs increase by an estimated $1 to $2 per barrel for the extended distance alone
- War risk insurance premiums rise sharply for vessels operating near conflict zones
- Effective tanker capacity shrinks by an estimated 1.5 to 2 million barrels per day as vessels spend more time at sea completing extended voyages
- Regional price dislocations emerge as some markets face sudden oversupply while others face acute shortage
This final point is where physical commodity trading houses earn their most significant returns. The gap between where oil is available and where it is desperately needed is not a passive financial opportunity; it is a complex logistical problem that only a small number of organisations possess the infrastructure, counterparty networks, and risk appetite to solve at scale.
Trafigura's Profit Surge: Breaking Down the Numbers Behind the Headlines
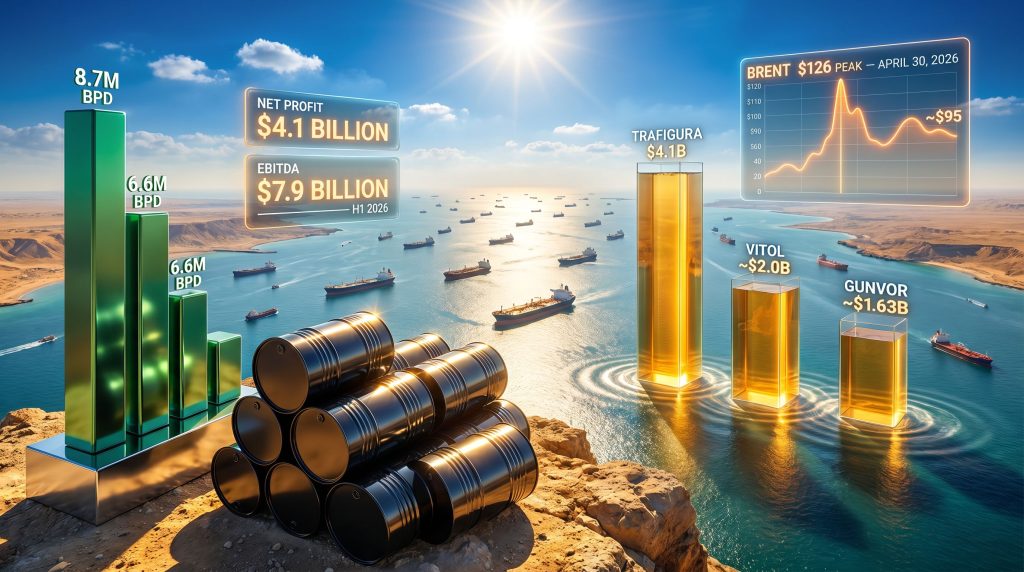
Trafigura's financial results for the October 2025 to March 2026 period were released in early June 2026 and immediately drew attention across global commodity markets. The headline figure, a net profit of $4.1 billion for a single six-month period, was striking not merely for its size but for its context.
The company's full-year 2025 result had been $2.7 billion. Trafigura's first half of fiscal 2026 surpassed that entire annual figure in half the time, placing the company on a trajectory that could approach or potentially challenge its all-time annual record of $7.4 billion set in 2023.
| Metric | H1 2026 (Oct 2025 to Mar 2026) | Full-Year 2025 | H1 2023 (Record Period) |
|---|---|---|---|
| Net Profit | $4.1 billion | $2.7 billion | $5.5 billion |
| EBITDA | $7.9 billion | $3.9 billion (H1 2025) | Not disclosed |
| Group Equity Value | $17.5 billion | $16.2 billion | Not disclosed |
| Oil and Fuel Volumes Traded | 8.7 million bpd | 6.6 million bpd (full year) | Not disclosed |
| Shareholder Dividends | $3.05 billion | $2.9 billion (full year) | Not disclosed |
Several structural dimensions of these numbers deserve closer analysis.
EBITDA Doubling: What Operational Leverage Actually Looks Like
Trafigura's EBITDA reached $7.9 billion in H1 2026, more than double the $3.9 billion recorded in the equivalent prior-year period. This is not simply a function of higher commodity prices inflating revenues; it reflects genuine operational leverage, meaning the company's cost base did not scale proportionally with the dramatic increase in trading activity and margin capture.
Trading volumes grew from 6.6 million barrels per day across all of 2025 to 8.7 million barrels per day in just the first half of fiscal 2026 alone. That approximately 32 percent volume increase, combined with a dramatically wider per-unit margin environment, produced the EBITDA doubling. In physical commodity trading, this dynamic is sometimes described as the "crisis leverage effect": the most capital-intensive and logistically complex transactions also tend to be the most profitable, and large trading houses are positioned to absorb the complexity that smaller participants cannot handle.
Dividend Policy During Disruption: A Signal of Confidence
The decision to distribute $3.05 billion to shareholders in the first half of fiscal 2026, already exceeding the $2.9 billion distributed throughout the entirety of fiscal 2025, reflects management's assessment that the earnings quality during this period is genuine and durable rather than a one-time windfall requiring capital preservation. For a privately held company that does not face the scrutiny of public equity markets, the dividend figure serves as one of the clearest signals of internal confidence in the earnings trajectory.
Furthermore, as commodity trading giants like Trafigura continue to demonstrate, the capacity to deploy capital decisively during periods of geopolitical stress has become a defining competitive advantage in the independent trading sector.
Trafigura's H1 2026 net profit of $4.1 billion already surpassed its entire full-year 2025 result. With EBITDA doubling year-over-year and trading volumes expanding by more than 30 percent, the company appears on pace for a potential record annual performance.
How Physical Commodity Traders Actually Make Money During Supply Crises
One of the most persistent misconceptions about commodity trading houses is that they profit primarily from directional price bets, buying oil cheap and selling it expensive as prices rise. This model describes financial speculators but mischaracterises how firms like Trafigura generate revenue.
Trafigura CEO Richard Holtum addressed this distinction directly in the company's results communication, stating that performance is driven by the complexity and cost involved in delivering logistical solutions during periods of market stress, rather than by elevated commodity prices themselves. This framing is not merely a public relations exercise; it reflects a fundamentally different business architecture.
The Dislocation Arbitrage Model Explained
Physical commodity traders profit from spatial arbitrage: the difference in price between where a commodity is available and where it is needed. During normal market conditions, these spreads are narrow because established supply chains efficiently connect surplus and deficit regions. When geopolitical disruption severs those connections, spreads widen dramatically, and the organisations with the logistics infrastructure to bridge the gap capture the resulting margin.
The step-by-step mechanics of this process during the Hormuz disruption period looked broadly like this:
- Identify the dislocation – Asian refineries cut off from their usual Middle Eastern crude supply face immediate spot market premiums, while Atlantic basin markets experience temporary oversupply as traditional Middle Eastern flows seek alternative destinations
- Source alternative supply – Redirect West African, Brazilian, or North Sea crude toward deficit Asian markets, often sourced at a discount reflecting limited traditional buyer interest
- Navigate routing complexity – Engage specialist shipping operators, arrange war risk insurance coverage, and manage scheduling across vastly extended transit times
- Deliver into the deficit market – Capture the spread between sourcing cost and delivery price, with the margin reflecting both geographic arbitrage and the complexity premium
- Manage balance sheet risk – Deploy hedging instruments to limit exposure to price reversals during the extended delivery window, protecting margin while the cargo is in transit
The critical insight is that steps three and four, the logistical problem-solving components, are where the majority of the margin is generated. This is what makes physical trading fundamentally different from financial speculation: complexity is not an obstacle to profit, it is the source of it. In addition, understanding market volatility and hedging strategies is essential to appreciating how these firms protect their margins throughout extended disruption periods.
Why Complexity Is the Actual Product
A subtler dynamic that is not widely appreciated outside specialist circles is that physical trading houses effectively sell logistical certainty to industrial customers who cannot tolerate supply disruption. A refinery that has been purchasing Saudi Arabian crude for decades does not have the infrastructure, counterparty relationships, or risk appetite to rapidly switch to West African crude sourced through a new supply chain during a geopolitical crisis. Trafigura does. The premium charged for that capability is the real driver of margins during crisis periods, and it is relatively insensitive to whether oil prices are at $70 or $126 per barrel.
The Iran War Oil Shock: Contextualising the Largest Supply Disruption on Record
The US-Israel-Iran conflict that developed in late 2025 produced, according to reporting by Reuters and Mining.com, what has been described as the world's largest oil supply disruption on record. This characterisation is worth unpacking carefully against historical precedents. Consequently, the global trade war impacts layered on top of the supply disruption created an even more complex trading environment than any single geopolitical event alone would have generated.
Oil prices moved from approximately $70 per barrel in the pre-conflict period to a peak of $126 per barrel on April 30, 2026, representing an approximately 80 percent increase. By early June 2026, prices had retreated to around $95 per barrel as markets partially adapted to the new supply configuration, though structural uncertainty persisted. Tracking crude oil price trends throughout this period reveals the extraordinary speed and scale of the market's response to the Hormuz disruption.
| Disruption Event | Approximate Peak Price Impact | Duration of Elevated Prices | Primary Beneficiaries |
|---|---|---|---|
| 1973 Arab Oil Embargo | Approximately 300% increase | Around 6 months | State-controlled producers |
| 1990 Gulf War | Approximately 100% spike | Around 6 months | Spot traders and refiners |
| 2022 Russia-Ukraine War | Approximately 65% increase | 12 or more months | LNG traders and European suppliers |
| 2026 Iran War and Hormuz Disruption | Approximately 80% increase to date | Ongoing | Physical commodity trading houses |
One notably distinctive feature of the current disruption compared to previous historical episodes is the market structure in which it has occurred. The 1973 embargo played out in a world of largely state-controlled oil companies and limited spot market infrastructure. The current disruption affects a highly financialised, deeply interconnected global market where sophisticated trading houses with enormous capital bases and global logistics networks are positioned to respond at a scale and speed that was simply not possible in prior decades. This structural evolution is precisely why independent trading houses are the primary beneficiaries of the current crisis rather than state producers or refiners.
It is also worth noting that Trafigura reported its financial first quarter, covering the period up to the end of December 2025 and therefore prior to the escalation of the Iran conflict, was already its second-strongest first quarter on record. This suggests that the company's performance was building on a strong foundation even before the most extreme conditions of the Hormuz disruption materialised.
Trafigura vs. Vitol vs. Gunvor: Mapping the Competitive Landscape
The independent commodity trading sector operates with unusually limited public financial disclosure, making direct comparison between the major houses genuinely difficult. The available information nonetheless provides a partial picture of how the competitive landscape has evolved during the current supply crisis.
| Firm | Reporting Period | Profit Figure | Disclosure Model |
|---|---|---|---|
| Trafigura | H1 2026 (Oct 2025 to Mar 2026) | $4.1 billion net profit | Formal financial results release |
| Vitol | Q1 2026 (Jan to Mar 2026) | Approximately $2 billion | Informal, Bloomberg-reported |
| Gunvor | Q1 2026 | Equivalent to $1.63 billion gross profit | CEO commentary |
Vitol, widely regarded as the world's largest independent oil trader by volume, does not publish formal financial results. The approximately $2 billion Q1 2026 profit figure cited in Bloomberg reporting covers only three months and does not include the same period as Trafigura's first-half result, making direct comparison structurally problematic. On a comparable basis, Trafigura's performance suggests it may be narrowing the gap with or potentially surpassing Vitol in terms of absolute profitability, a development that would represent a significant shift in the competitive hierarchy of the independent trading sector.
Gunvor's commentary is particularly revealing from a market intelligence perspective. CEO Gary Pedersen reportedly described the operating environment as exhibiting "constructive volatility," a phrase that has since been widely adopted in industry discussions. The concept captures something important about how professional traders think about market conditions: volatility is not inherently negative and is not something to be minimised. It is the raw material from which trading margins are generated. A market characterised by smooth, predictable price movements offers limited opportunity for the complexity premium that drives exceptional returns.
Furthermore, the broader geopolitical risk landscape affecting metals and energy supply chains has amplified the "constructive volatility" dynamic well beyond the oil markets alone, creating compounding opportunities across multiple commodity classes simultaneously.
The phrase "constructive volatility" offers a window into the professional commodity trading mindset: uncertainty and supply disruption are not threats to be managed away but conditions that create the very complexity premium from which extraordinary margins are extracted.
The next major ASX story will hit our subscribers first
The $700 Million Impairment Question: Asset Risk in a Trading Business
Against the backdrop of exceptional trading performance, Trafigura recorded $700 million in impairment charges during the first half of fiscal 2026. These charges were specifically attributed to two transactions within the company's assets division: the divestment of metals subsidiary Nyrstar's operations in Tennessee and the acquisition of French fuel supplier Armorine by the company's Greenergy subsidiary.
This figure is instructive for understanding the dual risk profile of companies that combine physical commodity trading with strategic asset ownership. The trading division generated extraordinary margins during the disruption period, but the assets division simultaneously destroyed value through impairments, demonstrating that the two business lines can experience dramatically divergent performance cycles simultaneously.
CFO Stephan Jansma addressed the asset portfolio directly, indicating that while the company is broadly satisfied with its approximately $10 billion asset base, active optimisation of that portfolio remains an ongoing priority. This framing suggests a deliberate strategy of maintaining assets primarily where they generate strategic trading advantages, synergies with the core trading business, or acceptable standalone returns, rather than retaining assets for balance sheet scale alone.
The critical analytical point for observers is that the $700 million in impairments, while material, was effectively absorbed within a reporting period that produced $7.9 billion in EBITDA. The ratio illustrates just how substantial the trading performance was: even significant asset write-downs represent less than 10 percent of gross operating earnings for the period.
What Trafigura's Results Signal for the Second Half of 2026
Trafigura noted in its results commentary that second-half performance had continued positively, while simultaneously acknowledging that the external environment remains exceptionally difficult to forecast. This dual assessment captures the central tension facing the company and its competitors as 2026 progresses.
Three broad scenarios shape the likely trajectory of second-half performance:
| Scenario | Conditions | Likely Profit Outcome |
|---|---|---|
| Escalation | Hormuz remains disrupted; oil holds above $110 per barrel | Full-year profit approaches or exceeds the 2023 record of $7.4 billion |
| Stabilisation | Partial reopening; oil settles in the $90 to $100 range | Full-year profit in the $6 to $7 billion range |
| De-escalation | Ceasefire achieved; supply routes rapidly restored | Margin compression as volatility collapses; potential H2 slowdown |
The relationship between political tension, market volatility, and trading house revenue is not linear, but the directional dependency is clear. Trafigura's business model performs best when supply chain complexity is elevated and when customers face urgent logistical problems that require sophisticated third-party solutions. A rapid normalisation of Hormuz transit, while broadly positive for the global economy and energy consumers, would meaningfully compress the trading margins that have driven the Trafigura profit surge after Hormuz closure to exceptional levels.
CFO Stephan Jansma captured this dynamic succinctly in the company's results communications, noting that in volatile market conditions, customers rely on the company's capabilities more heavily than ever. This observation points to a structural feature of the trading business that is often underappreciated: customer dependency on sophisticated trading intermediaries actually increases during crises, providing both revenue opportunity and a degree of earnings stability that persists as long as the disruption continues.
Energy Security Policy: The Uncomfortable Questions Raised by War-Driven Trading Profits
Trafigura's results have arrived at a moment when the role of private commodity trading houses in global energy security is attracting renewed scrutiny from policymakers and regulators. The convergence of record-pace profits with a crisis that is inflicting significant economic pain on energy-importing nations has sharpened a debate that has been simmering for several years.
There is a legitimate argument that firms like Trafigura provide genuinely critical services during supply disruptions. By mobilising capital, logistics infrastructure, and market intelligence to bridge supply gaps, they prevent the kind of complete market fragmentation that would produce far more severe shortages and price spikes than those actually observed. In this framing, trading house profits during crises represent the market price of an essential service, not an extraction of windfall gains.
The counterargument focuses on market concentration and systemic risk. A small number of privately held firms, operating with limited public disclosure obligations, now effectively function as de facto energy infrastructure for national governments and major industrial consumers during the most consequential supply disruptions. The opacity of their operations, the scale of their financial leverage, and their capacity to influence physical market conditions raise legitimate questions about whether existing regulatory frameworks are adequate. Analysts examining the sector have noted this tension has persisted well before the current disruption cycle, suggesting structural reform rather than crisis-specific intervention may ultimately be required.
Neither position is without merit, and the policy debate is unlikely to be resolved quickly. What Trafigura's results do confirm is that the independent trading sector's structural importance to global energy security has never been more visible or more consequential than it is in the current environment.
Frequently Asked Questions: Trafigura, Hormuz, and the Global Oil Trading Landscape
What caused the Trafigura profit surge after the Hormuz closure?
Trafigura's net profit reached $4.1 billion in the six months to March 2026, surpassing its entire full-year 2025 result of $2.7 billion. Performance was driven by broad contributions across oil, metals, gas, and power divisions, with the primary catalyst being the logistical complexity created by the disruption of Strait of Hormuz transit following the US-Israel-Iran conflict. Per company communications, results reflected the premium earned for delivering complex logistical solutions rather than simply benefiting from elevated commodity prices.
How does a Hormuz closure affect oil prices and trading margins?
Restricting Hormuz transit forces buyers and sellers to seek alternative supply routes, adding thousands of nautical miles to shipping distances and creating significant regional price dislocations. Physical traders with the logistics capability to bridge these gaps capture the resulting spreads, which widen substantially during acute disruption periods.
How does Trafigura make money regardless of oil price direction?
Trafigura's core profitability derives from spatial arbitrage: the difference in price between where commodities are available and where they are urgently needed. This spread widens during supply disruptions irrespective of whether absolute prices are rising or falling, making the business model structurally different from directional financial speculation.
How does Trafigura compare to Vitol in profitability?
Based on available disclosures, Trafigura reported $4.1 billion in net profit for H1 2026. Vitol reportedly generated approximately $2 billion in profit during Q1 2026 alone, though direct comparison is complicated by differing reporting periods and Vitol's limited public disclosure practices. However, recent reporting on Trafigura's performance suggests the gap between the two firms may be narrowing significantly.
What are the key risks to Trafigura's continued strong performance?
Primary risks include a rapid de-escalation of the Iran conflict reducing market volatility and trading spreads, continued asset impairment exposure within the $10 billion asset portfolio, and broader macroeconomic deterioration suppressing overall commodity demand volumes.
Key Takeaways: The Strategic Intelligence Behind Trafigura's Record-Pacing Results
- H1 2026 net profit of $4.1 billion exceeded the entire prior fiscal year result, placing Trafigura on pace to potentially challenge the 2023 annual record of $7.4 billion
- EBITDA doubled year-over-year to $7.9 billion, demonstrating significant operational leverage during the disruption period
- Traded volumes expanded to 8.7 million barrels per day in H1 2026 alone, up from 6.6 million bpd across the entirety of 2025
- Profits were driven by logistical complexity and delivery capability, not simply elevated commodity prices, a distinction that is fundamental to understanding the trading house business model
- $700 million in impairment charges represent a counterweight to trading gains, illustrating the dual risk profile inherent in firms that combine physical trading operations with strategic asset ownership
- The competitive landscape among Trafigura, Vitol, and Gunvor suggests the entire independent trading sector is experiencing a generational profit cycle, with performance levels that may not be repeated until the next major supply disruption of comparable scale
- The broader policy implications of privately held trading houses functioning as essential energy infrastructure during geopolitical crises remain unresolved and are likely to attract increasing regulatory attention in the months ahead
This article is based on publicly reported financial results and market data available at the time of publication. Forward-looking scenarios and profit projections discussed herein are speculative in nature and should not be construed as financial advice. Actual outcomes will depend on geopolitical developments, commodity market conditions, and company-specific factors that cannot be predicted with certainty.
Want to Spot the Next Major Commodity Opportunity Before the Broader Market?
While physical trading giants capitalise on supply disruptions at a macro scale, Discovery Alert's proprietary Discovery IQ model scans ASX announcements in real time, delivering instant alerts on significant mineral discoveries across 30-plus commodities so subscribers can identify actionable opportunities the moment they emerge. Explore historic discoveries and their returns to see how early positioning in major finds has generated exceptional outcomes, and begin your 14-day free trial today.