June 12, 2026
The Geography of Energy Vulnerability: Why One Strait Can Shake the Entire Global Economy
Energy markets are rarely moved by a single variable. Supply forecasts, currency fluctuations, inventory data, demand revisions, and central bank decisions all compete for influence over the price of a barrel of crude. Yet history repeatedly demonstrates that geopolitical chokepoints can override every one of these variables simultaneously. The Strait of Hormuz is the clearest proof of that principle, and the events of June 2026 have reminded global markets of just how fragile energy logistics can become when a 21-mile-wide waterway becomes a theatre of geopolitical conflict.
Understanding the Trump Iran oil prices dynamic requires more than tracking daily price movements. It demands a structural analysis of why diplomatic signals carry such immediate weight, how risk premiums behave during conflict cycles, and what the divergence between Washington's public narrative and Tehran's official position means for the months ahead. Furthermore, the current crude oil prices environment reflects just how rapidly geopolitical tension can overwhelm traditional supply-and-demand fundamentals.
When big ASX news breaks, our subscribers know first
Why the Strait of Hormuz Is the World's Most Consequential Energy Corridor
Most energy infrastructure can be partially rerouted when disruption strikes. Pipelines have bypass options. Refineries can adjust feedstock. However, maritime chokepoints are geographic facts. The Strait of Hormuz, a narrow passage connecting the Persian Gulf to the Arabian Sea between Iran and Oman, cannot be bypassed without adding weeks of transit time and substantial cost to every cargo that would otherwise pass through it.
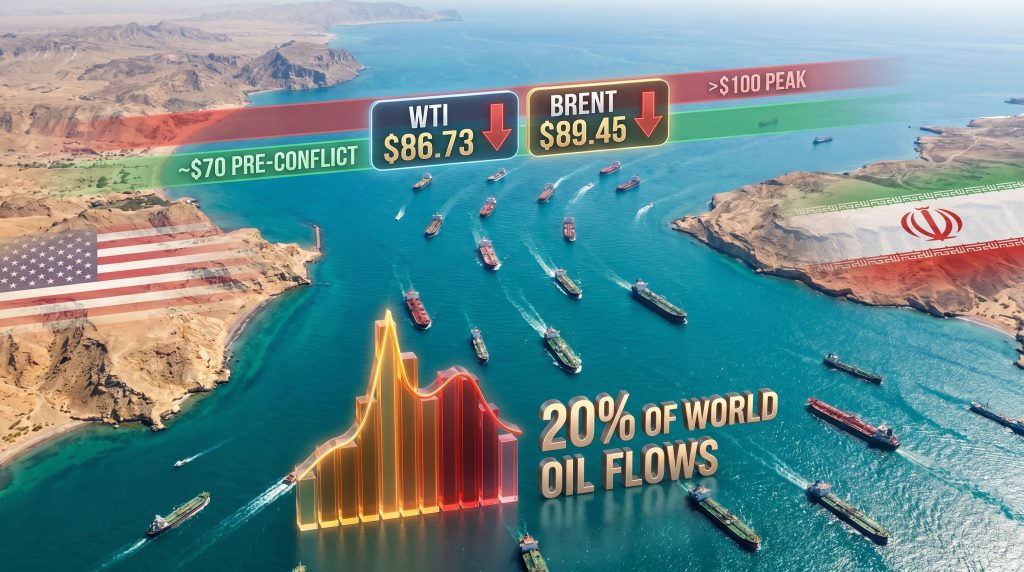
Roughly 20% of the world's oil and liquefied natural gas shipments move through this passage every year. That concentration of flow through a single geographic pinch point means that any credible threat of closure instantly transforms a regional political dispute into a global supply-chain emergency.
The mechanics of how this risk transmits into prices are important to understand:
- Futures traders and institutional investors do not wait for actual supply disruptions to reprice crude. They price the probability of disruption the moment a credible threat materialises.
- The Strait carries output from Saudi Arabia, the UAE, Kuwait, Iraq, and Iran itself, meaning a single closure scenario implicates multiple major producers simultaneously.
- Alternative tanker routes around the Arabian Peninsula via the Cape of Good Hope add approximately 15 additional days of transit time per voyage, increasing freight costs and compressing the effective available supply in markets that operate on just-in-time delivery logic.
- The LNG supply outlook faces even greater constraints than crude, as the infrastructure for alternative LNG export routes from the Persian Gulf is far more limited.
Structural insight: The Strait of Hormuz is not merely a shipping lane. It functions as a geopolitical leverage point that gives Iran disproportionate influence over global energy pricing relative to its share of total oil production. The threat of closure is itself a strategic instrument, regardless of whether a physical blockade ever materialises.
This asymmetry explains why, when Iran announced the formal closure of the Strait in mid-June 2026 and warned vessels against transit, oil prices that had already been elevated from pre-conflict levels of approximately $70 per barrel surged and sustained levels above $100 per barrel. That represents a risk premium of more than 40%, driven not by a confirmed reduction in deliverable supply but by the market's rational pricing of worst-case scenarios.
From Strikes to Strait Closure: The Conflict Timeline That Built the $100 Oil Market
The current pricing environment did not emerge from a single event. It is the accumulated result of an escalating conflict cycle that began in late February 2026 and progressively narrowed the diplomatic space available to markets.
| Date | Event | Oil Market Impact |
|---|---|---|
| February 28, 2026 | Joint US-Israeli military strikes on Iran initiated | Sharp upward price spike; geopolitical risk premium enters crude pricing |
| March to May 2026 | Iran progressively tightens Hormuz access and posture | Prices sustain above $100/barrel as risk remains unresolved |
| Mid-June 2026 | Iran formally announces Strait closure; vessels warned | Maximum risk premium; global supply anxiety peaks across importing economies |
| June 12, 2026 | Trump announces framework agreement; planned strikes called off | Brent and WTI fall below $90/barrel on reduced conflict probability |
The conflict's trajectory reveals an important pattern in how oil markets process escalation. Each successive action by Iran ratcheted up the embedded risk premium in crude pricing, while the US military's public statement that commercial vessels continued to transit the waterway despite Iran's closure declaration served as a deliberate signal to prevent complete market panic from compounding into a genuine supply shock.
The distinction between a declared closure and a functionally enforced closure is one that energy market professionals track closely. Markets price between these two states with considerable nuance: a declared closure commands a substantial premium, but the actual suspension of transit would trigger a pricing response of far greater magnitude. In addition, trade war and oil prices pressures have compounded the complexity facing traders attempting to model multiple simultaneous geopolitical risks.
Trump's Announcement and the Immediate Market Reaction
On June 12, 2026, during a tele-rally in support of a Georgia gubernatorial candidate, US President Donald Trump publicly declared that Washington had reached a framework agreement with Iran. He described the conflict as effectively over and stated that a formal signed agreement was expected within the coming days. He further indicated that the Strait of Hormuz would reopen upon deal finalisation.
The market response was immediate. According to reporting from Yahoo Finance, oil prices pared gains as Trump confirmed US-Iran talks were ongoing, reflecting the market's cautious interpretation of the announcement.
| Benchmark | Price (approx. 7am IST, June 12) | Change | % Movement |
|---|---|---|---|
| WTI Crude | $86.73/barrel | -$0.98 | -1.12% |
| Brent Crude | $89.45/barrel | -$0.93 | -1.03% |
| Pre-conflict baseline | ~$70.00/barrel | Reference | Reference |
| Peak conflict level | >$100.00/barrel | Reference | Reference |
Both benchmarks slipped below the $90 per barrel threshold, a level that energy market participants had been watching as the boundary between war-premium pricing and something closer to normalised trade expectations. The fall was not dramatic in percentage terms, but its directional significance was clear: markets began unwinding the geopolitical risk premium the moment a credible de-escalation signal arrived.
However, a critical complication emerged almost simultaneously. Iran's semi-official Fars news agency reported that Tehran had not approved the text of any agreement. This divergence between Trump's public declaration and Iran's official position introduced a layer of uncertainty that prevented a more aggressive price decline. Markets were left pricing a scenario somewhere between hopeful and unconfirmed.
The bidirectional sensitivity of oil prices to Trump's Iran commentary has been consistent throughout the conflict period. When Trump earlier described ceasefire prospects as being on fragile ground, crude prices rose approximately 3% in a single session. The contrast between that upward move and the subsequent decline following his framework announcement illustrates how efficiently algorithmic and institutional trading systems convert presidential language into price signals.
Market psychology note: Traders are not waiting for verified facts. They are continuously updating probability-weighted outcome models. A Trump statement shifts those probabilities, which shifts the expected value of future crude supply, which reprices futures contracts in seconds. This is why words carry immediate price consequences even before any physical change in supply has occurred.
The Three Scenarios Now Driving Oil Price Forecasts
With the announcement made but the deal unconfirmed, global energy markets are effectively operating across three distinct scenario pathways, each carrying materially different price implications.
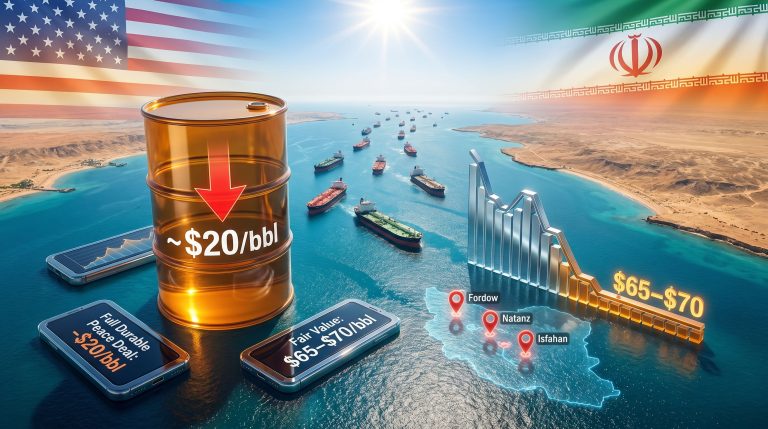
Scenario 1: Full Deal Signed, Hormuz Reopens (Base Case for Price Normalisation)
A formalised, binding agreement between Washington and Tehran, followed by verified reopening of the Strait to commercial traffic, would logically push crude pricing back toward the $70 to $75 per barrel range that prevailed before the conflict began. This scenario assumes Iranian compliance, that US incentives are sufficient to satisfy Tehran's requirements, and that no third-party actor introduces a spoiling event. Trump's framing of a deal arriving within days sets a short verification window for this outcome.
Scenario 2: Framework Stalls, Partial Normalisation Only (Most Probable Near-Term)
If the agreement remains contested or technically unsigned, the most likely market equilibrium sits in a $85 to $95 per barrel corridor. This reflects partial risk reduction without full confidence in supply restoration. The historical pattern of US-Iran diplomacy supports this scenario strongly: public announcements have repeatedly preceded extended technical negotiations, and the gap between Trump's statement and Iran's denial is consistent with that precedent.
Scenario 3: Talks Collapse, Conflict Resumes (Tail Risk)
If negotiations break down entirely and hostilities resume, prices could rapidly return to $100 per barrel or higher, with a worst-case escalation scenario potentially driving Brent toward $110 to $120. Iran's Fars news agency statement that Tehran had not approved any agreement text is the primary evidence supporting this tail risk remaining live. Asian LNG importers, including India, Japan, and South Korea, would face the sharpest immediate consequences given their structural dependence on Persian Gulf supply chains. Consequently, understanding the broader crude geopolitics analysis is essential for any investor navigating these three scenarios.
Analytical warning: Markets are currently pricing a blend of Scenario 1 and Scenario 2, with Scenario 3 acknowledged but not fully embedded in spot prices. The single most important near-term variable is not Trump's next statement but an official Iranian government confirmation or denial of any formal agreement. Until that arrives, the risk premium cannot fully unwind.
How Trump Iran Oil Prices Dynamics Reveal a New Form of Energy Market Influence
One of the less-discussed dimensions of the current situation is how Trump's public communication style has functioned as an unconventional but demonstrably effective instrument of energy price management. This is not simply a feature of Trump's presidency; it reflects a broader structural reality about how modern oil markets process information.
Consider the directional map of key Trump statements during the conflict period:
| Statement Type | Market Direction | Approximate Price Impact |
|---|---|---|
| Ceasefire described as fragile / on life support | Upward | Approximately +3% |
| Framework agreement announced / war declared over | Downward | Approximately -1% to -1.5% immediate |
| Prediction that oil would fall sharply if deal reached | Downward (forward guidance effect) | Sentiment compression in futures |
| Threatened severe military action against Iran | Upward | Risk premium expansion |
What is particularly notable is the forward guidance function. When Trump publicly predicted that oil prices would fall sharply in the event of a deal, he was not merely making a forecast. He was signalling future policy intent to markets, which then partially priced that outcome in advance. This pre-positioning by markets means that when the actual announcement arrived, some of the price movement had already been absorbed, which explains why the immediate reaction on June 12 was measured rather than dramatic.
This dynamic is not unique to Trump, but his tendency toward public, unscripted statements on live political events creates a particularly high-frequency signal environment for energy traders. The challenge for market participants is distinguishing between statements that reflect genuine diplomatic progress and those that function primarily as political communication. For instance, the oil price shock experienced earlier in the cycle demonstrated how quickly executive-level commentary can overwhelm conventional price modelling.
The next major ASX story will hit our subscribers first
The Inflation Transmission Problem: Why $100 Oil Has Global Consequences
Beyond the immediate pricing dynamics, the sustained period of elevated crude costs carries macroeconomic consequences that extend well beyond commodity markets.
Empirical estimates suggest that every $10 per barrel increase in sustained crude prices adds approximately 0.2 to 0.5 percentage points to headline inflation in major energy-importing economies, with the precise impact varying by energy intensity, subsidy structures, and pass-through mechanisms in each country.
The move from pre-conflict levels of approximately $70 per barrel to conflict-peak pricing above $100 per barrel represented a roughly 43% price increase. For economies where energy costs feed directly into transportation, food production, and industrial activity, this magnitude of shock is sufficient to materially affect central bank rate decisions, fiscal policy settings, and consumer purchasing power.
The asymmetric regional exposure to this pressure is significant:
- Asia-Pacific importers including India, China, Japan, and South Korea carry the highest structural vulnerability, given both their dependence on Persian Gulf crude and the limited feasibility of rapid supply diversification.
- European energy markets, already restructured following the 2022 Russian supply disruption, face compounding vulnerability from a second major supply corridor coming under threat within a four-year period.
- Emerging market economies across South and Southeast Asia face the most acute inflationary pressure, as fiscal space to absorb energy cost increases through subsidies or monetary buffer is more constrained than in advanced economies.
A return to $75 to $85 per barrel pricing would deliver meaningful disinflationary relief across these regions, particularly in economies where energy price changes transmit rapidly into headline CPI through fuel and food cost channels.
What the Conflict Has Exposed About Single-Chokepoint Energy Dependency
Regardless of how the current US-Iran negotiations resolve, the events of 2026 have delivered a structural lesson to energy policymakers globally. The concentration of approximately one-fifth of the world's oil and gas shipments through a single 21-mile passage represents a systemic fragility that cannot be hedged through financial instruments alone.
The conflict period has likely accelerated several longer-term policy responses that were already underway:
- Strategic petroleum reserve expansion among major importing nations, particularly in Asia, to extend the buffer period available before supply disruptions translate into domestic shortages.
- LNG infrastructure diversification, including investment in alternative supply agreements with producers outside the Persian Gulf region such as Australia, the United States, and African LNG exporters.
- Accelerated renewable energy deployment as a long-duration hedge against fossil fuel supply chain concentration risk, particularly for electricity generation that can substitute for gas-fired power.
- Shipping route investment to reduce the marginal cost of alternative transit via the Cape of Good Hope, making non-Hormuz routing economically viable at lower crude price premiums than currently required.
None of these responses are immediate. However, the 2026 conflict has provided the kind of concrete, high-cost demonstration of chokepoint risk that tends to translate into durable policy change in ways that theoretical vulnerability assessments do not. MarketWatch has noted that Trump himself signalled there was "no rush" as a deal to end the conflict and reopen the Strait appeared close, further illustrating the cautious pace of diplomatic progress underpinning these structural shifts.
Key Indicators to Watch as the Trump-Iran Oil Price Situation Evolves
For investors, energy market participants, and policy analysts tracking this situation, the following variables carry the highest near-term signal value:
- Official Iranian government statement either confirming or formally rejecting any agreement text. This is the single most important outstanding variable and will determine whether current pricing holds or reverts.
- Strait of Hormuz vessel traffic data from maritime tracking services. Real-time AIS data showing commercial tanker movements through the waterway provides a ground-truth check on whether any diplomatic progress is translating into physical reopening.
- WTI and Brent price behaviour around the $85 support level. A sustained break below this level would indicate market confidence in deal progression. A reversal back above $90 would signal renewed doubt about the framework's substance.
- Trump's follow-up communications in the days following the June 12 announcement, particularly any statements that either confirm deal finalisation or introduce new conditions.
- Third-party responses, particularly from Israel and from Iranian hardline political factions, both of which have the capacity to complicate or derail a framework agreement even if the central parties are nominally aligned.
Disclaimer: This article contains forward-looking analysis and scenario projections based on publicly available information as of June 12, 2026. Oil price forecasts involve significant uncertainty and should not be interpreted as investment advice. Actual market outcomes will depend on geopolitical developments that remain highly unpredictable. Readers should conduct independent research before making any investment decisions.
The $30-Per-Barrel Question: What Resolution or Failure Actually Means
The stakes embedded in the Trump Iran oil prices equation are ultimately quantifiable. The difference between a formalised peace agreement and a return to active conflict represents approximately $25 to $30 per barrel of crude pricing, based on the spread between pre-conflict baseline levels and peak conflict pricing. That magnitude of price difference carries consequences across every dimension of the global economy, from household energy bills to central bank interest rate decisions to sovereign fiscal positions in oil-importing nations.
Three realities now define the path forward for energy markets:
- Trump's public announcement moved prices, but Iran's position remains the decisive counterweight. The risk premium cannot fully normalise until Tehran's official stance is clarified.
- The Strait of Hormuz is the physical confirmation mechanism. Diplomatic words reduce the probability of disruption; verified vessel traffic through the waterway is the only evidence that actually removes it.
- The $70 to $100 corridor that has defined oil pricing throughout this conflict represents one of the most consequential price ranges in recent energy market history, with disproportionate effects on inflation, monetary policy, and economic growth in the world's most energy-dependent economies.
Whether the framework Trump announced on June 12 hardens into a binding agreement or dissolves under the weight of its own contradictions will determine which direction crude markets move from here. For now, the market is holding its breath somewhere between $85 and $90 per barrel, waiting for confirmation that never quite seems to arrive.
Want to Track the Next Major Commodity Discovery Before the Market Reacts?
While geopolitical tensions reshape energy pricing overnight, Discovery Alert's proprietary Discovery IQ model delivers real-time notifications on significant ASX mineral discoveries — turning complex market signals into actionable opportunities the moment they emerge. Explore how historic discoveries have generated substantial returns on Discovery Alert's dedicated discoveries page, and begin your 14-day free trial today to position yourself ahead of the broader market.