May 11, 2026
The Mechanics Behind Geopolitical Risk Premiums in Oil Markets
Energy markets have long operated on a principle that physical supply disruptions and perceived supply risks are almost equally powerful in driving price action. When diplomatic frameworks collapse rather than pipelines, futures markets reprice just as aggressively as they would following an actual infrastructure strike. Understanding this dynamic is essential context for interpreting what is unfolding in global crude markets as Trump rejects Iran peace terms oil supply disruption continues to escalate through May 2026.
The concept of a geopolitical risk premium refers to the additional cost embedded in crude futures beyond what fundamental supply and demand models would otherwise justify. It reflects the market's collective pricing of uncertainty. When a diplomatic breakdown carries a credible probability of physical supply disruption, traders price that probability into both near-month and forward contracts simultaneously, creating price dislocations that can persist for weeks or months.
What distinguishes the current situation from routine oil market volatility is the structural nature of the impasse rather than its intensity. Markets can absorb temporary spikes. What they struggle to absorb efficiently is an open-ended standoff with no visible resolution pathway. Furthermore, geopolitics and oil prices have historically shown that perceived risk alone can be sufficient to move markets significantly.
When big ASX news breaks, our subscribers know first
Why the Trump Rejects Iran Peace Terms Decision Has No Easy Off-Ramp
The Negotiating Gap Is Structural, Not Tactical
Iran's counter-proposals in the latest round of diplomacy reportedly required two conditions the U.S. administration categorically refused: complete removal of all sanctions and formal acknowledgment of Iranian authority over the Strait of Hormuz. The U.S. rejection of both conditions was not a negotiating maneuver designed to extract better terms. It reflected the reality that accepting either condition would represent a fundamental shift in U.S. strategic posture in the Middle East.
The result is a deadlock where both parties' minimum acceptable outcomes are mutually exclusive. This is qualitatively different from a dispute where the gap between positions is large but theoretically bridgeable. When there is no intermediate position that satisfies both sides' core requirements, diplomatic timelines do not compress under pressure. They extend.
Analyst commentary cited by Reuters described the current impasse as leaving the two parties as far apart as they were at the beginning of the ceasefire period, suggesting the negotiations have not narrowed the structural divide at all.
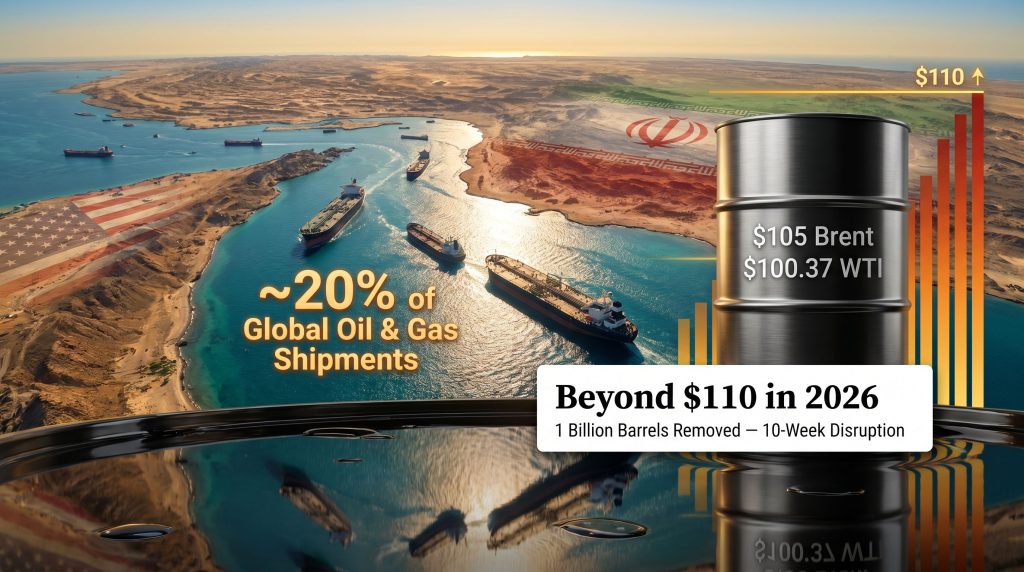
This has direct supply consequences. Without a credible resolution timeline extending into Q3 2026, markets cannot price in a near-term return to normalcy. Brent crude surged approximately 3 to 4 percent to around $105 per barrel in the immediate aftermath of the announcement, while WTI breached the psychologically significant $100 per barrel threshold, settling around $100.37. U.S. equity markets opened lower as higher energy cost projections filtered through to corporate earnings models.
In addition, the oil prices and trade war dynamics already weighing on global sentiment have compounded the severity of this latest diplomatic rupture, leaving traders with few reliable hedging anchors.
The Strait of Hormuz: Why Closure Carries Consequences Unmatched by Any Other Chokepoint
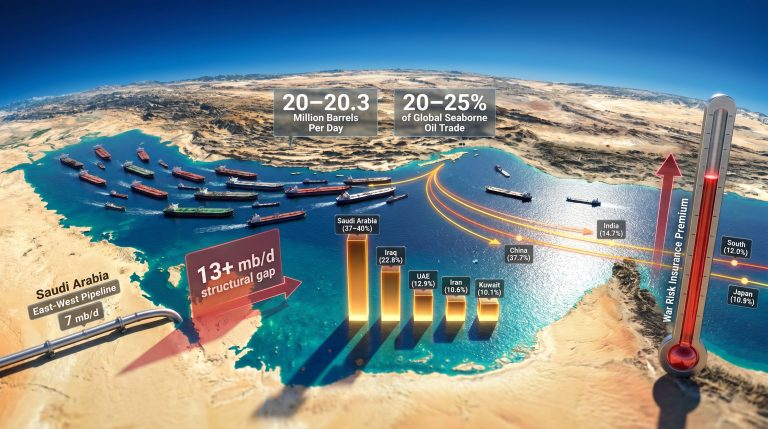
Approximately 20% of Global Oil Flows Through a Single Narrow Passage
The Strait of Hormuz, at its narrowest point only about 21 nautical miles wide, handles roughly 20 percent of global oil and gas shipments according to the U.S. Energy Information Administration. No other maritime chokepoint comes close to matching this concentration of global energy throughput.
Unlike the Suez Canal, where rerouting via the Cape of Good Hope adds roughly 6,000 nautical miles and approximately 10 to 12 additional days of transit time, the Strait of Hormuz has no functionally equivalent bypass. Saudi Arabia's East-West Pipeline can divert some crude, but its capacity covers only a fraction of the Strait's total throughput volume. Qatar's liquefied natural gas exports, among the world's largest, have no viable pipeline alternative at all.
The compounding factor in the current disruption is the behaviour of vessel operators under threat conditions. Tankers transiting or departing the Gulf have been disabling their Automatic Identification System (AIS) transponders to reduce targeting risk from Iranian military assets. AIS is the maritime equivalent of an aircraft's transponder. When it is switched off, the vessel effectively disappears from civilian tracking systems.
This creates an information vacuum with serious commercial consequences:
- Buyers cannot confirm cargo locations or estimated arrival times
- Insurers cannot price risk against vessels whose positions are unknown
- Refiners cannot sequence production schedules against uncertain delivery windows
- Spot market pricing loses its connection to verified physical flows
The result is not merely elevated prices. It is a fundamentally broken logistics environment where the physical and financial dimensions of the crude market decouple.
The Scale of Supply Removal Over Ten Weeks
| Metric | Figure |
|---|---|
| Global oil share transiting the Strait | ~20% |
| Estimated barrels removed from supply (10-week period) | ~1 billion barrels |
| Chinese crude imports, April 2026 | Lowest level in nearly 4 years |
| Brent crude post-rejection announcement | ~$105 per barrel |
| WTI crude post-rejection announcement | ~$100.37 per barrel |
| JPMorgan Brent average projection for 2026 | $97 per barrel |
| Analyst consensus Brent floor through 2026 | Above $90 per barrel |
| Projected Brent range into 2027 (normalisation scenario) | $80 to $85 per barrel |
Saudi Aramco's chief executive has publicly acknowledged that energy markets will require extended time to stabilise even after shipping flows resume, reflecting an important market reality: the instantaneous return of tanker traffic does not instantaneously replace a 1 billion barrel supply deficit accumulated over ten weeks. Chinese crude import data for April 2026 confirmed this is not a theoretical volume calculation but a measurable real-world contraction in flows to the world's largest crude importer.
Scenario Modelling: Three Plausible Oil Market Outcomes Through September 2026
Reading the Signals Correctly Across Each Pathway
The range of outcomes from this point forward is unusually wide, which itself reflects the binary nature of the resolution question. A diplomatic breakthrough produces a materially different price environment than a prolonged stalemate, and an escalation event produces a different one again. Moreover, OPEC market influence over production decisions adds another layer of uncertainty to each of the following scenarios.
Scenario A: Partial Diplomatic Resolution
- A framework agreement emerges from the Beijing summit beginning May 13, 2026
- Tanker operators reactivate AIS transponders and complete verified Gulf transit
- Marine tracking data from May 14 onward confirms physical cargo movement, not just a diplomatic announcement
- Brent retreats toward the $88 to $92 range as the risk premium partially unwinds, though the 1 billion barrel supply deficit prevents a full return to pre-disruption levels
Scenario B: Prolonged Stalemate (Base Case)
- Negotiations remain deadlocked through June and July 2026
- JPMorgan's commodities team has flagged June as an operational stress inflection point
- The market transitions from elevated pricing to physical scarcity, where refiners cannot source sufficient crude regardless of their willingness to pay higher spot prices
- Brent sustains above $100, with upward pressure toward $110 to $115
Scenario C: Escalation Event
- A maritime incident or military exchange further restricts tanker movement
- AIS disabling becomes effectively universal among Gulf-departing vessels
- Refinery throughput globally begins declining due to feedstock constraints
- Brent spikes toward $120 or above, triggering demand destruction and emergency releases from International Energy Agency member stockpiles
The June 2026 inflection point is significant because it marks a qualitative shift in market dynamics. Pricing in risk and pricing in scarcity are not the same condition. The former is a financial adjustment. The latter is a physical constraint that affects industrial output regardless of what prices do.
How the Trump Rejects Iran Peace Terms Fallout Is Spreading Across Asset Classes
The Inflation Feedback Loop Now Constrains Central Bank Policy
The repricing in crude markets is not staying contained within the energy sector. U.S. consumer price inflation for April 2026 is projected to show 3.8 percent year-over-year growth, an acceleration from 3.3 percent in March. This trajectory eliminates the Federal Reserve's practical ability to cut interest rates even if labour market conditions deteriorate, placing the central bank in a policy bind where both the inflation mandate and the employment mandate are pulling in opposite directions.
The consequences extend beyond U.S. monetary policy. Chinese consumers are simultaneously facing higher energy costs that compress household purchasing power and reduce discretionary spending across the broader Asian consumption base. The combined effect on the world's two largest economies simultaneously is a stagflationary feedback loop where high energy costs suppress growth while preventing the rate cuts that would normally support it.
Analysts at MUFG and ANZ have characterised the current market environment as a headline-reactive regime, where single diplomatic statements trigger multi-percent price swings. This is a structurally different risk environment from normal commodity market conditions, and it complicates hedging decisions for every energy-intensive business operating with multi-quarter planning horizons. Consequently, the broader market volatility reset already underway across asset classes has intensified further as energy risk bleeds into equities, bonds, and currency markets.
Sector-Level Vulnerability to Sustained Oil Supply Disruption
Which Industries Face the Most Immediate Margin Pressure
| Sector | Primary Exposure Mechanism | Margin Compression Risk |
|---|---|---|
| Airlines | Jet fuel as percentage of operating cost | High |
| Shipping and Logistics | Bunker fuel costs plus route deviation premiums | High |
| Petrochemicals and Plastics | Crude as primary feedstock | High |
| Energy-Intensive Manufacturing | Electricity and process energy costs | Medium-High |
| Consumer Goods (Asia-focused) | Reduced Chinese consumer discretionary spending | Medium |
| Agriculture | Fertiliser and transport fuel costs | Medium |
Why Conventional Hedging Strategies Break Down in Binary Geopolitical Scenarios
The fundamental problem for corporate risk managers is that the outcome of U.S.-Iran negotiations cannot be reliably modelled from any publicly available information. Diplomatic summit dates, ceasefire deadlines, and framework announcements all carry significant ambiguity about whether they represent genuine supply resolutions or temporary rhetorical pauses.
Options markets have responded by pricing in elevated volatility, increasing the cost of protective hedges substantially. Companies seeking to lock in price certainty through options are now paying significantly more for that certainty than they would have six months ago. Businesses with natural hedges, such as those with diversified energy sourcing, long-term supply contracts signed before the disruption, or geographic exposure to non-Gulf production regions, are materially better positioned than those relying on spot market procurement.
The next major ASX story will hit our subscribers first
The Beijing Summit as a Potential Circuit Breaker
Why a Diplomatic Statement Alone Is Not a Supply Resolution
The summit beginning Wednesday, May 13, 2026, represents the nearest-term opportunity for a diplomatic breakthrough. However, the energy market's validation of any agreement requires more than a press release or framework document. The Guardian's coverage of the latest developments underscores how swiftly oil prices climbed following Trump's dismissal of Iran's response, reinforcing that diplomatic language alone is insufficient to calm markets.
A genuine resolution requires the following observable sequence:
- Tanker operators reactivate AIS transponders on vessels in or departing the Gulf
- Those vessels complete full, uninterrupted transit through the Strait
- Cargo arrives at Asian or Western ports without Iranian interference
- Marine tracking data from May 14 onward confirms this movement across multiple vessel classes
Historical precedent shows that energy markets frequently over-react to diplomatic language before physical confirmation arrives, and then correct when actual supply data fails to match the optimism priced into futures. A sustained 48 to 72-hour window of verified transponder activity across multiple vessel types is the minimum credible signal that shipping has genuinely resumed.
Comparing the Current Disruption to Historical Oil Supply Shocks
| Event | Duration | Supply Impact | Peak Price Response |
|---|---|---|---|
| 1973 Arab Oil Embargo | ~6 months | ~7% of global supply removed | Prices approximately quadrupled |
| 1990 Gulf War (Iraq-Kuwait) | ~7 months | ~4.3 million barrels per day removed | Approximately 150% price surge |
| 2011 Libya Civil War | ~12 months | ~1.5 million barrels per day removed | Brent reached approximately $127 |
| 2019 Abqaiq-Khurais Attack | Hours to days | ~5% of global supply briefly | Approximately 15% single-day spike |
| 2026 Strait of Hormuz Closure | 10+ weeks ongoing | ~1 billion barrels removed | 3 to 4% on rejection news; Brent ~$105 |
The current disruption's defining characteristic is duration rather than single-event intensity. The 1973 embargo and the 1990 Gulf War were both resolved within months. The current situation shows no equivalent resolution pathway, and prolonged closures create compounding deficits that are qualitatively harder to reverse than acute shocks. A single refinery or pipeline attack can be repaired. However, a ten-week-plus cumulative supply deficit against the world's most critical energy corridor represents a structural market imbalance that persists in inventory levels and refining margins long after physical flows resume.
Long-Term Structural Consequences if the Disruption Extends Into Q4 2026
Trade Route Realignment and Energy Security Capital Reallocation
Every additional week the Strait remains effectively closed accelerates a set of longer-cycle structural changes that will persist regardless of how the immediate diplomatic situation resolves. Major importers in Asia and Europe are already beginning to lock in long-term supply contracts sourced outside the Gulf, a shift that structurally reduces Hormuz dependency over a multi-year horizon.
OPEC members with non-Gulf export capacity, including producers in West Africa, the North Sea, and the Americas, gain sustained pricing leverage in an environment where buyers are actively diversifying away from Gulf-sourced crude. Investment in Cape of Good Hope routing infrastructure, pipeline bypass projects, and LNG terminal capacity is accelerating as energy security displaces cost efficiency as the dominant capital allocation criterion for major importers.
The inflationary legacy of a prolonged disruption also reshapes monetary policy across multiple jurisdictions simultaneously. Sustained energy inflation above 3.5 percent year-over-year constrains rate-cutting cycles in the U.S., EU, and UK at the same moment. Emerging market central banks face the harder version of this dilemma: defend currencies against dollar strength or cut rates to support growth, with neither option available without significant collateral damage.
Corporate capital expenditure planning is already becoming more conservative as energy cost uncertainty extends beyond standard 12-month forecast horizons. Businesses that would ordinarily approve multi-year infrastructure investments are deferring decisions pending greater clarity on where energy input costs will stabilise, creating a secondary drag on economic growth that compounds the direct impact of higher crude prices. Furthermore, WTI and Brent futures positioning data confirms that institutional traders are extending their hedge horizons well beyond typical quarterly windows in response to this uncertainty.
Frequently Asked Questions
Why did Trump reject Iran's peace terms?
Iran's counter-proposals reportedly demanded complete removal of U.S. sanctions and formal U.S. recognition of Iranian control over the Strait of Hormuz. The U.S. administration categorically refused both conditions, citing strategic and legal constraints that made either concession incompatible with existing U.S. policy commitments in the region.
How much oil has been effectively removed from global supply?
Analysts estimate approximately 1 billion barrels have been removed from accessible global supply over the ten-week disruption period as of May 2026, based on the Strait's roughly 20% share of global oil and gas shipments and the duration of the effective closure.
What is the JPMorgan June 2026 warning?
JPMorgan's commodities team identified June 2026 as the point at which the disruption transitions from a price elevation event to a physical scarcity condition. This means refiners may be unable to secure sufficient crude to maintain planned output regardless of their willingness to pay prevailing spot prices, a qualitatively more severe market condition than simply elevated pricing.
What would confirm the Strait has actually reopened?
Verified reopening requires tankers to reactivate AIS transponders and complete full, uninterrupted transit to destination ports. Sustained transponder activity across multiple vessel classes over 48 to 72 hours following any diplomatic announcement is the minimum credible physical confirmation signal. Marine tracking data from May 14 onward is the relevant empirical test for any agreement reached at the Beijing summit.
What is Brent crude projected to average through 2026?
JPMorgan projects Brent crude averaging approximately $97 per barrel through 2026 under current disruption conditions, with analyst consensus placing the floor above $90 for the full year and a projected normalisation range of $80 to $85 extending into 2027.
How are Chinese crude imports being affected?
Chinese crude imports in April 2026 fell to their lowest level in nearly four years, providing empirical confirmation that the Strait closure is producing measurable real-world volume contraction in the world's largest crude importer, not merely elevated prices on paper.
This article contains forward-looking statements and scenario projections based on available information as of May 2026. Oil price forecasts, diplomatic outcome scenarios, and macroeconomic projections involve significant uncertainty and should not be construed as investment advice. Readers should conduct their own due diligence and consult qualified financial advisers before making investment decisions based on geopolitical risk analysis.
Want To Stay Ahead of the Next Major Resource Discovery Triggered by Energy Market Shifts?
While geopolitical disruptions reshape global oil markets and redirect capital flows across commodities, Discovery Alert's proprietary Discovery IQ model delivers real-time ASX mineral discovery alerts, turning complex market signals into actionable investment opportunities for both short-term traders and long-term investors — explore historic discovery returns to see what early positioning can mean, and begin your 14-day free trial today to secure a market-leading edge.