July 12, 2026
Trump threatens Iran oil sites has become a focal point of geopolitical tension as strategic energy infrastructure targeting emerges as one of the most consequential tools in modern conflict. The concentration of global oil transit through specific chokepoints transforms targeted infrastructure attacks into leverage mechanisms that extend far beyond regional boundaries, creating immediate cascading effects across interconnected supply chains and forcing rapid recalculation of risk premiums.
What Strategic Assets Make Iran's Energy Infrastructure a Geopolitical Target?
Kharg Island's Critical Role in Global Supply
Iran's offshore oil export terminal at Kharg Island represents one of the world's most strategically concentrated energy assets, historically handling approximately 90 percent of Iran's oil exports before comprehensive sanctions disrupted operations. The island's infrastructure comprises four Single Point Moorings (SPMs) connected to onshore storage facilities through subsea pipelines spanning 200 kilometres, with storage capacity exceeding 25 million barrels across multiple tank farms.
Before sanctions implementation, Iran's total crude oil production capacity reached approximately 3.8 million barrels per day, with Kharg Island functioning as the central export hub connecting to global markets. The pipeline network feeding the terminal includes diameter specifications ranging from 48 to 56 inches, designed to transport crude oil at volumes exceeding 3.5 million barrels per day under optimal conditions.
Historical precedent demonstrates the vulnerability of centralised export infrastructure to military targeting. During the Iran-Iraq War (1980-1988), attacks on Kharg Island's facilities reduced Iran's oil export capacity by up to 50 percent at various points during the conflict. When Iraqi forces targeted Iranian shipping and loading facilities, global oil prices responded sharply, surging from approximately $29 per barrel in 1985 to $46 per barrel in 1986, reflecting market responses to supply uncertainty according to U.S. Energy Information Administration data.
The technical specifications of Kharg Island's infrastructure reveal critical vulnerabilities that would concern military planners. Offshore loading terminals require specialised platform support vessels, specialised berthing facilities, and subsea pipeline integrity inspection equipment for repairs. These capacities are globally limited to approximately 12-15 specialised vessels worldwide, creating restoration timelines of 6-18 months for significant infrastructure damage.
Strait of Hormuz Chokepoint Economics
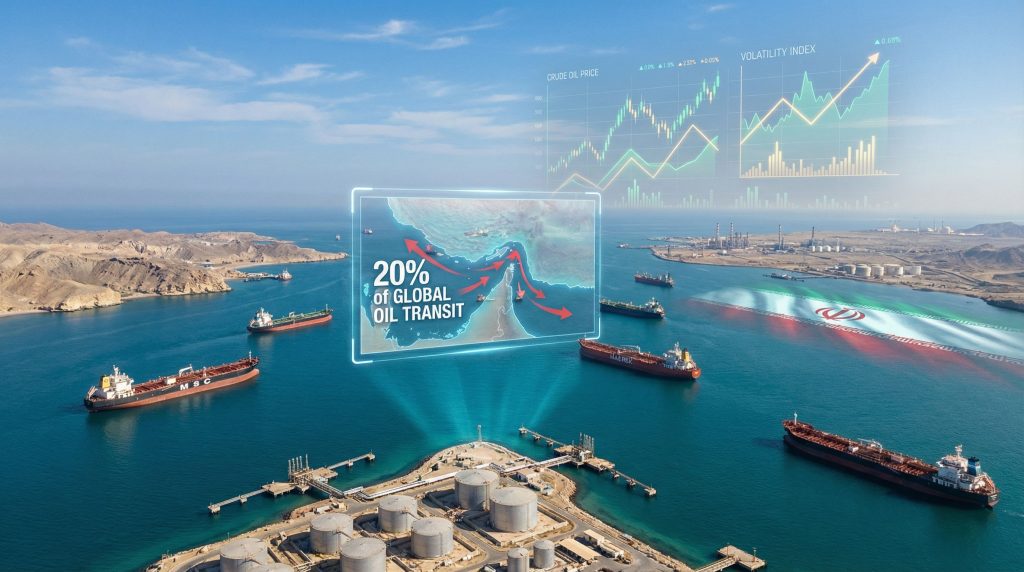
The Strait of Hormuz functions as the world's most critical maritime chokepoint for energy transportation, with approximately 21 million barrels per day transiting through the waterway according to the U.S. Energy Information Administration. This volume represents roughly 21 percent of global petroleum consumption, making the waterway indispensable for global energy security. Additionally, approximately 3.7 trillion cubic feet of liquefied natural gas equivalent transits the Strait annually through LNG carriers.
The geographic constraints of the Strait create physical limitations that establish its chokepoint characteristics:
• The waterway narrows to approximately 21 nautical miles at its narrowest point
• Shipping lanes are further constricted to two 2-nautical-mile corridors
• A 2-nautical-mile buffer zone separates the corridors under International Maritime Organisation protocols
• Disruption of either shipping lane would force all traffic through the remaining operational corridor
Economic modelling by the Oxford Institute for Energy Studies suggests that a complete closure of the Strait lasting 90 days could result in cumulative global GDP losses ranging from $500 billion to $1 trillion, depending on global response coordination and alternative supply activation. Furthermore, oil price movements under a hypothetical complete closure scenario have been modelled at peaks ranging from $150 to $300 per barrel.
Alternative routing around the Strait via the Cape of Good Hope extends transit time by approximately 21-31 days and increases shipping costs by an estimated $1.50-$3.00 per barrel due to additional fuel consumption, labour, and insurance costs. Current global tanker capacity is insufficient to execute complete diversion of Strait traffic to alternative routes for extended periods. Existing non-Strait pipeline capacity provides alternative pathways for only approximately 4-5 million barrels per day of crude, compared to the 21 million barrels per day transiting the Strait.
Iran's Power Generation Network Vulnerabilities
Iran's electrical generation infrastructure demonstrates geographic and technological vulnerabilities relevant to conflict scenario modelling. According to the International Energy Agency, Iran's installed electricity generation capacity exceeds 90 gigawatts, with the generation mix comprising:
• 43 GW from natural gas thermal plants
• 8.5 GW from hydroelectric facilities
• 8.4 GW from oil-fired thermal plants
• 2.0 GW from nuclear generation
The critical vulnerability lies in the concentration of natural gas generation capacity in thermal plants located in urban and industrial centres. Iran's domestic oil consumption for power generation reaches approximately 400,000 to 500,000 barrels per day during peak demand periods, representing approximately 10-13 percent of total crude oil production according to U.S. Energy Information Administration data.
Iran's arid climate necessitates desalination for approximately 40 percent of water supply for urban populations exceeding 80 million. Desalination capacity in Iran exceeds 4.5 million cubic metres daily distributed across facilities in coastal provinces. These plants require stable electrical supply, meaning disruption of power generation directly constrains freshwater availability within hours to days.
When big ASX news breaks, our subscribers know first
How Would Energy Infrastructure Targeting Impact Global Oil Prices?
Price Volatility Modelling Under Different Strike Scenarios
Historical analysis of oil price responses to Middle East conflicts provides empirical foundation for understanding how Trump threatens Iran oil sites scenarios might unfold. The 1973 Arab-Israeli War triggered the OPEC oil embargo, reducing global oil supply by approximately 7 percent (roughly 2.2 million barrels per day). This relatively modest supply reduction produced a crude oil price increase from approximately $3 per barrel to $12 per barrel within four months, representing a 300 percent increase.
The 1980-1988 Iran-Iraq War produced documented supply disruptions totalling 2-3 million barrels per day from Iranian production losses and tanker shipping interruptions. During this conflict, crude oil prices ranged from $25 to $46 per barrel, with particular spikes in 1986-1987 when Iranian export capacity fell sharply. However, the International Energy Agency documented that coordinated Strategic Petroleum Reserve releases totalling approximately 1.5 million barrels per day provided market stabilisation.
Contemporary supply disruption modelling by the International Energy Agency suggests the following price response scenarios:
| Disruption Level | Price Range | Timeframe |
|---|---|---|
| 2-3 Mb/d (Partial Kharg damage) | $100-$130/barrel | 2-4 weeks |
| 4-5 Mb/d (Complete Kharg closure) | $130-$180/barrel | 1-2 months |
| Strait closure (30+ days) | $140-$170/barrel* | 1-3 months |
*After strategic reserve deployment and demand destruction effects
Market reaction timeframes demonstrate rapid response followed by gradual stabilisation. Price spikes typically occur within hours to days of disruption announcement through futures markets. Market stabilisation typically occurs within 7-14 days as traders assess available supply alternatives and strategic reserve deployment, though physical market tightness typically manifests with a 2-4 week delay.
Strategic Petroleum Reserve Deployment Strategies
Global Strategic Petroleum Reserve capacity totals approximately 1.7 billion barrels across all nations and private industry storage according to the International Energy Agency. The distribution includes:
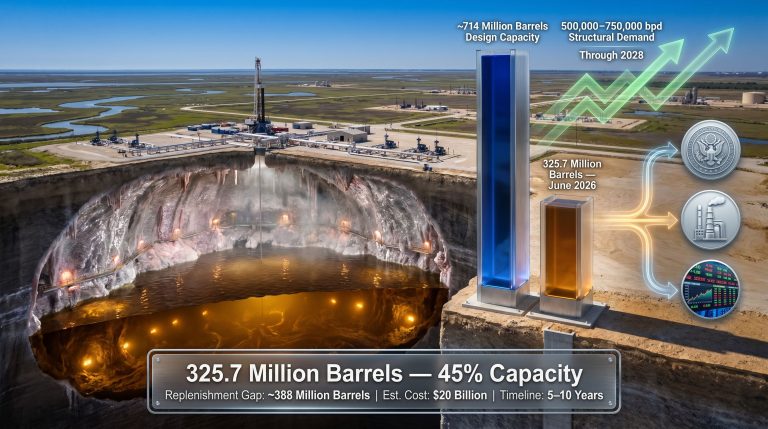
• United States: 714 million barrels maximum capacity (350-450 million barrels operational)
• Japan: 250-280 million barrels government reserves plus 100 million barrels private stocks
• European Union: 90 million barrels government reserves plus 300+ million barrels private reserves
Historical precedent shows that combined IEA member releases have reached approximately 3-4 million barrels per day for periods of 30-60 days during supply emergencies.
The most recent significant coordinated release occurred following the 2022 Russian invasion of Ukraine, when IEA members coordinated a 120-million-barrel release deployed over approximately 6 months, averaging roughly 650,000 barrels per day additional supply to markets.
Authorization timelines for Strategic Petroleum Reserve releases typically require 5-15 business days following political decision-making, though physical deployment begins immediately upon authorisation. Duration analysis indicates that sustained releases at historical rates can be maintained for approximately 30-40 days before reserve levels deplete to operationally critical levels.
Alternative Supply Chain Activation Timelines
Spare production capacity analysis demonstrates the critical constraint on supply response to disruptions. Current documented spare crude oil production capacity includes:
• Saudi Arabia: 2.0-2.5 million barrels per day
• United Arab Emirates: 0.8-1.2 million barrels per day
• Kuwait: 0.3-0.5 million barrels per day
• Iraq: 0.2-0.4 million barrels per day
Non-OPEC production ramp-up possibilities remain limited due to shale oil production lead times averaging 3-6 months for new well completion and 6-12 months for new drilling programmes. U.S. shale operators maintain approximately 1.0-1.5 million barrels per day of potential production increases achievable within 6 months under favourable pricing conditions.
Consequently, LNG market substitution effects for natural gas shortages demonstrate significant constraints. Global LNG shipping capacity utilisation typically operates at 85-90 percent during peak demand periods, leaving minimal flexibility for emergency diversions. Emergency LNG sourcing requires 2-4 weeks for contract renegotiation and vessel scheduling adjustments.
What Military and Economic Costs Would Infrastructure Strikes Entail?
Operational Complexity of Targeting Offshore Oil Facilities
Naval force requirements for sustained operations in the Persian Gulf present substantial logistical challenges for any military campaign targeting Iranian energy infrastructure. The Persian Gulf's confined geography creates tactical advantages for defensive forces whilst constraining offensive naval operations. The Gulf's maximum width of 200 nautical miles and average depth of 160 feet limits large vessel manoeuvrability and creates vulnerability to small boat swarms and coastal missile batteries.
Air defence penetration challenges for targeting offshore facilities like Kharg Island require multi-wave strike planning to overcome layered defensive systems. Iran maintains approximately 15-20 major surface-to-air missile sites protecting critical infrastructure, including S-300 and indigenous systems with engagement ranges exceeding 150 kilometres. Successful infrastructure targeting would require:
• 72-96 hours of sustained Suppression of Enemy Air Defences (SEAD) operations
• 12-18 specialised anti-ship missile platforms to neutralise coastal defences
• 24-36 precision-guided munitions for each major offshore loading platform
• 3-5 day sustained air operations to prevent rapid reconstruction
Logistics and supply chain considerations for extended campaigns demonstrate the resource intensity of infrastructure targeting operations. Sustained air operations require approximately 2,000-3,000 sorties over 30 days, consuming approximately 15,000-20,000 precision-guided munitions valued at $3-5 billion. Naval operations require continuous at-sea presence of 2-3 carrier strike groups plus support vessels, costing approximately $500 million per month in operational expenses.
Economic Warfare Calculations
Estimated reconstruction costs for Iranian energy infrastructure reveal the scale of economic impact from infrastructure targeting. Kharg Island's complete reconstruction would require approximately $15-25 billion over 24-36 months, according to infrastructure engineering assessments. This includes:
| Infrastructure Component | Reconstruction Cost | Timeline |
|---|---|---|
| Offshore loading terminals | $8-12 billion | 18-24 months |
| Subsea pipeline network | $3-5 billion | 12-18 months |
| Storage tank farms | $2-4 billion | 6-12 months |
| Supporting infrastructure | $2-4 billion | 6-18 months |
Revenue loss projections for Tehran's government budget demonstrate the economic pressure potential of infrastructure targeting. Iranian government revenues from oil exports historically provided 60-70 percent of total government income before sanctions. Complete loss of Kharg Island export capacity would eliminate approximately $80-120 billion annually in government revenues based on pre-sanctions export volumes and current oil prices.
Secondary economic impacts on regional trading partners extend beyond direct Iranian losses. Turkey receives approximately 15-20 percent of energy imports from Iran through pipeline connections. Iraq's southern oil terminals provide alternative routing for approximately 500,000 barrels per day, but increased utilisation would strain existing infrastructure and increase regional insurance premiums by an estimated 200-400 percent.
Escalation Risk Assessment Framework
Iranian retaliation capabilities against regional energy assets present substantial escalation risks that complicate infrastructure targeting strategies. Iran maintains proxy relationships with armed groups capable of targeting energy infrastructure across the region, including:
• Houthis in Yemen: Capable of targeting Saudi Red Sea export terminals
• Hezbollah in Lebanon: Capable of targeting Israeli offshore gas platforms
• Iraqi militias: Capable of targeting pipeline infrastructure and U.S. bases
• Syrian proxies: Capable of targeting pipeline infrastructure to Turkey
Proxy force activation scenarios suggest that Iranian retaliation could expand conflicts beyond bilateral U.S.-Iran engagement to regional infrastructure targeting affecting 3-5 additional countries within 72 hours of initial strikes. Regional energy infrastructure vulnerability assessments identify approximately 25-30 high-value targets across Saudi Arabia, UAE, Kuwait, and Iraq that remain within range of Iranian proxy capabilities.
International coalition stability under prolonged conflict conditions faces stress from divergent economic interests amongst allies. European allies maintain greater dependency on Middle Eastern energy imports, creating different risk tolerances for prolonged conflict. Similarly, Japan and South Korea face comparable constraints, potentially limiting coalition cohesion if conflicts extend beyond 60-90 days.
Which Regional Powers Face the Highest Energy Security Risks?
Gulf State Infrastructure Exposure Analysis
Saudi Aramco's infrastructure concentration creates significant vulnerability points despite substantial defensive investments. The company's critical export infrastructure includes:
• Ras Tanura terminal: 6-7 million barrels per day capacity
• Ju'aymah terminal: 3-4 million barrels per day capacity
• Yanbu terminal: 5-6 million barrels per day capacity (Red Sea)
• Abqaiq processing facility: 7 million barrels per day processing capacity
The 2019 drone attacks on Abqaiq demonstrated infrastructure vulnerability despite advanced defence systems. The attacks temporarily reduced Saudi production by approximately 5.7 million barrels per day and caused crude oil prices to spike 19 percent in a single day before stabilising as strategic reserves were deployed.
UAE's Abu Dhabi National Oil Company (ADNOC) operates critical infrastructure including the Fujairah terminal outside the Persian Gulf, providing alternative export routes for approximately 1.5-2.0 million barrels per day. However, the majority of UAE production still transits through Persian Gulf facilities vulnerable to Iranian retaliation scenarios.
Defence system capabilities across Gulf states include integrated air defence networks, but coverage gaps remain for offshore platforms and extended pipeline networks. Kuwait maintains defensive coverage for approximately 70 percent of critical infrastructure, whilst UAE coverage extends to approximately 80 percent of major facilities according to defence analysis assessments.
European Energy Import Dependency Scenarios
European natural gas supply route alternatives through Turkey and Russia face structural limitations during Middle Eastern supply disruptions. Turkey's pipeline capacity from Iran provides approximately 10-12 billion cubic metres annually to European markets, representing roughly 2-3 percent of European natural gas consumption.
LNG import terminal capacity utilisation rates across Europe typically operate at 75-85 percent during peak winter demand, leaving limited surge capacity for emergency supply diversions. Total European LNG regasification capacity reaches approximately 240 billion cubic metres annually, but ship-to-terminal matching and seasonal storage constraints limit emergency response flexibility.
Industrial sector impact assessments for prolonged Middle Eastern energy shortages identify particular vulnerabilities in:
• German chemical manufacturing: 25-30% production reduction likely
• Italian steel production: 15-20% capacity reduction likely
• French aluminium smelting: 20-25% production reduction likely
• Netherlands petrochemicals: 30-35% feedstock constraint likely
These industrial impacts would cascade through supply chains within 4-6 weeks of sustained energy shortages, according to European industrial association assessments.
Asian Market Disruption Modelling
China and India's Iranian oil import substitution strategies face significant constraints despite diversified supplier relationships. China historically imported approximately 500,000-800,000 barrels per day from Iran before sanctions, representing 5-8 percent of total Chinese crude imports. Alternative suppliers including Saudi Arabia, Iraq, and Russia maintain limited spare capacity for immediate substitution.
Japan and South Korea's energy security contingency plans emphasise LNG imports and strategic petroleum reserves, but both nations face particular vulnerabilities to Persian Gulf disruptions:
• Japan: 85% of crude oil imports transit the Strait of Hormuz
• South Korea: 70% of crude oil imports transit the Strait of Hormuz
• Combined strategic reserves: 90-120 days of consumption at current utilisation
Regional refinery configuration adaptability for different crude grades presents technical constraints on rapid supply substitution. Japanese refineries are configured for medium-heavy crude grades predominantly sourced from the Middle East, whilst alternative suppliers (Brazil, Mexico, Canada) produce lighter grades requiring 6-12 months for refinery optimisation adjustments.
How Do Ceasefire Negotiations Influence Energy Market Stability?
Diplomatic Leverage Through Energy Infrastructure Threats
Historical effectiveness of energy-focused coercive diplomacy demonstrates mixed results depending on target state economic structure and alliance relationships. The 1973 OPEC oil embargo achieved political objectives by forcing policy changes in target nations within 6 months, whilst the 1980s tanker war failed to achieve decisive political outcomes despite sustained infrastructure targeting over 8 years.
Negotiation timeline pressures created by market volatility establish distinct phases of diplomatic urgency:
• Days 1-7: Financial market speculation and initial position-taking
• Days 8-21: Physical market tightness begins affecting supply chains
• Days 22-45: Strategic reserve deployment and emergency coordination
• Days 46+: Demand destruction and permanent market reconfiguration begins
Third-party mediator incentives align with regional stability concerns, particularly for nations maintaining energy import dependencies. For instance, Pakistan, Turkey, and Qatar face direct economic consequences from Persian Gulf instability, creating strong incentives for active mediation. These nations maintain $15-25 billion in annual energy trade relationships that would face disruption from prolonged conflict.
Conditional Agreement Structures and Implementation Challenges
Phased reopening protocols for the Strait of Hormuz require complex coordination mechanisms between military forces, commercial shipping, and international monitoring. Historical precedent from the 1987-1988 "Tanker War" reflagging operations demonstrated the requirement for:
• 12-18 naval escort vessels for sustained commercial shipping protection
• International monitoring stations at 3-4 locations throughout the Strait
• Commercial shipping coordination involving 15-20 major shipping companies
• Insurance industry coordination for risk assessment and premium adjustments
Verification mechanisms for sustained shipping lane access require technological solutions including satellite monitoring, Automatic Identification System (AIS) tracking, and physical inspection protocols. Implementation costs for comprehensive monitoring systems range from $500 million to $1 billion for initial deployment plus $200-400 million annually for sustained operations.
Economic compensation frameworks for conflict-related damages face complex attribution challenges and precedent-setting implications. Infrastructure reconstruction costs, lost revenue calculations, and third-party economic impacts create potential compensation claims ranging from $50-200 billion depending on conflict duration and scope.
Market Confidence Restoration Timeframes
Insurance premium normalisation patterns post-conflict follow predictable phases based on historical analysis of Middle Eastern conflicts:
• Months 1-3: Premiums remain 300-500% above baseline levels
• Months 4-12: Gradual reduction to 150-250% above baseline
• Months 13-24: Stabilisation at 50-100% above pre-conflict levels
• Months 25+: Return to baseline with permanent risk premium adjustments
Investment return timelines for damaged infrastructure demonstrate the long-term economic consequences of energy infrastructure targeting. Major offshore facility reconstruction requires 18-36 months for completion, whilst full operational capacity restoration typically requires 24-48 months due to supply chain constraints and specialised equipment availability.
Long-term supply contract renegotiation cycles accelerate during and after infrastructure conflicts as buyers seek supply security assurances. Contract renegotiations typically begin within 3-6 months of conflict initiation and continue for 12-24 months post-conflict, often resulting in 10-25 percent price premiums for long-term supply security guarantees.
What Investment Strategies Emerge During Energy Infrastructure Conflicts?
Defensive Portfolio Positioning in Energy Markets
Commodity futures positioning strategies during geopolitical crises demonstrate distinct patterns based on historical analysis of Middle Eastern conflicts. Professional traders typically establish long positions in crude oil futures 30-60 days before expected conflict escalation, with position sizes ranging from 5-15 percent of total portfolio value. Natural gas futures positioning follows similar patterns, though with greater volatility due to regional market segmentation.
Energy sector equity performance patterns under supply disruptions show bifurcated results:
• Upstream producers typically gain 25-45% during supply disruptions
• Downstream refiners face margin compression from crude cost increases
• Pipeline operators benefit from increased utilisation of alternative routes
• Renewable energy stocks gain 15-30% from accelerated adoption expectations
Currency hedging approaches for oil-importing economies become critical during extended conflicts. The Japanese yen and South Korean won typically depreciate 5-15 percent against the U.S. dollar during Middle Eastern energy crises, whilst the Norwegian krone and Canadian dollar strengthen due to domestic energy production advantages.
Infrastructure Resilience Investment Opportunities
Renewable energy acceleration during fossil fuel supply uncertainty creates investment opportunities in multiple sectors. Historical analysis shows that major energy crises accelerate renewable energy investment by 20-40 percent above baseline trends for 2-3 years post-crisis. Wind and solar project development timelines compress from 24-36 months to 18-24 months as regulatory approval processes accelerate.
Strategic storage facility expansion projects demonstrate consistent investment returns during energy security crises. Underground storage development costs range from $3-8 per barrel of capacity, whilst operational returns during supply disruptions can reach $20-40 per barrel annually. Current global strategic storage capacity utilisation operates at approximately 75-85 percent, indicating expansion opportunities.
Alternative energy transportation infrastructure development includes:
• LNG terminal expansion: $2-5 billion per facility, 3-5 year development timeline
• Pipeline diversification: $5-15 million per kilometre, 2-4 year development timeline
• Floating storage: $200-500 million per vessel, 18-24 month delivery timeline
Regional Energy Security Enhancement Projects
Pipeline diversification initiatives away from conflict zones accelerate during infrastructure targeting scenarios. The Trans-Adriatic Pipeline (TAP) and Southern Gas Corridor projects gained $15-20 billion in additional financing commitments during 2020-2022 supply uncertainty periods. Similar acceleration patterns emerge during Middle Eastern conflicts, particularly with consideration of the OPEC meeting impact on market dynamics.
Domestic production capacity expansion programmes receive government support through tax incentives, regulatory streamlining, and direct subsidies during energy security crises. U.S. shale production expansion during 2014-2018 demonstrated the potential for 2-3 million barrels per day of additional production within 12-18 months under favourable policy conditions.
Emergency response system modernisation investments include advanced forecasting systems, automated switching capabilities, and redundant supply pathway development. These systems typically require $500 million to $2 billion in initial investments with 5-10 year payback periods through reduced crisis response costs and improved supply reliability.
The next major ASX story will hit our subscribers first
How Could This Conflict Reshape Long-Term Energy Geopolitics?
Permanent Supply Chain Reconfiguration Scenarios
Buyer diversification strategies away from Middle Eastern suppliers demonstrate accelerating trends following major supply disruptions. European natural gas import diversification following the 2022 Russian supply cuts provides a template for oil market reconfiguration. European LNG imports increased from 20 percent to 45 percent of total gas imports within 18 months, showing the speed of supply chain restructuring under crisis conditions.
New producer-consumer relationship development patterns emerge as traditional supply relationships face reliability questions. African oil producers (Nigeria, Angola, Algeria) have expanded market share in European and Asian markets during Middle Eastern supply uncertainty periods. These relationships typically stabilise at 20-30 percent above pre-crisis levels even after original suppliers return to markets.
Technology transfer acceleration for energy independence includes enhanced oil recovery techniques, unconventional resource development, and renewable energy integration systems. Crisis periods typically accelerate technology adoption by 3-5 years compared to baseline scenarios as governments prioritise energy security investments, with implications for US tariff implications on global supply chains.
Regulatory and Policy Response Evolution
Strategic reserve requirement modifications across major economies follow crisis patterns established during previous supply disruptions. The International Energy Agency recommends member nations maintain 90 days of net oil imports in strategic reserves, though many nations have increased targets to 120-180 days following recent geopolitical developments.
International energy security cooperation framework updates include enhanced information sharing, coordinated response protocols, and burden-sharing agreements for emergency supply releases. The IEA's emergency response system has evolved from 30-day response protocols in the 1970s to 72-hour activation capabilities in current frameworks.
Sanctions regime effectiveness and adaptation mechanisms demonstrate the evolution of economic warfare tools. Financial sanctions on energy trade require increasingly sophisticated bypass mechanisms, accelerating development of alternative payment systems and currency arrangements. These developments typically persist 5-10 years beyond immediate crisis resolution, reflecting broader implications of the US-China trade war impact on global economic structures.
Energy Transition Acceleration Under Crisis Conditions
Renewable energy investment surge patterns during supply crises show consistent 40-60 percent increases in annual investment levels for 2-3 years post-crisis. The 1973 oil crisis accelerated renewable energy research funding by 300 percent over subsequent years, whilst the 2008 oil price spike generated similar investment acceleration in wind and solar development.
Government policy fast-tracking for alternative energy projects includes regulatory streamlining, tax incentive expansion, and direct financing support. Crisis conditions typically compress renewable energy project approval timelines from 36-48 months to 18-24 months through emergency authorisation procedures.
Corporate energy strategy pivots toward supply chain resilience demonstrate permanent behavioural changes following major supply disruptions. Manufacturing companies typically increase on-site renewable energy generation by 25-40 percent and establish multiple supplier relationships for critical energy inputs following supply crisis experiences. This becomes particularly relevant when considering Trump tariffs global impact on manufacturing supply chains.
The prospect of Trump threatens Iran oil sites represents a significant inflection point in global energy security architecture. The interconnected nature of modern energy systems means that infrastructure targeting can produce cascading effects across multiple sectors and regions within hours of initial strikes.
Analysis from the BBC suggests that current geopolitical tensions surrounding Iranian energy infrastructure are reaching critical thresholds. Furthermore, market observers indicate that sustained infrastructure targeting could fundamentally alter global energy trade patterns for decades beyond immediate conflict resolution.
Investment Disclaimer: The analysis provided in this article is for informational purposes only and should not be construed as investment advice. Energy markets involve substantial risks, including the potential for significant losses. Geopolitical scenarios involve unpredictable variables that can affect market outcomes. Readers should consult with qualified financial advisors before making investment decisions and conduct their own due diligence regarding any investment strategies discussed.
Ready to Navigate Energy Market Opportunities in These Turbulent Times?
With geopolitical tensions reshaping energy markets and infrastructure vulnerabilities creating unprecedented volatility, Discovery Alert's proprietary Discovery IQ model delivers real-time notifications on significant mineral discoveries that could benefit from energy sector disruptions and commodity price shifts. Our advanced AI technology transforms complex market dynamics into actionable investment insights, ensuring you're positioned ahead of the broader market during these critical periods. Begin your 14-day free trial today to secure your competitive advantage as global energy markets evolve.