August 5, 2026
The Nuclear Fuel Cycle's Hidden Complexity: Why Uranium Prices Tell Only Part of the Story
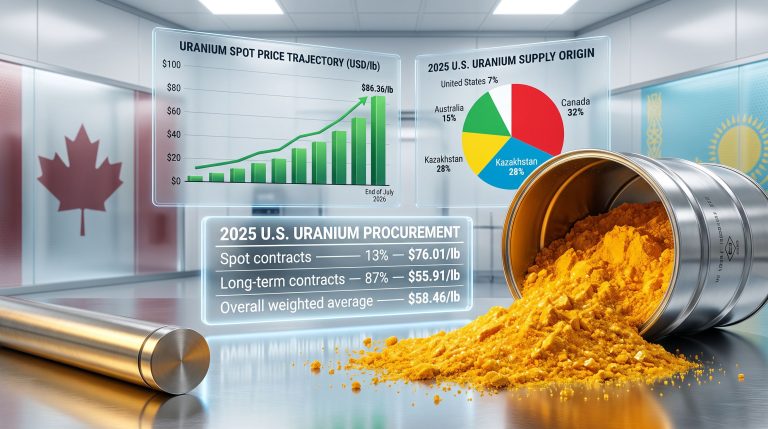
Commodity markets often reduce complex industrial realities to a single number. In uranium, that number is the spot price, which as of end-July 2026 sits at $86.36 per pound according to data published by Cameco, with futures tracking closely at $86.60/lb per Trading Economics. However, treating that figure as the complete picture of the U.S. uranium market fundamentals is a significant analytical shortfall.
The release of the U.S. Energy Information Administration's 2025 Uranium Marketing Annual Report offers a far more granular lens through which to examine the structural forces shaping supply, demand, and long-term pricing dynamics. For anyone tracking uranium prices steady as EIA releases annual market report data, the report functions as the definitive reference document for understanding what's actually happening beneath the surface of spot price movements.
When big ASX news breaks, our subscribers know first
What the EIA's Uranium Marketing Annual Report Actually Measures
Unlike commodity price trackers or broker commentary, the EIA's annual uranium report is built on verified survey data collected directly from U.S. market participants. The underlying Uranium Marketing Annual Survey captures a comprehensive cross-section of the nuclear fuel cycle, including:
- Uranium purchase contracts and delivery volumes from the prior year
- Forward delivery projections extending 10 years into the future
- Purchased enrichment services data
- Utility inventory levels
- Fuel assembly usage across the operating reactor fleet
This 10-year forward delivery projection framework is particularly significant. It provides a structural visibility window that no spot price chart can replicate, allowing analysts and procurement teams to map anticipated demand against contracted supply volumes across a full decade.
How Does the Fuel Cycle Add Complexity?
The breadth of data collection also reflects the multi-stage complexity of the nuclear fuel cycle itself. Uranium doesn't travel directly from mine to reactor. It passes through a series of distinct industrial processes, each with its own contracting structures, pricing dynamics, and geopolitical exposure. The uranium market dynamics at each stage of this process can shift independently of one another:
- Uranium concentrate (U₃O₈): Extracted and processed at the mine and mill level
- Conversion: Concentrate is chemically converted to uranium hexafluoride (UF₆)
- Enrichment: The proportion of fissile U-235 isotopes is increased through centrifuge or diffusion processes
- Fuel fabrication: Enriched uranium is manufactured into fuel assemblies specific to reactor design
- Delivery and inventory management: Assemblies are delivered to utilities, which manage strategic stockpiles
Each stage of the nuclear fuel cycle operates under distinct pricing regimes, contract durations, and geopolitical risk profiles. Understanding the EIA's integrated reporting across all five layers is what separates informed uranium market analysis from surface-level price watching.
A Structural Price Analysis: The Mid-$80s Consolidation in Context
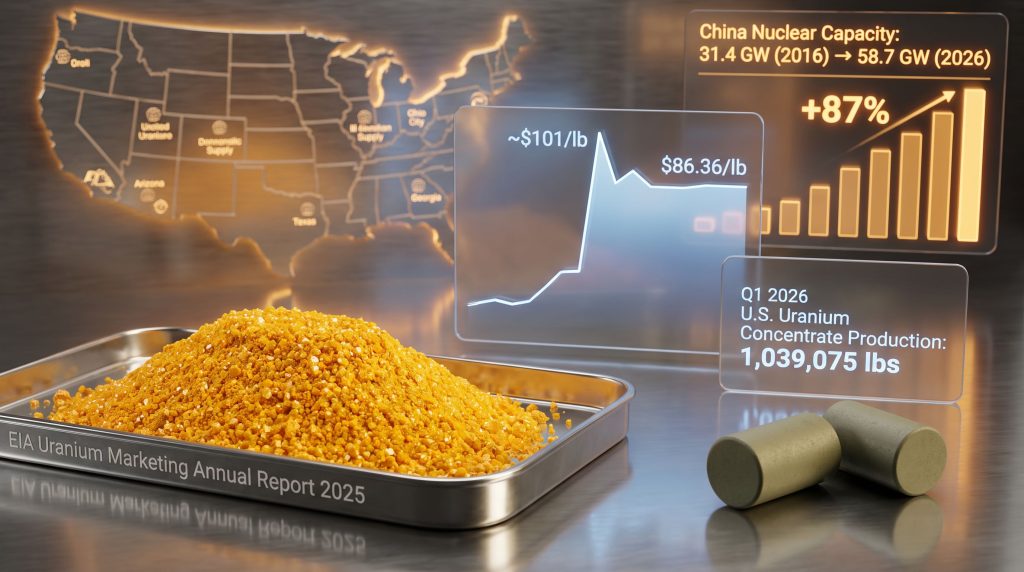
The current price environment requires historical framing to be properly interpreted. Uranium spot prices experienced a sharp upward move in late January 2026, briefly crossing above the $101/lb threshold before retreating steadily into the mid-$80s range where they have since stabilised.
| Period | Approximate Spot Price (USD/lb) |
|---|---|
| Late January 2026 | ~$101.00 |
| April 2026 | ~$86.35 |
| End of June 2026 | ~$85.00 |
| Prior Month (May 2026) | ~$84.18 |
| End of July 2026 | ~$86.36 |
This consolidation pattern is not unusual in commodity cycles. After a rapid price spike, markets frequently enter an extended equilibration phase as buyers and sellers reassess forward positioning. The more analytically interesting signal, however, lies in the relationship between spot prices and long-term contract prices. Furthermore, understanding uranium supply-demand volatility helps contextualise why this consolidation phase matters so significantly.
Long-term uranium contracts, which cover multi-year delivery commitments, have historically maintained a premium to spot during periods of supply constraint expectations. When spot prices soften while long-term prices hold firm, it typically reflects utility buyers remaining unwilling to leave forward supply positions uncovered, even when near-term spot appears more affordable.
A period of price consolidation in commodity markets is not the same as a period of market weakness. For uranium specifically, sustained spot stability in the mid-$80s may reflect a functioning equilibrium rather than softening fundamentals, particularly when long-term contract activity remains active.
U.S. Domestic Production: The Structural Supply Gap
How Does U.S. Production Compare to Demand?
One of the more revealing data points from recent EIA reporting is the state of domestic uranium concentrate production. US uranium production for the first quarter of 2026 reached 1,039,075 pounds of U₃O₈, representing a slight sequential decline from Q4 2025 levels.
To put this in perspective, the scale of annual U.S. reactor fuel requirements vastly exceeds domestic production capacity. With 92 reactors operating across the U.S. fleet at a median capacity factor of approximately 90.96% over the 2022–2024 survey period, the structural demand for enriched uranium fuel is enormous relative to what domestic mines can supply.
This gap is not a short-term aberration. It reflects decades of underinvestment in domestic U.S. uranium production infrastructure, driven partly by the historical availability of lower-cost offshore supply from Kazakhstan, Canada, Australia, and Russia. The consequence is a structural import dependency that utilities manage through a combination of:
- Long-term purchase contracts with foreign producers
- Conversion and enrichment service agreements with domestic and international providers
- Strategic inventory management at the utility level
- Secondary market purchases including re-enrichment of depleted uranium tails
It's worth noting that the capacity factor data itself carries important context. The U.S. reactor fleet's ability to operate at nearly 91% of rated capacity represents a hard-won operational achievement. This high utilisation rate means fuel demand is essentially constant and predictable, which amplifies the strategic importance of maintaining adequate forward purchase coverage.
Global Demand Pressure: China's Nuclear Expansion as a Market Variable
Understanding U.S. uranium market trends requires looking beyond domestic borders. The global uranium market is characterised by a relatively small number of major producing regions and an increasingly large and geographically diverse set of consuming nations. In addition, the Russian uranium import ban has introduced further pressure on Western utilities scrambling for alternative sources of supply.
China's nuclear expansion represents perhaps the most significant structural demand variable in the global uranium market. According to data compiled by the EIA in collaboration with the World Bank, Global Energy Monitor, Global Nuclear Power Tracker, and the IAEA, China's operational nuclear capacity grew from 31.4 GW in 2016 to 58.7 GW by May 2026, representing an 87% increase over a decade.
This growth trajectory has direct implications for U.S. and European utilities competing for long-term uranium supply. As Chinese utilities secure multi-year supply contracts to feed an expanding reactor fleet, the available pool of uncommitted mine production and enrichment capacity narrows. This competitive dynamic is one reason why long-term contract prices have remained relatively firm even as spot prices have pulled back from January 2026 highs.
U.S. Capacity Additions: The Gap Between Ambition and Reality
While China continues to rapidly commission new reactors, the U.S. domestic capacity addition picture is more complex. Despite construction permits having been submitted or approved at multiple sites, new commercial utility-scale nuclear generation in the United States remains several years away from contributing meaningfully to the grid.
This distinction between capacity factor optimisation of the existing fleet and new capacity addition is critical for uranium demand forecasting. Near-term uranium demand from U.S. reactors is largely predictable and tied to the 92-reactor operating fleet. The incremental demand from new capacity additions will emerge on a longer timeline.
What Role Will SMRs Play?
The small modular reactor (SMR) pipeline represents a structurally significant but longer-dated demand increment. Legislative interest in SMR feasibility has been demonstrated at the state level, with Pennsylvania's House of Representatives passing a unanimous 197-0 resolution directing a comprehensive study on the benefits of nuclear energy and SMR technology.
SMRs also introduce a notable fuel cycle complexity: many advanced reactor designs require high-assay low-enriched uranium (HALEU), which demands enrichment levels significantly higher than conventional reactor fuel. According to the EIA's uranium marketing data, this creates a distinct and emerging demand category within the broader market that warrants close monitoring.
The next major ASX story will hit our subscribers first
What $86/lb Means for Utilities, Producers, and Investors
Price stability in the mid-$80s range carries different implications depending on where a market participant sits in the supply chain.
For utilities: Stable spot prices can create a misleading sense of procurement security. Utilities with significant uncovered forward positions face the strategic risk of waiting for lower prices in a market where long-term contract availability may tighten. The EIA's inventory data, cross-referenced against forward delivery projections, provides the clearest signal of how urgently near-term contracting action may be required.
For producers: Current pricing at the mid-$80s level incentivises established operations with lower cost structures but remains challenging for high-cost greenfield development. The economics of new mine development typically require sustained long-term contract pricing rather than spot exposure, which is why producers actively manage portfolios that balance spot and contracted volumes.
For investors: Consolidated price action following a spike typically generates reduced speculative interest, with momentum-driven capital rotating elsewhere. However, for investors with a longer horizon, price consolidation periods often represent more attractive entry conditions than spike peaks. The EIA's annual data release functions as a sentiment anchor for institutional participants.
Key Metrics Summary: U.S. Uranium Market at a Glance
| Metric | Value / Status |
|---|---|
| End-of-July 2026 Spot Price | $86.36/lb |
| Uranium Futures Price (July 2026) | $86.60/lb |
| Price Stability Window (Spot) | February to July 2026 |
| Late January 2026 Peak | ~$101/lb |
| Q1 2026 U.S. Concentrate Production | 1,039,075 lbs |
| U.S. Reactor Fleet Median Capacity Factor | ~90.96% (2022–2024) |
| Operating U.S. Reactors in Survey | 92 reactors |
| China Nuclear Capacity (2016 vs. 2026) | 31.4 GW to 58.7 GW (+87%) |
Frequently Asked Questions: Uranium Prices and the EIA Annual Report
What Is the EIA Uranium Marketing Annual Report?
The EIA Uranium Marketing Annual Report is published each year by the U.S. Energy Information Administration and is the primary statistical reference document for the U.S. uranium market. It covers uranium contracts, purchase deliveries, enrichment services, utility inventories, fuel assembly usage, and forward delivery requirements projected across a 10-year window.
Why Are Uranium Prices Steady Around $86/lb?
The current consolidation reflects a natural market stabilisation following the spike to approximately $101/lb in late January 2026. Near-term supply and demand signals have been broadly balanced, with utility contracting activity providing a price floor while new mine supply development remains constrained. Futures prices have tracked closely with spot throughout this consolidation window.
What Is the Difference Between Spot and Long-Term Uranium Prices?
The spot price represents the current market rate for near-term or immediate delivery of uranium concentrate. Long-term prices are negotiated as part of multi-year supply contracts and typically reflect a utility's desire for supply security over immediate cost optimisation. Consequently, long-term prices tend to be more stable than spot and often carry a premium during periods when supply security is a primary concern.
What Would Cause Uranium Prices to Move Significantly From Current Levels?
Potential upside drivers include:
- Accelerated reactor restart programmes or fleet life extensions increasing demand
- A new wave of long-term contracting by utilities with uncovered forward positions
- Geopolitical disruptions to major producing regions such as Kazakhstan or Canada
- Faster-than-anticipated SMR deployment requiring HALEU supply
Potential downside risks include:
- Demand forecast revisions driven by macroeconomic slowdown
- Utility inventory drawdowns proving larger than anticipated
- Unexpected mine production increases from low-cost incumbent producers
Reading the EIA Data as a Strategic Instrument
The EIA's 2025 Uranium Marketing Annual Report is more than a historical data compilation. Its 10-year forward delivery projection framework provides a structural map of future demand commitments against anticipated supply, making it an indispensable tool for procurement strategy, investment analysis, and policy assessment. Furthermore, reviewing current uranium market trends alongside this report enables a more complete understanding of where the market is heading.
With uranium prices steady as EIA releases annual market report findings, the surface narrative of a calm market conceals a structurally complex picture. Domestic U.S. production covers only a fraction of reactor fuel requirements. Global demand pressure from China's rapidly expanding fleet is competing with Western buyers for long-term supply. New capacity additions in the U.S. remain years away from contributing to fuel demand. And SMR programmes are beginning to define an entirely new category of enrichment and fuel cycle requirements.
Monitoring the EIA's enrichment services data alongside raw spot price movements, tracking the spread between spot and long-term contract prices, and understanding the full five-stage nuclear fuel cycle are the analytical foundations required to move beyond headline price watching. The ANS Nuclear Newswire provides additional ongoing coverage of spot price developments and broader nuclear industry dynamics for those seeking further reference.
Disclaimer: This article contains forward-looking analysis, market projections, and scenario-based commentary for informational purposes only. It does not constitute financial or investment advice. Commodity markets involve significant uncertainty and readers should conduct independent research before making any investment decisions.
Ready to Act on the Next Major Uranium Discovery Before the Broader Market?
Discovery Alert's proprietary Discovery IQ model scans ASX announcements in real time, instantly identifying significant mineral discoveries — including uranium — and delivering actionable alerts to subscribers ahead of the crowd; explore historic examples of exceptional discovery returns to understand the opportunity, then begin your 14-day free trial at Discovery Alert to position yourself at the forefront of the next major find.